Introduction
The retinal pigment epithelium (RPE), located at the back of the vertebrate eye, has multiple roles in the physiology of the vertebrate visual system. Among these are water and ion transport, phagocytosis of shed photoreceptor outer segments, and enzymatic regeneration of trans-retinoids from photoreceptors, called the visual cycle (Steinberg & Miller, Reference Steinberg, Miller, Zinn and Marmor1979; Burnside & Bost-Usinger, Reference Burnside, Bost-Usinger, Marmor and Wolfensberger1998; Travis et al., Reference Travis, Golczak, Moise and Palczewski2007). RPE cells contain numerous melanin pigment granules (melanosomes). Melanosomes are believed to help improve visual acuity by providing a black background for absorption of stray light hitting the retina (Back et al., Reference Back, Donner and Reuter1965). In the eyes of fish, frogs, some amphibians, and birds in which the eye lacks a dilatable pupil, melanosomes have the additional function of forming a movable screen to control light flux to the photoreceptors. RPE cells in these species have extremely long apical projections, up to 100 µm in some fish species, through which melanosomes migrate. This mass migration of melanosomes and the light-dependent shortening and lengthening of rod and cone photoreceptors are termed retinomotor movements. Unlike the more subtle movements of melanosomes observed in mammals, in fish RPE, light stimulates melanosomes to disperse throughout the cell body (CB) and into long apical projections that interdigitate with photoreceptors, thus protecting rod photoreceptors from bleaching. In the dark, melanosomes move out of the apical projections back toward the CB, thus allowing maximum light absorption by the cone photoreceptors (Burnside & Nagle, Reference Burnside, Nagle, Osborne and Chader1983; Burnside & Bost-Usinger, Reference Burnside, Bost-Usinger, Marmor and Wolfensberger1998; Burnside & King-Smith, Reference Burnside, King-Smith, Dartt, Besharse, Dana and Batelle2010, reviews).
The phenomenon of light-dependent melanosome motility in RPE piqued the curiosity of researchers a century ago (Arey, Reference Arey1915, review). In the RPE of fish, both microtubules and actin filaments, the cytoskeletal tracks for organelle motility, are present in apical projections, and both contribute to melanosome motility. Microtubule disruption in vivo or in eyecup preparations in situ blocked melanosome movement in both the RPE CB and apical projections (Burnside et al., Reference Burnside, Adler and O’Connor1983; Troutt & Burnside, Reference Troutt and Burnside1989). However, in dissociated RPE cells cultured in vitro, depolymerization of microtubules had no effect on pigment granule movement through apical projections. Rather, disruption of actin filaments blocked both pigment granule aggregation and dispersion (King-Smith et al., Reference King-Smith, Paz, Lee, Lam and Burnside1997). These results suggest that microtubules in apical projections serve primarily in a structural capacity by stabilizing the long slender apical projections. In isolated cells, apical projections spread outward radially from the central CB, some attaching to the glass substrate, which helps to prevent them from collapsing when microtubules are depolymerized, allowing melanosomes to move through them unimpeded. In contrast, actin filaments within apical projections are both necessary and sufficient for aggregation and dispersion of melanosomes (King-Smith et al., Reference King-Smith, Paz, Lee, Lam and Burnside1997).
The actin-dependence of melanosome migration within apical projections suggests a role for myosin motors in motility. In vitro assays using isolated melanosomes from fish RPE demonstrated that melanosomes may interact with multiple myosin motors, based on the wide range of motility rates observed (McNeil et al., Reference McNeil, Tacelosky, Basciano, Biallas, Williams, Damiani, Deacon, Fox, Stewart, Petruzzi, Osborn, Klinger, Sellers and Smith2004). Myosin VIIa, the small GTPase, rab27a, and a myosin-Rab interacting protein, MyRip, have been localized to melanosomes in mammalian RPE and have been implicated in helping to maintain the position of melanosomes within cells (Liu et al., Reference Liu, Ondek and Williams1998; El-Amraoui et al., Reference El-Amraoui, Schonn, Kussel-Andermann, Blanchard, Desnos, Henry, Wolfrum, Darchen and Petit2002; Futter et al. Reference Futter, Ramalho, Jaissle, Seeliger and Seabra2004; Gibbs et al., Reference Gibbs, Azarian, Lillo, Kitamoto, Klomp, Steel, Libby and Williams2004). Interestingly, in myosin VIIa-deficient “shaker” mice, melanosomes in RPE cells displayed a higher proportion of high velocity movements compared to the wild type, suggesting that the motor may tether melanosomes to restrict their motility in some way (Gibbs et al., Reference Gibbs, Azarian, Lillo, Kitamoto, Klomp, Steel, Libby and Williams2004).
As in mammalian RPE, myosin VIIa and rab27a are enriched on RPE melanosomes from fish (McNeil et al., Reference McNeil, Tacelosky, Basciano, Biallas, Williams, Damiani, Deacon, Fox, Stewart, Petruzzi, Osborn, Klinger, Sellers and Smith2004). Most myosin motors, including myosin VIIa, walk along actin filaments toward the barbed (fast-growing) end. Whether myosin VIIa in fish RPE is involved in actual translocation of melanosomes or in tethering them in place is not clear. Regardless, determining the polarity orientation of actin filaments in RPE apical projections is necessary to allow predictions of what motors could be effecting melanosome aggregation and dispersion.
Previous research using the myosin-II inhibitor, blebbistatin, and rho kinase (ROCK) inhibitors demonstrated a role for myosin II in melanosome aggregation, but not dispersion (Barsoum & King-Smith, Reference Barsoum and King-Smith2007). These findings, together with careful observations of melanosome motility characteristics during aggregation and dispersion, led to an hypothesis for melanosome transport, where dispersion occurs via myosin motor transport along actin filaments, whereas aggregation occurs by binding of melanosomes to actin filaments undergoing myosin-II-dependent retrograde flow (King Smith et al., Reference King-Smith, Paz, Lee, Lam and Burnside1997; Barsoum & King-Smith, Reference Barsoum and King-Smith2007). Organelle transport via attachment to moving actin cables has been previously described for retrograde transport of mitochondria in yeast cells, which occurs by association of a protein complex (the “mitochore”) with moving actin cables, powered by myosin II (Ferenbacher et al., Reference Fehrenbacher, Yang, Gay, Huckaba and Pon2004; Huckaba et al., Reference Huckaba, Lipkin and Pon2006, Peraza-Reyes et al., Reference Peraza-Reyes, Crider and Pon2010, review).
These hypotheses predict that F-actin within apical projections is oriented with barbed ends oriented toward the distal tips of apical projections. In the current study, we characterized the polarity orientation of F-actin in isolated fish RPE cells by decoration with myosin subfragment I (S1). Additionally, we show that treatment of isolated cells or RPE sheets with the lectin, Concanavalin A, has no effect on melanosome dispersion but inhibits aggregation, presumably by crosslinking of transmembrane proteins that interact with the underlying actin cortex undergoing retrograde flow.
Materials and methods
All procedures for treatment of fish and isolation of RPE cells were in accordance with Policies on the Use of Animals in Neuroscience Research (Society for Neuroscience). Green sunfish, Lepomis cyanellus, or bluegill, Lepomis macrochirus, were obtained from Musky Trout Hatchery (Asbury, NJ), Zetts Tristate Fish Farm and Hatchery (Inwood, WV) or Fender’s Fish Hatchery and Llama Farm (Baltic, OH) and maintained in dechlorinated aerated water in laboratory aquaria on a 14 h:10 h light:dark cycle. Fish were fed with floating fish chow and maintained in the laboratory for at least 2 weeks prior to experimentation.
RPE cell isolation
RPE cells were isolated as described previously (King-Smith et al., Reference King-Smith, Paz, Lee, Lam and Burnside1997; King-Smith, Reference King-Smith2009). Fish were dark adapted for at least 30 min and anesthetized in 75 mg/L MS-222 (Tricaine, Sigma-Aldrich, St. Louis, MO). After spinal section and pithing, eyes were removed, hemisected, the retina removed, and RPE sheets (clumps of RPE cells 0.5–4 mm in diameter) were flushed out of the posterior eyecup using HEPES-buffered Earle’s Ringer solution (HER; 116.3 mM NaCl, 5.4 mM KCl, 1.8 mM CaCl2, 0.8 mM MgSO4, 1 mM Na2HPO4, 4 mM NaHCO3, 25.5 mM glucose, 21 mM HEPES, pH 7.2). To dissociate cells, RPE sheets were incubated in 10 units/ml papain activated with 3 µM cysteine in calcium- and magnesium-free HER containing 0.14 mg/ml DNase for 30 min, washed in HER containing 0.5% BSA (HERB), mechanically disrupted by trituration using a syringe, and plated on poly-L-lysine coated coverslips.
Fluorescent labeling and deconvolution
Isolated RPE cells were triggered to aggregate or disperse melanosomes by application of 1 mM cAMP in HERB or 10 µM dopamine in HERB, respectively, for 30 min. RPE cells having fully dispersed or aggregated melanosomes were fixed in 4% paraformaldehyde and 4% sucrose in PHEM buffer (50 mM Pipes; 25 mM HEPES; 8 mM EGTA; 2 mM MgCl2; pH 6.9) for 30 min. Fixed cells were washed with phosphate buffered saline (PBS) and incubated in permeabilization buffer (0.1% saponin, 0.5% BSA in PBS or 0.1% Triton-X-100 in PHEM) for 30 min. Cells were labeled with anti-β tubulin antibody (Sigma, mouse monoclonal clone D66, #T0198) at a final concentration of 10 µg/mL and anti-mouse IgG secondary antibody conjugated to Alexa 488 (Invitrogen, Carlsbad, CA). F-actin was labeled using rhodamine phalloidin at either 200 nM (Sigma) or 165 nM (Molecular Probes, Eugene, OR). Cells were mounted in 80% glycerol, 20% PBS containing 4% n-propyl gallate and viewed using the 100× oil immersion objective on an AX-70 Olympus microscope with a Sensi-Cam camera (Cooke Corp, Auburn Hills, MI). Micrographs were taken using Slidebook 3.0.10.1 software. Deconvolution of double-labeled images was carried out using a nearest-neighbor algorithm on a series of images (at least 6 frames) 0.1 µm apart along the Z-axis for both the green (Alexa 488) and red (TRITC) channels.
Myosin S1 labeling
Isolated RPE cells were stimulated to aggregate or disperse melanosomes, then prepared for platinum replica shadowing following procedures of Svitkina and Borisy (Reference Svitkina and Borisy1998). Briefly, cells were extracted in buffer containing 1% Triton X-100, phalloidin, and taxol in PEM buffer, incubated in 0.25 mg/mL S1 (provided by T. Svitkina, University of Pennsylvania), rinsed, fixed in 2% glutaraldehyde in 0.1 M sodium cacodylate buffer, postfixed in tannic acid and uranyl acetate, then processed for critical point drying and platinum shadowing. Replicas were viewed on a JEOL JEM 1010 (JEOL-USA Inc., Peabody, MA).
Polarity orientation of S1-decorated actin filaments was determined following guidelines described by Svitkina and Borisy (Reference Svitkina and Borisy1998). S1-decorated actin appears as a series of successive arrowheads or as a helical rope, comprised of numerous turns possessing an asymmetrical quality that allows for determination of polarity. The pointed end of the arrowhead or the thicker part of a single turn corresponds to the pointed end (minus end) of the actin filament.
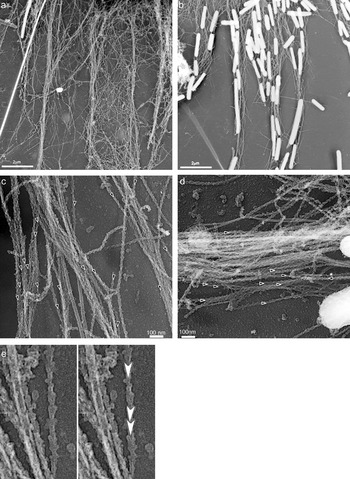
Actin filaments in isolated RPE cells decorated with myosin S1 revealed by platinum replica shadowing. (a) RPE cell with aggregated melanosomes. The CB is at the top of the figure, apical projections extend toward the bottom; (b) RPE cell with dispersed melanosomes; CB is at the top; (c, d) bundles of actin filaments within RPE apical projections decorated with S1. CB toward the bottom (c) or toward the right (d). Asterisk in (d) shows a single actin filament with barbed end oriented toward the CB. (e) Details of the labeled filament in the upper center of panel (c), illustrating the arrow-head structure.

F-actin polarity was determined by observation of electron micrographs of individual apical projections in both dispersed and aggregated cells. Printed and on-screen images were viewed simultaneously to ensure maximal clarity. Distal and proximal orientation of apical projections was revealed only after polarity of actin filaments was scored. Polarity was scored from actin bundles only (with the exception of straying filaments whose origin could be traced) to avoid including filaments disturbed during preparation. A single filament’s polarity was determined if a minimum of three arrowheads or asymmetrical turns distinctly pointed in the same direction, without any opposing elements present.
Lectin experiments
Concanavalin A (ConA, Calbiochem/EMD Millipore, Billerica, MA) and succinyl ConA (Sigma) were stored at −20°C and diluted to 100 µg/mL in HERB. To test the effect of lectins on melanosome aggregation, dissociated RPE cells were first incubated in 10 µM dopamine/HERB to achieve maximum melanosome dispersion; then cells were incubated in 100 μg/mL ConA or succinyl ConA (a bivalent lectin) in HERB/dopamine for 30–60 min. The medium was then changed to 1 mM cAMP to trigger melanosome aggregation, still in the presence of lectin. Cells were fixed at various times after cAMP addition in 0.5% formaldehyde, 0.5% glutaraldehyde, 0.8 % K3Fe(CN)6 in PHEM buffer. To test effects on dispersion, cells were treated with 1 mM cAMP in HERB to aggregate melanosomes, incubated with or without 100 µg/mL ConA or succinyl ConA in cAMP/HERB for 60 min, then melanosome dispersion was triggered by cAMP washout in 10 µM dopamine with or without lectin. Experiments to test effects of lectins on aggregation or dispersion were repeated at least three times. Lectin experiments were also carried out on RPE sheets. The RPE from two eyes of a single fish were pooled, separated into treatment groups, and transferred to HERB+ dopamine, with or without ConA, in parafilm-lined wells of a 24-well plate, to avoid their sticking to the plastic. Experiments with RPE sheets were carried out twice.
Fixed cells were viewed using a 40× oil phase contrast objective. Pigment index (PI) of isolated cells (King-Smith et al., Reference King-Smith, Paz, Lee, Lam and Burnside1997), a measurement of the extent of pigment granule aggregation or dispersion, was determined using Image-Pro-Plus software (BD) or Image J. PI is determined using 1) the area of polygon formed by connecting the distal most tips of the apical projections of the radially symmetrical RPE cells (outer area, OA); 2) the area of the polygon formed by connecting the distal most pigment granule in each apical projection (inner area, IA) and 3) area of the central CB. PI is equal to the ratio of the inner area-CB area to the outer area-CB area (IA-CB/OA-CB). Thus, PI of a completely dispersed cell approaches 1 and that of completely aggregated cells is near 0. All PI measurements were done blind, and at least 25 cells for each treatment were measured.
RPE sheets were fixed as described above then chopped into pieces consisting of single cells and clumps of several cells using a single-edge razor blade in a droplet of fixative (Garcia and Burnside, Reference Garcia and Burnside1994). PI for RPE sheets is the distance of the most distal pigment granule in an apical projection to the basal side, divided by the total apical–basal distance. PI of a fully dispersed cell is close to 1.0, and a fully aggregated cell has a PI of about 0.7. Fifty to seventy measurements were taken for each treatment, two to three measurements per cell. PI for both isolated cells and RPE sheets were compared using an ANOVA and Bonferroni post-hoc tests (SPSS). A probability (P) value less than 0.05 was considered significant.
Video micrography, latex bead preparation
Isolated cells on coverslips were mounted on a glass slide with double-stick tape spacers to form a perfusion chamber and viewed using phase contrast microscopy with a 100× oil objective, as described previously (Barsoum & King-Smith, Reference Barsoum and King-Smith2007). RPE sheets were placed in perfusion chambers in a drop of medium containing 1 mM cAMP to trigger aggregation. Images were collected every 10 s. Fluorescent latex beads (Polysciences, Warrington, PA) 0.5 μm in diameter were coated in polyethylenimine as described previously (Basciano & King-Smith, Reference Basciano and King-Smith2002). After overnight incubation, dissociated cells attached to coverslips were treated with cAMP to aggregate melanosomes, then treated with or without ConA. Coverslips were mounted on slides with spacers and perfused with a dilute latex bead solution. For all videos, images were collected every 10 s, and the distance of attached beads or melanosomes from the central cell was measured from single frames using Image J. Rates were calculated using the slope of a best-fit straight line.
Results
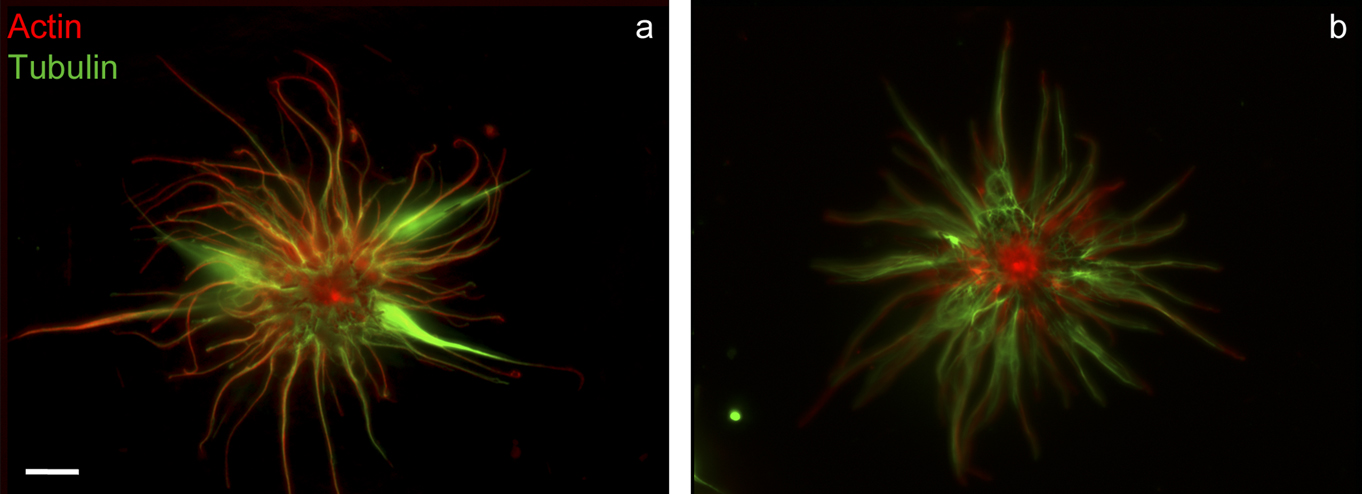
Previous studies described the organization of microtubules and actin filaments in isolated RPE cells (Bruenner & Burnside, Reference Bruenner and Burnside1986; King-Smith et al., Reference King-Smith, Paz, Lee, Lam and Burnside1997). As described in those reports, both actin filaments and microtubules are present in fish RPE apical projections, and fluorescent labeling shows that both cytoskeletal structures are present together throughout the length of apical projections. Longitudinally oriented actin filament and microtubule bundles appear aligned in some areas of the apical projections (Fig. 1). Deconvolution fluorescence microscopy of double-labeled cells was undertaken to look more closely at F-actin and tubulin labeling to determine if any differences were apparent depending on pigment granule position. No consistent differences in F-actin or microtubule distribution were observed among cells having aggregated (Fig. 1a) or dispersed (Fig. 1b) melanosomes.
RPE cell with fully aggregated (a) or dispersed (b) melanosomes labeled with rhodamine-phalloidin and anti-tubulin; deconvolved merged projection images. Scale bar = 10 µm.

S1 labeling of F-actin
We undertook platinum replica shadowing of myosin S1-decorated RPE cells to characterize the distribution of F-actin in RPE apical projections at the ultrastructural level and to determine the polarity organization of F-actin within projections. Actin filaments form a dense meshwork of overlapping filaments near the wide base of the projection, closest to the central CB (Fig. 2a). In many apical projections, about one half to three quarters toward the distal part of the projection, filaments converge to form longitudinal bundles. Melanosomes crowd together in the proximal regions of the apical projections in dispersed cells, but often align in a single file in the narrower, more distal regions of the projection (Fig. 2b).
S1-decorated actin filaments were scored in RPE cells having either dispersed or aggregated melanosomes, although the majority of data was gathered from aggregated cells, since actin filaments were not obstructed by melanosomes in projections. F-actin bundles in 99% of apical projections observed were oriented uniformly with barbed ends facing the distal tips (Figs. 2c and 2d; n = 23 apical projections of 17 cells). Only one apical projection observed featured mixed actin polarity; individual filaments distinct from the actin bundle within this projection were visible, and one filament had its barbed ends oriented toward the CB (Fig. 2d, asterisk). It is possible that this actin bundle was disturbed during preparation, resulting in a folded or broken filament having apparently opposite polarity orientation.
Effect of lectins on melanosome motility
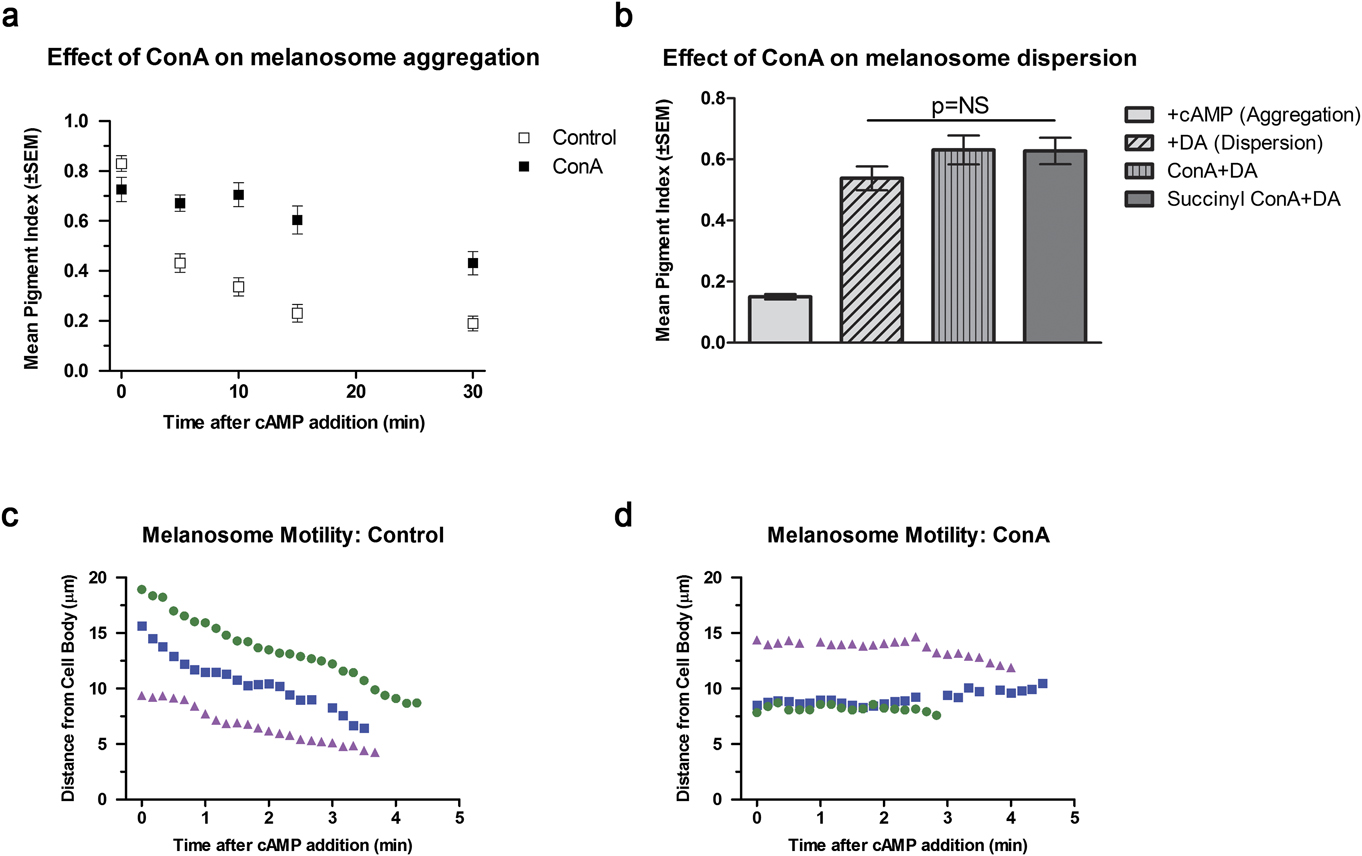
RPE cells were treated with the tetravalent lectin, Concanavalin A, then stimulated to aggregate or disperse melanosomes. For aggregation, cells were fixed at different time periods after addition of cAMP, and the extent of aggregation was determined by measuring PI. Cells pre-incubated in ConA then triggered to aggregate melanosomes had a significantly higher PI compared to control cells after 30 min (ANOVA and Bonferroni post-hoc test; P < 0.05; Fig. 3a). Treatment with succinyl ConA, a bivalent lectin, showed some inhibition of aggregation at early time periods after triggering aggregation, but PI was not significantly different between treated and control cells at later time periods (data not shown). Videomicrography of control and lectin-treated cells was carried out to investigate effects of lectin on individual melanosome motility. Cells stimulated to aggregate melanosomes using cAMP demonstrated continuous motility of individual melanosomes toward the CB at a rate of 1.5–2.2 μm/min (Fig. 3c, Video 1), while melanosomes in ConA-treated cells showed little net movement toward the CB, staying stationary or oscillating slightly (Fig. 3d, Video 2). Since frames were collected every 10 s in videos of ConA and control cells, motility events on the order of microns per second are not discernable. Thus, instantaneous velocities of melanosomes may differ from the overall motility rate measured using the slope of a best-fit straight line. Nevertheless, comparison of motility in control and ConA-treated cells shows that lectin treatment greatly impaired not only net movement of melanosomes (measured as the PI in fixed cells, Fig. 3a) but also motility of individual melanosomes.
Effect of lectin on melanosome motility in dissociated RPE cells. (a) Effect of ConA on aggregation. Cells were pretreated in 100 µg/mL ConA, then triggered to aggregate melanosomes by addition of cAMP. Cells were fixed at various times after cAMP addition, and PI was measured to determine the extent of aggregation or dispersion. Open symbols: control cells; closed symbols: cells treated with ConA. Mean PI ± SEM, N = at least 25 cells for each treatment; results of a typical experiment. PI of controls is significantly higher than treated cells at all time points after t = 0 (ANOVA and Bonferroni post-hoc test; P < 0.05). (b) Effect of lectins on dispersion. Cells having aggregated melanosomes were preincubated in cAMP alone, or cAMP and ConA or succinyl ConA for 60 min, then triggered to disperse for 30 min. +cAMP (aggregation): PI of cells with aggregated melanosomes prior to dispersion. +DA (dispersion), PI of control cells triggered to disperse in 10 µM dopamine; ConA + DA: cells pretreated in ConA, triggered to disperse in dopamine + ConA; Succinyl ConA + DA: cell pretreated in succinyl ConA, treated with dopamine + succinyl ConA. Mean PI ± SEM, N = at least 25 cells for each treatment; results of a typical experiment. Mean PI of treated and untreated cells triggered to disperse melanosomes are not significantly different. (c, d) Motility of individual melanosomes in cells triggered to aggregate in (c) control cells (see Video 1) and (d) ConA-treated cells (see Video 2).

To determine the effects of ConA on melanosome dispersion, isolated RPE cells with aggregated melanosomes were treated with ConA for 60 min, then triggered to disperse for 30 min. Unlike the effect on aggregation, lectins had no effect on dispersion; cells treated with ConA or succinyl ConA dispersed melanosomes equally well as control cells (Fig. 3b). The inhibition of melanosome aggregation in the presence of lectins, and the lack of any effect of lectins on melanosome dispersion support the hypothesis that two distinct mechanisms control aggregation and dispersion.
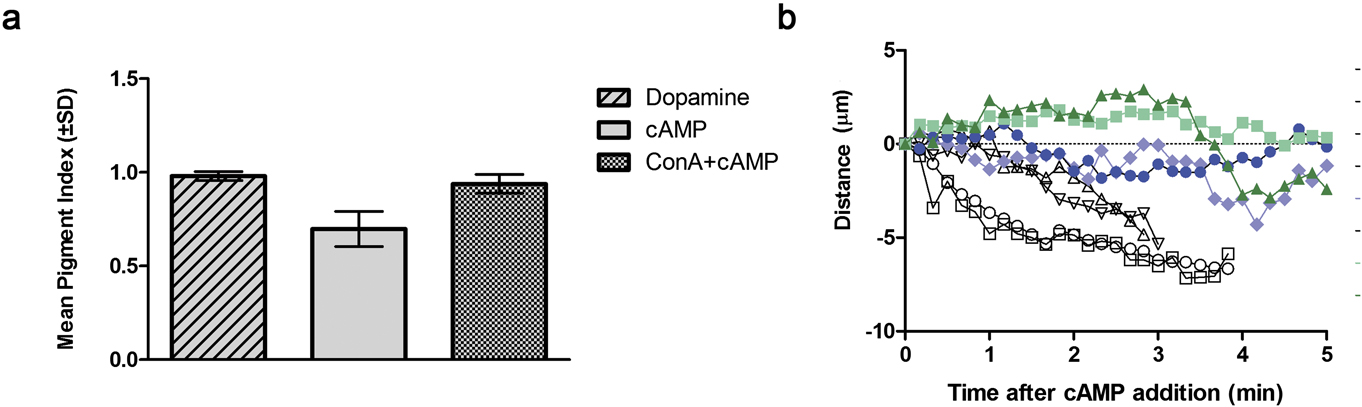
We tested whether ConA had the same effect on melanosome aggregation in isolated sheets of RPE, which retain apical–basal polarity as in the in vivo condition. Isolated sheets of RPE were removed from the eyecup but not dissociated, such that they retained their polarized apical–basal structure and did not attach to the substrate. RPE sheets treated with ConA in the same manner as dissociated cells in vitro demonstrated similar results: melanosome aggregation was inhibited by ConA; 30 min after triggering aggregation with cAMP, PI of ConA-treated cells was significantly higher than that of aggregated controls (ANOVA and Bonferroni post-hoc test, P < 0.05; Fig. 4a). Time-lapse videos of RPE sheets demonstrated aggregation of individual melanomes in control cells, but mostly oscillation of melanosomes in ConA-treated cells after cAMP addition, resulting in little net motility toward the CB. (Fig. 4b, Videos 3 and 4)
Effect of ConA on melanosome aggregation in RPE sheets. Sheets were incubated with or without 100 µg/mL ConA in HERB + dopamine for 60 min, then triggered to aggregate using 1 mM cAMP with or without ConA for 30 min. (a) PI for cells triggered to aggregate. Dopamine: control cells with dispersed melanosomes before addition of cAMP to trigger aggregation; cAMP: control cells treated with cAMP; ConA + cAMP: cells treated with ConA then triggered to aggregate in cAMP. PI for ConA + cAMP cells was significantly higher than cAMP control cells. (b) Motility of melanosomes in RPE sheets measured from time-lapse videos (see Videos 3 and 4). Open symbols: control, closed symbols, ConA-treated. Distance from the starting point for the outermost melanosomes in apical projections was measured from single frames.

Effects of lectins on RPE cell structure and F-actin distribution
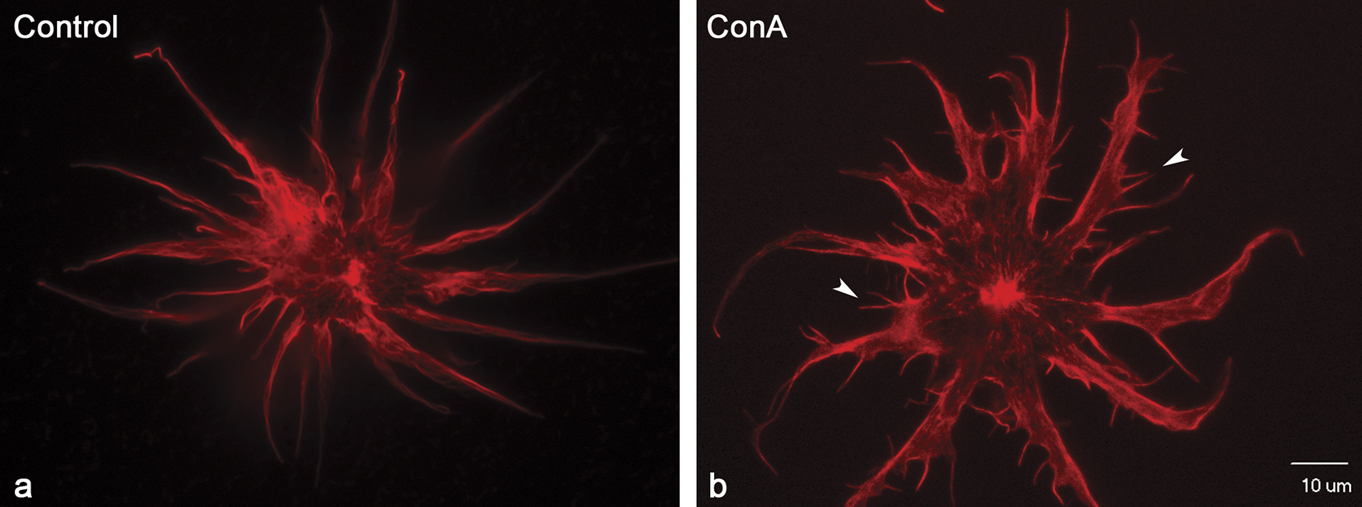
Isolated RPE cells treated with ConA often changed shape compared to control cells, revealed through rhodamine phalloidin staining (Fig. 5). The central CB of lectin-treated cells was generally more spread than in control cells, and the bases of apical projections extending from the center CB were thicker compared to untreated cells. In addition, approximately 45% of ConA-treated cells displayed short actin-rich extensions resembling filopodia on their apical projections (Fig. 5b, arrowheads). Only 15% of succinyl ConA-treated cells and 0.05% of control cells demonstrated these structures. Melanosomes were not observed within the extensions, regardless of whether cells had been incubated in lectin during triggering of melanosome dispersion or aggregation. It is possible that lectin treatment stimulated ectopic actin polymerization, resulting in alteration of actin distribution and formation of filopodia.
Effect of Concanavalin A on actin organization. Rhodamine-phalloidin labeling of actin filaments in RPE cells 30 min after triggering melanosome aggregation using cAMP. (a) Control: cAMP alone, melanosomes aggregated. (b) ConA: cells were pretreated with ConA for 30 min prior to stimulating aggregation. ConA treatment produced filopodia-like structures on apical projections. Scale bar: 10 µm.

Effect of ConA on motility of surface-attached latex beads. Isolated RPE cells treated with or without ConA were perfused with a dilute bead solution. Distance from the starting point for attached beads was measured for each frame. Beads attached to control cells (open symbols, see Video 5) moved significantly faster than beads on ConA-treated cells (closed symbols, see Video 6).11: There was no in-text citation for Figure 6. Please provide a location for the citation.

Effect of lectins on motility of surface-attached beads
Attachment and retrograde motility of surface-attached particles such as latex beads have been observed in a number of different cell types, and in some, but not all cells, are correlated with actin retrograde flow (Abercrombie et al., Reference Abercrombie, Heaysman and Pegrum1970; Forscher & Smith, Reference Forscher, Smith, Herman and Jacobson1990). We have previously demonstrated that latex beads attached to apical projections of dissociated cells move in the retrograde direction, toward the CB, and this motility is blocked by actin disruption, suggesting that beads attach to transmembrane proteins linked to the underlying actin cytoskeleton and are pulled in the retrograde direction via retrograde flow, as observed in other cell types (Basciano & King-Smith, Reference Basciano and King-Smith2002). Isolated RPE cells treated with and without lectins were perfused with latex beads, and beads attached to apical projections were followed to compare the rate of retrograde bead movement in treated and untreated cells (Fig. 6, Videos 5 and 6). Rate of bead motility in control cells was 1.71 ± 0.31 μm/min (mean and S.D., N = 3), significantly faster than the rate of 0.67 ± 0.22 μm/min, (N = 4) in ConA-treated cells (Students t-test; P = 0.003). The significant decrease in the rate of retrograde movement of surface-attached beads after lectin treatment is consistent with the idea that lectin treatment inhibited retrograde actin flow.
Discussion
As a means to better understand the cytoskeletal basis of organelle transport in fish RPE, we examined the polarity orientation of actin filaments in dissociated cultured fish RPE cells. Cytoskeletal composition and structure of the apical projections differ among RPE from various vertebrate species. Apical projections of frog and chick RPE lack microtubules but contain actin filaments arranged in paracrystalline bundles parallel to the long axis of the process (Nguyen-Legros, Reference Nguyen-Legros1978, review; Owaribe et al., Reference Owaribe, Kartenbeck, Rungger-Brandle and Franke1988). The bundled actin within apical projections is suggestive of the cross-linked actin cytoskeleton found in microvilli, thus leading to this term being applied to RPE apical projections. RPE apical projections of mammals also lack microtubules and contain F-actin (Burnside & Laties, Reference Burnside and Laties1976, Reference Burnside, Laties, Zinn and Marmor1979; Futter et al., Reference Futter, Ramalho, Jaissle, Seeliger and Seabra2004), although the arrangement of actin filaments differs significantly from the paracrystalline array of frogs and chicks. RPE apical projections in monkey and human have three different morphologies: leaf-like, villous-like, and thicker projections that contain pigment granules (Burnside & Laties, Reference Burnside and Laties1976). Actin filaments in all three morphotypes line the plasma membrane as individual filaments, rather than bundles, form rows parallel to the long axis of the projection, and appear to be associated with the plasma membrane (Burnside & Laties, Reference Burnside and Laties1976). Mouse RPE apical projections are of the leaf-like variety (Futter et al., Reference Futter, Ramalho, Jaissle, Seeliger and Seabra2004). The apical region of RPE in dogs and cats also are flattened and envelop the cone outer segments like artichoke leaves (Nguyen-Legros, Reference Nguyen-Legros1978, review).
Analysis of S1 labeling shows that F-actin in bundles within apical projections is uniformly oriented with barbed ends toward the distal tips of apical projections. Thus, a barbed-end directed myosin motor could be responsible for transporting melanosomes and other organelles out into apical projections. In RPE from shaker-1 mice, which lack functional myosin VIIa, melanosomes are absent from apical projections, where they normally localize in light-adapted, wild type mouse RPE (Gibbs et al., Reference Gibbs, Azarian, Lillo, Kitamoto, Klomp, Steel, Libby and Williams2004). Live-cell imaging of shaker-1 RPE primary cultures found that velocity of melanosome motility was actually higher in the absence of myosin VIIa, suggesting that myosin VIIa dampens motility, and possibly tethers melanosomes in apical projections in the light-adapted position. A zebrafish mutant called mariner also has a defect in myosin VIIa (Ernest et al., Reference Ernest, Rauch, Haffter, Geisler, Petit and Nicolson2004). A study presented in abstract form (Perkins et al., Reference Perkins, Matsui, Murphy and Dowling2004) reported that RPE melanosomes in the mariner mutant displayed normal light and dark adaptive movements but had increased photoreceptor death in constant light (B. Perkins, Cole Eye Institute, Cleveland Clinic, personal communication). Thus, the role of myosin VIIa in melanosome motility in RPE is still not clear. The barbed-end directed motor, myosin Va, is also present in mouse RPE, and could affect light-adaptive dispersal into apical projections; however, melanosomes in light-adapted RPE from myosin Va-null mice localize normally to the apical projections (Gibbs et al., Reference Gibbs, Azarian, Lillo, Kitamoto, Klomp, Steel, Libby and Williams2004). Interestingly, in isolated fish RPE cells treated with cytochalasin to depolymerize actin filaments, time-lapse videos reveal that most melanosome motility in apical projections stops, but a subset of melanosomes undergo very rapid movements within apical projections, in both directions. These rapid movements cease when microtubules are depolymerized in actin filament-depleted cells, suggesting that melanosomes in apical projections may carry microtubule motors that allow promiscuous motility in the absence of an organized actin cytoskeleton (King-Smith et al., Reference King-Smith, Paz, Lee, Lam and Burnside1997). This is not surprising, since in RPE in vivo, microtubules have been shown to mediate melanosome movement through the RPE CB (Burnside et al., Reference Burnside, Adler and O’Connor1983). While microtubules could possibly move melanosomes throughout apical projections of RPE in vivo, the rate of motility would be expected to be greater than that observed from videos (Fig. 4b, Video 3), since the rate of motility in cytochalasin-treated isolated cells described above, presumably microtubule-dependent, is much faster than motility in untreated cells (King-Smith et al., Reference King-Smith, Paz, Lee, Lam and Burnside1997). Overall, experiments using lectin-treated RPE sheets confirm that inhibition of melanosome aggregation observed in isolated cells also occurs in sheets of epithelium that more closely resemble the condition in vivo.
Regardless of whether myosin VIIa or another barbed-end directed motor effects melanosome dispersion, another mechanism is needed to explain how actin-dependent pigment granule aggregation occurs. Since F-actin is oriented with pointed ends toward the CB, one explanation is that melanosome aggregation is effected by myosin VI, the sole member of the myosin superfamily that is a pointed-end directed motor. Two myosin VI isoforms are present in fish RPE (Breckler et al, Reference Breckler, Au, Cheng, Hasson and Burnside2000; Lin-Jones et al., Reference Lin-Jones, Sohlberg, Dose, Breckler, Hillman and Burnside2009). Thus a barbed-end directed motor could be responsible for dispersion and a pointed end motor responsible for aggregation. However, migrating melanosomes in fish RPE demonstrate different motility characteristics when undergoing aggregation compared to dispersion. During aggregation, movement is nonsaltatory and coordinated; melanosomes start aggregating toward the CB as a mass. In contrast, dispersion is saltatory, with individual granules emerging from the CB independent of other granules (King-Smith et al., Reference King-Smith, Paz, Lee, Lam and Burnside1997). Although it is possible that myosin VI mediates pointed-end directed translocation of melanosomes during aggregation, it is not clear why this motor would produce markedly different motility characteristics (smooth uniform motility) compared to saltatory motility seen in dispersion. In addition, treatment with Concanavalin A blocked aggregation but not dispersion; if a pointed-end myosin motor drives aggregation and a barbed-end motor drives dispersion, it is not clear why the lectin would block one direction of motility but not the other.
The different motility characteristics during aggregation and dispersion, and the assumption that actin was uniformly oriented with barbed ends distal, prompted a hypothesis that dispersion of melanosomes is effected by a barbed-end directed myosin motor, and aggregation occurs by passive association of melanosomes with actin filaments undergoing retrograde actin flow (King-Smith et al., Reference King-Smith, Paz, Lee, Lam and Burnside1997; Barsoum & King-Smith, Reference Barsoum and King-Smith2007). While actin dynamics in living RPE cells have not been observed, the notion that actin filaments in apical projections undergo retrograde flow is supported by the finding that latex beads attached to the dorsal surface of isolated RPE cells are constitutively transported from the distal regions of apical projections toward the CB (Basciano & King-Smith, Reference Basciano and King-Smith2002). Retrograde transport of surface attached particles has been shown to correlate with both retrograde movement of organelles and retrograde actin flow in some cell types (Cramer, Reference Cramer1997), although in other cell types, rates of actin retrograde flow and motility of surface particles are not correlated (Theriot & Mitchison, Reference Theriot and Mitchison1992). Motility of beads persists whether or not melanosomes within the RPE cell have been stimulated to aggregate or disperse (Basciano & King-Smith, Reference Basciano and King-Smith2002).
ConA has been shown to inhibit cortical actin flow in Xenopus oocytes via binding and crosslinking of transmembrane proteins (Canman & Bement, Reference Canman and Bement1997). Similarly, ConA inhibited cortical actin flow necessary for spindle assembly, also demonstrated to be actin and myosin-II dependent (Rosenblatt et al., Reference Rosenblatt, Cramer, Baum and McGee2004). In the current study, ConA treatment significantly decreased bead motility along RPE apical projections. Although it cannot be ruled out that this resulted from simple steric hindrance of bead movement by lectins attached to the cell surface, or by lectin association with transmembrane proteins that affected overall actin filament reorganization, the interpretation that ConA crosslinked membrane proteins and impeded cortical actin undergoing retrograde actin flow is consistent with results of previous studies using ConA and oocytes. While ConA treatment decreased the rate of bead motility, it effectively stopped net aggregation of melanosomes in isolated cells altogether. Differences in the effect of ConA on bead motility compared to melanosome motility could be attributed to the different environments of beads moving on the cell surface compared to melanosomes moving through the cytoplasm; motility inside the cell may have been more greatly affected by changes in actin filament organization induced by lectin treatment than bead motility on the cell surface.
Myosin II has been shown to power retrograde actin flow in a number of cell types (Kovar, Reference Kovar2007, review). While Arp2/3-dependent polymerization of actin filaments powers retrograde movement at the cell edge, myosin II-dependent contraction of actin filaments proximally is believed to effect retrograde actin flow (Verkhovsky et al., Reference Verkhovsky, Svitkina and Borisy1997; Ponti et al., Reference Ponti, Machacek, Gupton, Waterman-Storer and Danuser2004; Medeiros et al., Reference Medeiros, Burnette and Forscher2006). The role of myosin II in melanosome motility in RPE cells was tested in previous studies using the myosin II inhibitor, blebbistatin. Blebbistatin blocked pigment granule aggregation but had no effect on granule dispersion (Barsoum & King-Smith, Reference Barsoum and King-Smith2007). These findings support the idea that retrograde melanosome movement (aggregation) could be linked to retrograde actin flow. The inhibition of aggregation but not dispersion by blebbistatin (Barsoum & King-Smith, Reference Barsoum and King-Smith2007), and tetravalent lectins (this study), together with the confirmation that F-actin is oriented with barbed ends distal reported here support the idea that melanosome aggregation affected by retrograde actin flow, possibly by passive attachment of melanosomes to moving actin cables.
The finding that moving actin filaments act like a “conveyer belt” to mediate organelle motility has precedent in the migration of mitochondria in budding yeast, Saccharomyces cerevisiae. Retrograde motility of mitochondria from the bud tip toward the mother cell is affected by myosin II-driven retrograde motility of actin cables regulated by binding of a specific isoform of tropomyosin (Boldogh et al., Reference Boldogh, Nowakowski, Yang, Chung, Karmon, Royes and Pon2003; Fehrenbacher et al., Reference Fehrenbacher, Yang, Gay, Huckaba and Pon2004; Huckaba et al., Reference Huckaba, Lipkin and Pon2006). A complex of three proteins termed the mitochore allows attachment of mitochondria to the actin cables (Boldogh et al., Reference Boldogh, Vojtov, Karmon and Pon1998, Reference Boldogh, Nowakowski, Yang, Chung, Karmon, Royes and Pon2003; Peraza-Reyes et al., Reference Peraza-Reyes, Crider and Pon2010, review). Similarly, retrograde movement of actin filaments in RPE could similarly bring about aggregation through passive attachment of melanosomes to actin filaments within apical projections.
Supplementary Materials
Supplemental materials can be viewed in this issue of VNS by visiting http://journals.cambridge.org/VNS.
Video 1: Phase contrast, time-lapse video of dissociated RPE cell triggered to aggregate melanosomes. Images were collected every 10 s. Perfusion with 1 mM cAMP in HERB began at ca. 290 s, triggering melanosome aggregation.
Video 2: Time-lapse video of a dissociated RPE cell pretreated with 100 µg/ml ConA in HERB/dopamine, triggered to aggregate using 1 mM cAMP at ca. 200–250 s (cell went out of focus and moved off center briefly). Images were collected every 10 s. Melanosomes continue to oscillate bidirectionally (shuttling) but fail to aggregate.
Video 3: Time-lapse video of RPE sheets in situ, placed in cAMP immediately prior to starting the video. Images were collected every 10 s. Melanosomes are visible as phase-bright areas within apical projections extending into the upper part of the field; they migrate toward the basal side of the cell at the bottom of the field. Empty apical projections devoid of melanosomes appear as phase-gray hair-like structures.
Video 4: Time-lapse video of RPE sheets in situ, after preincubation in 100 µg/ml ConA in HERB/dopamine, then placed in cAMP/ConA immediately prior to starting the video. Basal side is on the left; apical projections extend to the right. Some movement of melanosomes toward the basal side of the cell is visible within projections, but net aggregation is blocked. Images were collected every 10 s.
Video 5: Time-lapse video of a dissociated RPE cell with attached latex bead, starting in the lower right. The cell was preincubated in cAMP to aggregate melanosomes, so beads would be easier to visualize. Images were collected every 10 s; the rate of bead motility: 2.06 µm/min
Video 6: Time-lapse video of a dissociated RPE cell pretreated in 100 µg/ml ConA in cAMP. The bead moves from upper right to lower left at a rate of 0.57 µm/min. (Several beads attached to the substrate remain stationary in the upper right). A few melanosomes from lysed cells that attached to the cell surface are also moving toward the CB. A melanosome that appears to be within a projection (phase gray area that is partly out of focus) at 12:00 also moves in toward the CB. Images were collected every 10 s.
Acknowledgments
Supported by NIH R15 GM066961, NSF Major Research Instrumentation grant #97-24401, and a Howard Hughes Medical Institute Science Education Grant awarded to Saint Joseph’s University. Preliminary reports were presented at the Annual Meeting of the American Society for Cell Biology in 2007, 2011, and 2012. Technical assistance was provided by Carol Collins, Nathan L’Etoile, and Megan O’Donnell. We thank Tanya Svitkina, Farida Korobova, and Matt Hoezle for assistance with platinum replica shadowing, and Dana M. Garcia for reading the manuscript.