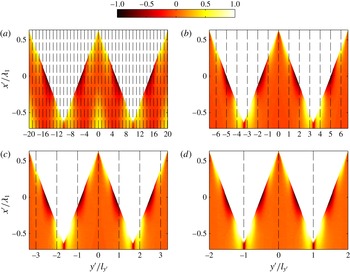
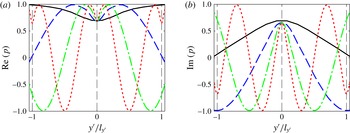
1 Introduction
The past few decades have seen a rapid growth of air traffic, while the public’s attention to aircraft noise and its health consequences has also been continuously increasing. This has led to more stringent regulations for aircraft noise (Casalino et al. Reference Casalino, Diozzi, Sannino and Paonessa2008). With regard to the impact of aircraft on community noise, the take-off and landing processes are of main concern. Among the different mechanisms present during the landing process, airframe noise is believed to be the dominant component. It is widely accepted that the broadband noise induced by the interaction of the boundary layer with the aerofoil trailing edge, known as the turbulent boundary layer trailing-edge noise, plays a significant role in the overall airframe noise. Turbulent boundary layer trailing-edge noise also dominates the noise produced by wind turbines (Oerlemans et al. Reference Oerlemans, Sijtsma and Méndez López2007). Unless explicitly stated, the turbulent boundary layer trailing-edge noise will be referred to as trailing-edge noise in the rest of this paper.
When a turbulent boundary layer convects past the trailing edge, unsteady pressure with a wavenumber in the hydrodynamic range is scattered into sound (Chase Reference Chase1975). Both experiments and theory reveal that the radiated sound power varies with the flow velocity to the power of 5, which is more efficient, at low Mach numbers, compared with the power of 8 valid for free stream flows (Lighthill Reference Lighthill1952; Williams & Hall Reference Williams and Hall1970).
Different models have been put forward for predicting and understanding trailing-edge noise. In 1976, Amiet (Reference Amiet1976b
, Reference Amiet1978) proposed a semi-analytical model in which the aerofoil is modelled as a flat plate. The model followed Schwarzschild’s technique to obtain the scattered pressure on the surface of the flat plate, and the far-field sound was obtained using the surface pressure integral based on the theories of Kirchhoff and Curle. The model established an analytical relationship between the far-field sound spectral density and the wavenumber spectral density of the wall surface pressure under the turbulent boundary layer. Amiet’s model agrees well with experimental observations, especially at high frequencies (Roger & Moreau Reference Roger and Moreau2005). It should be noted that Amiet’s model assumed that the leading edge of the plate is infinitely far away from the trailing edge and thus has no effects on the scattered pressure, which might not be accurate at low frequencies. In 2005, in order to investigate the leading-edge backscattering effects, Roger & Moreau (Reference Roger and Moreau2005) extended Amiet’s model by incorporating the backscattered pressure from the leading edge and found that when the Helmholtz number
 $kc>1$
, the backscattering can be safely ignored and only at very low frequencies does the backscattering alter the far-field sound.
As trailing-edge noise dominates the sound generation at low Mach numbers, different noise reduction techniques have been investigated. Howe proposed a theoretical model to predict the sound generated by a semi-infinite plate with a serrated trailing edge of sinusoidal and sawtooth profiles (Howe Reference Howe1991a
,Reference Howe
b
), see figure 1. Howe’s models show that sawtooth serrations are more effective in reducing the trailing-edge noise than sinusoidal ones, and that the use of sharp sawtooth serrations, i.e.
 $2h/{\it\lambda}>8$
where
 $2h$
and
 ${\it\lambda}$
are the root-to-tip amplitude and wavelength of the serration respectively, can lead to significant reduction of trailing-edge noise. More recently, Azarpeyvand, Gruber & Joseph (Reference Azarpeyvand, Gruber and Joseph2013) carried out an analytical investigation of trailing-edge noise reduction using serrations of novel profiles, namely sawtooth, sinusoidal, slitted, slitted–sawtooth and sawtooth–sinusoidal. It was found that the noise reduction is a sensitive function of the complexity of the serration geometry, and significant noise reduction can be achieved by applying complex periodic serrations to the trailing edge. It was also shown that the slitted–sawtooth serration is the most effective design among the aforementioned serration geometries.
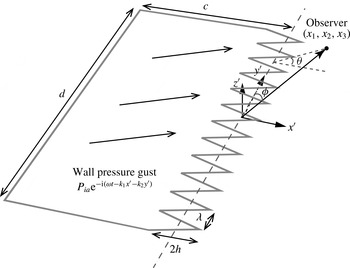
The schematic of a flat plate with trailing-edge serrations. The plate has a chord length of
 $c$
and span of
 $d$
, and the sawtooth serration has a wavelength of
 ${\it\lambda}$
and root-to-tip amplitude of
 $2h$
;
 $x^{\prime }$
,
 $y^{\prime }$
and
 $z^{\prime }$
denote the streamwise, spanwise and normal to the plate coordinates respectively. The far-field observer is at
 $(x_{1},x_{2},x_{3})$
and is also defined by the polar angle
 ${\it\phi}$
and azimuthal angle
 ${\it\theta}$
. A wall pressure gust of the form
 $P_{ia}\text{e}^{-\text{i}({\it\omega}t-k_{1}x^{\prime }-k_{2}y^{\prime })}$
is convecting past the trailing edge of the plate, where
 $k_{1}$
and
 $k_{2}$
are the streamwise and spanwise wavenumbers of the gust respectively.

An experimental investigation on trailing-edge serrations was performed by Dassen et al. (Reference Dassen, Parchen, Bruggeman and Hagg1996). Both aerofoils and flat plates of different shapes were tested in a wind tunnel. Maxima of 10 dB noise reduction for the flat plates and 8 dB reduction for the aerofoils were reported, both of which occurred mainly at low frequencies. Later, Parchen et al. (Reference Parchen, Hoffmans, Gordner and Braun1999) conducted an experimental investigation of the aeroacoustic effects of trailing-edge serrations on wind turbine blades at both full and wind-tunnel scales. An average sound reduction slightly below that reported by Dassen et al. was observed. Most recently, Oerlemans et al. (Reference Oerlemans, Fisher, Maeder and Kögler2009) examined and compared the noise generated by standard, serrated and aeroacoustically optimized aerofoils, but only 2–3 dB noise reduction was achieved for the aerofoil with the serrated trailing edge at low frequencies. Both Parchen et al. (Reference Parchen, Hoffmans, Gordner and Braun1999) and Oerlemans et al. (Reference Oerlemans, Fisher, Maeder and Kögler2009) reported a noise increase at high frequencies.
Gruber (Reference Gruber2012) recently conducted an extensive experimental investigation on the aeroacoustic performance of aerofoils fitted with different sawtooth and novel serrations. The acoustic measurements were performed to give the sound power level (SWL) integrated in the mid-span plane. An average of 3–5 dB reduction was achieved using sharp sawtooth serrations, and a noise increase of up to 5 dB at higher frequencies was also reported. It was explained that the significant reduction of phase speed near the sawtooth edges, together with a slight reduction of the coherence of pressure measured along the edge, is responsible for the sound reduction observed in experiments. All of the experimental studies, however, indicate that Howe’s model significantly overpredicts the sound reduction capability of trailing-edge serrations. This might be caused by the assumptions and approximations used in Howe’s derivation, which will be discussed in detail in the subsequent sections.
Although different serrations have been used in many applications such as wind turbines and jet nozzles (Callender, Gutmark & Martens Reference Callender, Gutmark and Martens2005; Yan, Panek & Thiele Reference Yan, Panek and Thiele2007; Oerlemans et al. Reference Oerlemans, Fisher, Maeder and Kögler2009), the physical mechanism of the noise reduction remains poorly understood. Howe’s model gave a first insight into the physics involved, but the large deviation from experiments suggests that a new and more accurate theory is needed.
The main objectives of this paper are to develop a new theory to predict the sound generated from a serrated trailing edge more accurately and to improve our understanding of the sound reduction mechanism due to the presence of trailing-edge serrations. The paper is structured as follows. The new theoretical model for sound radiation from serrated trailing edges is presented in § 2. Section 3 provides validation results against finite element solutions. A parametric study is also presented, and the effects of serrations on trailing-edge noise directivity are also discussed. A comparison between the new model and Howe’s model is made in § 4. The physical mechanism of sound reduction using trailing-edge serrations is discussed in § 5, and noise reduction criteria developed based on the results in § 2 are listed and discussed. A brief conclusion is given in the last section.
2 Analytical formulation
As in Amiet’s model, the analytical model developed here is based on Schwarzschild’s technique for the Helmholtz equation with a discontinuous boundary condition. It is therefore useful to begin by describing this technique. The Schwarzschild method (Amiet Reference Amiet1976b
; Roger & Moreau Reference Roger and Moreau2005) states that if a function
 $f(x,y)$
satisfies
 $$\begin{eqnarray}\left.\begin{array}{@{}ll@{}}\displaystyle \frac{\partial ^{2}f}{\partial x^{2}}+\frac{\partial ^{2}f}{\partial y^{2}}+{\it\mu}^{2}f=0, & \\ \displaystyle \frac{\partial f}{\partial y}(x,0)=0, & x<0,\\ \displaystyle f(x,0)=g(x), & x\geqslant 0,\end{array}\right\}\end{eqnarray}$$
then, for
 $x<0$
,
 $$\begin{eqnarray}f(x,0)=\frac{1}{{\rm\pi}}\int _{0}^{\infty }\sqrt{\frac{-x}{{\it\xi}}}\frac{\text{e}^{\text{i}{\it\mu}({\it\xi}-x)}}{{\it\xi}-x}g({\it\xi})\,\text{d}{\it\xi},\end{eqnarray}$$
where
 $x$
,
 $y$
and
 ${\it\xi}$
are real numbers,
 ${\it\mu}$
can be a complex parameter and
 $g(x)$
is a known function of
 $x$
.
As shown by Amiet (Reference Amiet1976a ), the above method can be used to obtain the scattered pressure field over the surface of the aerofoil.
2.1 The mathematical model
Consider an aerofoil with trailing-edge serrations, modelled as a flat plate as shown in figure 1, with an infinitesimal thickness and an averaged chord length
 $c$
and spanwise length
 $d$
. Let
 $x^{\prime }$
,
 $y^{\prime }$
and
 $z^{\prime }$
denote the streamwise, spanwise and normal to the plate coordinates respectively. The observer point is located at
 $(x_{1},x_{2},x_{3})$
. The profile function
 $H(y^{\prime })$
is used to describe the serrated edges. The origin of the coordinates is chosen in such a way that
 $H(y^{\prime })$
is an oscillatory function of zero mean and that
 $H(y^{\prime })=0$
in the absence of serrations. Figure 1 shows a sawtooth serration with a root-to-tip amplitude of
 $2h$
and a wavelength of
 ${\it\lambda}$
.
When the sound wavelength is equal to or shorter than the chord length
 $c$
, the flat plate can be treated as a semi-infinite plate without a leading edge (Amiet Reference Amiet1976b
). Furthermore, the plate can be considered to be infinite in the spanwise direction provided that it has a relatively large aspect ratio (typically
 $d/c>3$
) (Amiet Reference Amiet1978; Roger & Carazo Reference Roger and Carazo2010). The turbulence inside the boundary layer is assumed to be frozen, i.e. it remains statistically the same before and after passing over the trailing edge.
After implementing a spatial and time Fourier transformation, the hypothetical surface pressure beneath the turbulent boundary layer that would exist when the flat plate was infinite can be expressed as an integral of different wall pressure gust components. The incoming wall pressure gust of frequency
 ${\it\omega}$
, as illustrated in figure 1, takes the form of
 $$\begin{eqnarray}p_{i}=P_{i}\text{e}^{-\text{i}({\it\omega}t-k_{1}x^{\prime }-k_{2}y^{\prime })},\end{eqnarray}$$
where
 $P_{i}$
is the magnitude of the incident wall pressure gust and
 $k_{1}$
and
 $k_{2}$
denote the wavenumbers in the chordwise and spanwise directions respectively.
The sound sources due to the presence of solid boundaries (Curle Reference Curle1955) can be modelled as dipoles, in addition to the quadrupoles in free field (Lighthill Reference Lighthill1952). As explained in Amiet’s paper (Amiet Reference Amiet1976b
), the incident pressure produces a scattered field originating from the trailing edge, due to the change in boundary condition at the wall. The scattered field induces a pressure jump that cancels the incident pressure jump at the trailing edge and in the wake after the plate (Kutta condition). Thus, the total pressure can be decomposed into two parts, namely
 $p_{t}=p_{i}+p$
. The incident wall pressure is given by (2.3), and the scattered pressure field,
 $p$
, must satisfy the following conditions at
 $z^{\prime }=0$
:
 $$\begin{eqnarray}\left.\begin{array}{@{}ll@{}}\displaystyle \frac{\partial p}{\partial z^{\prime }}=0, & x^{\prime }<H(y^{\prime }),\\ \displaystyle p=-P_{i}\text{e}^{-\text{i}({\it\omega}t-k_{1}x^{\prime }-k_{2}y^{\prime })}, & x^{\prime }\geqslant H(y^{\prime }).\end{array}\right\}\end{eqnarray}$$
It is worth pointing out that the incident pressure
 $p_{i}$
defined in (2.3) is twice the ‘conventional incident pressure’ that would exist when the semi-infinite flat plate was absent. Therefore, the scattered pressure
 $p$
to be obtained on the upper surface of the plate would be twice the ‘conventional scattered pressure’ due to the linearity of the wave equation and (2.4). Since the scattering problem is anti-symmetrical, it follows that the scattered pressure
 $p$
is in fact, as in Amiet’s paper (Amiet Reference Amiet1976b
), the scattered pressure jump across the plate. This can be made evident through a more rigorous analysis.
In the plate-fixed frame
 $\{x^{\prime },y^{\prime },z^{\prime }\}$
, the flow has a uniform speed
 $U$
in the streamwise direction outside the boundary layer, and the wave equation governing the scattered pressure field
 $p$
is
 $$\begin{eqnarray}{\rm\nabla}^{2}p-\frac{1}{c_{0}^{2}}\left(\frac{\partial }{\partial t}+U\frac{\partial }{\partial x^{\prime }}\right)^{2}p=0,\end{eqnarray}$$
where
 $c_{0}$
denotes the speed of sound. With the assumption of harmonic perturbation,
 $p=P(x^{\prime },y^{\prime },z^{\prime })\text{e}^{\text{-i}{\it\omega}t}$
, the above equation reduces to
 $$\begin{eqnarray}{\it\beta}^{2}\frac{\partial ^{2}P}{\partial x^{\prime 2}}+\frac{\partial ^{2}P}{\partial y^{\prime 2}}+\frac{\partial ^{2}P}{\partial z^{\prime 2}}+2\text{i}kM_{0}\frac{\partial P}{\partial x^{\prime }}+k^{2}P=0,\end{eqnarray}$$
where
 $k={\it\omega}/c_{0}$
,
 ${\it\beta}^{2}=1-M_{0}^{2}$
and
 $M_{0}=U/c_{0}$
.
In order to make the boundary conditions in (2.4) independent of
 $y^{\prime }$
, the coordinate transformation (Roger, Schram & Santana Reference Roger, Schram and Santana2013)
 $x=x^{\prime }-H(y^{\prime }),\,y=y^{\prime },\,z=z^{\prime }$
is used and leads to the following differential equation:
 $$\begin{eqnarray}({\it\beta}^{2}+{H^{\prime }}^{2}(y))\frac{\partial ^{2}P}{\partial x^{2}}+\frac{\partial ^{2}P}{\partial y^{2}}+\frac{\partial ^{2}P}{\partial z^{2}}-2H^{\prime }(y)\frac{\partial ^{2}P}{\partial x\partial y}+\left(2\text{i}M_{0}k-H^{\prime \prime }(y)\right)\frac{\partial P}{\partial x}+k^{2}P=0,\end{eqnarray}$$
where
 $H^{\prime }(y)$
and
 $H^{\prime \prime }(y)$
denote the first and second derivatives of
 $H(y)$
. The boundary conditions now read
 $$\begin{eqnarray}\left.\begin{array}{@{}ll@{}}\displaystyle P(x,y,0)=-P_{i}\text{e}^{\text{i}(k_{1}x+k_{2}y)}\text{e}^{\text{i}k_{1}H(y)}, & x\geqslant 0,\\ \displaystyle \partial P(x,y,0)/\partial z=0, & x<0.\end{array}\right\}\end{eqnarray}$$
Since the coefficients in (2.7) are
 $y$
-dependent, the standard ‘separation of variables’ technique cannot be applied to solve this equation. We therefore turn to using a Fourier expansion technique in the following derivation.
2.2 Fourier expansion
As the scattering problem is periodic in the spanwise direction, one can expand the scattered pressure field using Fourier series as
 $$\begin{eqnarray}P(x,y,z)=\mathop{\sum }_{n=-\infty }^{\infty }P_{n}(x,z)\text{e}^{\text{i}k_{2n}y},\end{eqnarray}$$
where
 $k_{2n}=k_{2}+2n{\rm\pi}/{\it\lambda}$
.
Substitution of the above expression into the transformed wave equation, shown in (2.7), yields
 $$\begin{eqnarray}\displaystyle & & \displaystyle \left\{({\it\beta}^{2}+{H^{\prime }}^{2}(y))\frac{\partial ^{2}}{\partial x^{2}}+\frac{\partial ^{2}}{\partial y^{2}}+\frac{\partial ^{2}}{\partial z^{2}}-2H^{\prime }(y)\frac{\partial ^{2}}{\partial x\partial y}+\left(2\text{i}M_{0}k-H^{\prime \prime }(y)\right)\frac{\partial }{\partial x}+k^{2}\right\}\nonumber\\ \displaystyle & & \displaystyle \qquad \times ~\mathop{\sum }_{n=-\infty }^{\infty }P_{n}(x,z)\text{e}^{\text{i}k_{2n}y}=0.\end{eqnarray}$$
By multiplying (2.10) by
 $\text{e}^{\text{-i}k_{2n^{\prime }}y}$
, then integrating it over
 $y$
from
 $-{\it\lambda}/2$
to
 ${\it\lambda}/2$
, it can be readily shown that
 $$\begin{eqnarray}\displaystyle & & \displaystyle \left\{{\it\beta}^{2}\frac{\partial ^{2}}{\partial x^{2}}\right.+\left.\frac{\partial ^{2}}{\partial z^{2}}+2\text{i}kM_{0}\frac{\partial }{\partial x}+(k^{2}-k_{2n^{\prime }}^{2})\right\}P_{n^{\prime }}(x,z)\qquad \nonumber\\ \displaystyle & & \displaystyle \quad +\,\frac{1}{{\it\lambda}}\int _{-{\it\lambda}/2}^{{\it\lambda}/2}\mathop{\sum }_{n=-\infty }^{\infty }\left\{H^{\prime 2}(y)\frac{\partial ^{2}}{\partial x^{2}}-(H^{\prime \prime }(y)+2\text{i}k_{2n}H^{\prime }(y))\frac{\partial }{\partial x}\right\}P_{n}(x,z)\text{e}^{\text{i}[2(n-n^{\prime }){\rm\pi}/{\it\lambda}]y}\,\text{d}y=0.\nonumber\\ \displaystyle & & \displaystyle\end{eqnarray}$$
It should be noted that when both
 $H^{\prime }(y)$
and
 $H^{\prime \prime }(y)$
are constant within an entire sawtooth wavelength, the summation over different modes in (2.11) can be dropped and we obtain a fully decoupled differential equation for mode
 $n^{\prime }$
. However, this means that the flat plate has a straight or swept trailing edge. For serrations of an arbitrary profile, both
 $H^{\prime }(y)$
and
 $H^{\prime \prime }(y)$
generally depend on
 $y$
. Thus, (2.11) becomes a coupled differential equation, i.e. more than one mode appears in each differential equation. The physical interpretation of this mode coupling will be discussed later.
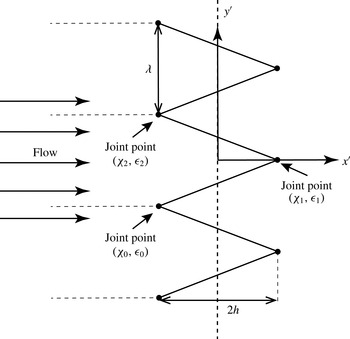
The schematic of sawtooth serrations.

In this paper, we only focus on the sawtooth serration, which has been shown to be effective in reducing the trailing-edge noise (Howe Reference Howe1991b
). The method can, however, also be used for other serrations. Consider a sawtooth centred around the coordinate origin, and let
 $({\it\chi}_{0},{\it\epsilon}_{0})$
,
 $({\it\chi}_{1},{\it\epsilon}_{1})$
and
 $({\it\chi}_{2},{\it\epsilon}_{2})$
be the Cartesian coordinates of the tip and roots of the sawtooth, as shown in figure 2. The serration profile function
 $H(y)$
can therefore be defined as
 $$\begin{eqnarray}H(y)=\left\{\begin{array}{@{}ll@{}}\displaystyle {\it\sigma}_{0}(y-{\it\chi}_{0}-m{\it\lambda})+{\it\epsilon}_{0},\quad & {\it\chi}_{0}+m{\it\lambda}<y\leqslant {\it\chi}_{1}+m{\it\lambda},\\ \displaystyle {\it\sigma}_{1}(y-{\it\chi}_{1}-m{\it\lambda})+{\it\epsilon}_{1},\quad & {\it\chi}_{1}+m{\it\lambda}<y\leqslant {\it\chi}_{2}+m{\it\lambda},\end{array}\right.\end{eqnarray}$$
where
 ${\it\sigma}_{j}=({\it\epsilon}_{j+1}-{\it\epsilon}_{j})/({\it\chi}_{j+1}-{\it\chi}_{j})$
,
 $j=0,1$
and
 $m=0,\pm 1,\pm 2,\pm 3,\ldots \,$
. Let
 ${\it\sigma}$
, defined as
 ${\it\sigma}=|{\it\sigma}_{j}|=4h/{\it\lambda}$
, denote the sharpness of the sawtooth serrations. For a sawtooth profile, as mentioned above,
 $H^{\prime }(y)$
is not continuous and
 $H^{\prime \prime }(y)$
is thus singular at the joint points. We use the conventional generalized function
 ${\it\delta}(x)$
to describe the singularities at these points, i.e.
 $$\begin{eqnarray}\displaystyle & \displaystyle H^{\prime }(y)=\left\{\begin{array}{@{}ll@{}}\displaystyle {\it\sigma}_{0},\quad & {\it\chi}_{0}+m{\it\lambda}<y\leqslant {\it\chi}_{1}+m{\it\lambda},\\ \displaystyle {\it\sigma}_{1},\quad & {\it\chi}_{1}+m{\it\lambda}<y\leqslant {\it\chi}_{2}+m{\it\lambda},\end{array}\right. & \displaystyle\end{eqnarray}$$
 $$\begin{eqnarray}\displaystyle & \displaystyle H^{\prime \prime }(y)=\mathop{\sum }_{m=-\infty }^{\infty }(-1)^{m+1}2{\it\sigma}{\it\delta}(y-m{\it\lambda}/2). & \displaystyle\end{eqnarray}$$
By substituting the serration profile function and its derivatives, (2.12) and (2.13), into the wave equation, (2.11), and making use of the fact that
 $\int _{-\infty }^{\infty }f(x){\it\delta}(x-{\it\tau})\,\text{d}x=f({\it\tau})$
, we obtain
 $$\begin{eqnarray}\displaystyle & & \displaystyle \left\{\left({\it\beta}^{2}+{\it\sigma}^{2}\right)\frac{\partial ^{2}}{\partial x^{2}}+\frac{\partial ^{2}}{\partial z^{2}}+2\text{i}kM_{0}\frac{\partial }{\partial x}+(k^{2}-k_{2n^{\prime }}^{2})\right\}P_{n^{\prime }}(x,z)\nonumber\\ \displaystyle & & \displaystyle \qquad =-\frac{4{\it\sigma}}{{\it\lambda}}\mathop{\sum }_{n-n^{\prime }=odd}\left(1-\frac{k_{2}{\it\lambda}+2n{\rm\pi}}{(n-n^{\prime }){\rm\pi}}\right)\frac{\partial P_{n}(x,z)}{\partial x}.\end{eqnarray}$$
To make the above equation more compact, we write the set of differential equations obtained above in a matrix form. Let a linear operator
 $$\begin{eqnarray}\text{D}=\left\{\left({\it\beta}^{2}+{\it\sigma}^{2}\right)\frac{\partial ^{2}}{\partial x^{2}}+\frac{\partial ^{2}}{\partial z^{2}}+2\text{i}kM_{0}\frac{\partial }{\partial x}\right\}\end{eqnarray}$$
and a vector of functions
 $$\begin{eqnarray}\boldsymbol{P}=\left(\cdots P_{-n^{\prime }}(x,z),P_{-n^{\prime }+1}(x,z),\ldots ,P_{n^{\prime }-1}(x,z),P_{n^{\prime }}(x,z),\ldots \right)^{\text{T}},\end{eqnarray}$$
then the coupled equations can be written as
 $$\begin{eqnarray}\text{D}\boldsymbol{P}-\unicode[STIX]{x1D63C}\boldsymbol{P}=\unicode[STIX]{x1D63D}\frac{\partial \boldsymbol{P}}{\partial x},\end{eqnarray}$$
where the symbol
 $\text{T}$
in (2.16) represents the transpose of a matrix. The matrices
 $\unicode[STIX]{x1D63C}$
and
 $\unicode[STIX]{x1D63D}$
denote the coefficient matrices of
 $\boldsymbol{P}$
and
 $\partial \boldsymbol{P}/\partial x$
respectively. Here,
 $\unicode[STIX]{x1D608}_{ml}$
and
 $\unicode[STIX]{x1D609}_{ml}$
representing the entries corresponding to mode
 $m$
in row and
 $l$
in column of matrices
 $\unicode[STIX]{x1D63C}$
and
 $\unicode[STIX]{x1D63D}$
are
 $$\begin{eqnarray}\unicode[STIX]{x1D608}_{ml}=(k_{2m}^{2}-k^{2}){\it\delta}_{ml},\quad \unicode[STIX]{x1D609}_{ml}=\left\{\begin{array}{@{}ll@{}}\displaystyle \frac{4{\it\sigma}}{{\it\lambda}}\frac{m+l+k_{2}{\it\lambda}/{\rm\pi}}{l-m},\quad & m-l\text{ is odd},\\ 0,\quad & m-l\text{ is even},\end{array}\right.\end{eqnarray}$$
where
 ${\it\delta}_{ml}$
represents the Kronecker delta. It should be noted that the indices of matrices
 $\unicode[STIX]{x1D63C}$
and
 $\unicode[STIX]{x1D63D}$
are from
 $-m$
to
 $m$
and
 $-l$
to
 $l$
rather than from
 $1$
to
 $2m+1$
and
 $1$
to
 $2l+1$
given the fact that the mode numbers are symmetric with respect to
 $0$
.
By substituting the profile geometry, (2.12), into the boundary conditions, (2.8), and performing the same Fourier expansions, one obtains
 $$\begin{eqnarray}\left.\begin{array}{@{}ll@{}}\displaystyle P_{n}(x,0)=-P_{i}a_{n}\text{e}^{\text{i}k_{1}x}, & x>0,\\ \displaystyle \frac{\partial P_{n}}{\partial z}(x,0)=0, & x\leqslant 0,\end{array}\right\}\end{eqnarray}$$
where the
 $a_{n}$
are defined as
 $$\begin{eqnarray}a_{n}=\frac{1}{{\it\lambda}}\int _{-{\it\lambda}/2}^{{\it\lambda}/2}\text{e}^{\text{i}k_{1}H(y)}\text{e}^{\text{-i}2n{\rm\pi}y/{\it\lambda}}\,\text{d}y.\end{eqnarray}$$
In (2.17), as
 $\unicode[STIX]{x1D63D}$
is not a diagonal matrix, the term
 $\unicode[STIX]{x1D63D}(\partial \boldsymbol{P}/\partial x)$
contains coupling terms, in the sense that different modes,
 $P_{n}$
for example, appear in the governing equation of
 $P_{m}$
. This means that every mode is interacting with the other modes and cannot be solved independently. From the expression of
 $\unicode[STIX]{x1D63D}$
in (2.18), it can be seen that the strength of the coupling is proportional to
 ${\it\sigma}/{\it\lambda}$
. This indicates that sharper serrations have stronger coupling between different modes. It should also be noted that
 $\unicode[STIX]{x1D63C}$
is a diagonal matrix, so if
 $\unicode[STIX]{x1D63D}\approx 0$
, i.e. the serrations are very wide, then there is no coupling effect and one can solve each mode independently.
At very low frequencies, the contribution of higher modes is expected to become gradually negligible compared with mode
 $0$
. Thus, it can be reasonably assumed that in the case of the governing equation of
 $P_{0}$
(mode 0), the coupling with higher modes is weak and one can solve
 $P_{0}$
individually. The coupling effect becomes more pronounced at high frequencies and for sharp serrations. To solve these coupled equations at relatively high frequencies, one can use an iterative procedure, to be introduced in the next section.
2.3 The iterative solution procedure
2.3.1 Scattered surface pressure
To obtain the scattered surface pressure, (2.17), together with the boundary conditions in (2.19), needs to be solved. By analogy with the solution of a system of linear algebraic equations (Süli & Mayers Reference Süli and Mayers2003), which can be obtained iteratively, we shall solve our system of partial differential equations in an iterative manner.
By substituting a known initial value
 $\boldsymbol{P}^{(0)}$
into the coupling term in (2.17), one can write
 $$\begin{eqnarray}\text{D}\boldsymbol{P}-\unicode[STIX]{x1D63C}\boldsymbol{P}=\unicode[STIX]{x1D63D}\frac{\partial \boldsymbol{P}^{(0)}}{\partial x}.\end{eqnarray}$$
Solving (2.21) yields a new set of solutions
 $\boldsymbol{P}^{(1)}$
. By replacing
 $\boldsymbol{P}^{(0)}$
in (2.21) with
 $\boldsymbol{P}^{(1)}$
, we obtain a new wave equation,
 $$\begin{eqnarray}\text{D}\boldsymbol{P}-\unicode[STIX]{x1D63C}\boldsymbol{P}=\unicode[STIX]{x1D63D}\frac{\partial \boldsymbol{P}^{(1)}}{\partial x}.\end{eqnarray}$$
Solving (2.22) gives a new set of solutions
 $\boldsymbol{P}^{(2)}$
. This process is repeated to obtain a solution sequence,
 $\boldsymbol{P}^{(0)}$
,
 $\boldsymbol{P}^{(1)}$
,
 $\boldsymbol{P}^{(2)}$
,
 $\boldsymbol{P}^{(3)}\ldots \,$
. If the sequence is convergent, then its limit satisfies (2.17).
The initial value
 $\boldsymbol{P}^{(0)}$
used to start the first iteration can be obtained, as mentioned in the previous section, by ignoring all of the coupling terms, i.e. with
 $\unicode[STIX]{x1D63D}=0$
, and by solving each equation individually via the standard Schwarzschild technique, as shown in (2.2). The solution to each equation in the decoupled system of equations
 $$\begin{eqnarray}\text{D}\boldsymbol{P}-\unicode[STIX]{x1D63C}\boldsymbol{P}=0\end{eqnarray}$$
can be found as follows.
After use is made of the transformation
 $P_{n^{\prime }}=\bar{P}_{n^{\prime }}\text{e}^{-\text{i}kM_{0}x/({\it\beta}^{2}+{\it\sigma}^{2})}$
, the individual equations in (2.23) reduce to
 $$\begin{eqnarray}\left\{({\it\beta}^{2}+{\it\sigma}^{2})\frac{\partial ^{2}}{\partial x^{2}}+\frac{\partial ^{2}}{\partial z^{2}}+K_{n^{\prime }}^{2}({\it\beta}^{2}+{\it\sigma}^{2})\right\}\bar{P}_{n^{\prime }}=0,\end{eqnarray}$$
where
 $$\begin{eqnarray}K_{n^{\prime }}=\sqrt{k^{2}(1+{\it\sigma}^{2})-k_{2n^{\prime }}^{2}({\it\beta}^{2}+{\it\sigma}^{2})}/({\it\beta}^{2}+{\it\sigma}^{2}).\end{eqnarray}$$
Making use of
 $X=x,Z=\sqrt{{\it\beta}^{2}+{\it\sigma}^{2}}z$
, one can show that (2.24) reduces to a standard Schwarzschild problem, and the solution can be found using the Schwarzschild integral described in (2.2), as
 $$\begin{eqnarray}P_{n^{\prime }}^{(0)}=P_{i}\text{e}^{\text{i}k_{1}x}a_{n^{\prime }}((1-\text{i})\text{E}(-{\it\mu}_{n^{\prime }}x)-1),\end{eqnarray}$$
where
 $P_{n^{\prime }}^{(0)}$
is the element of the vector
 $\boldsymbol{P}^{(0)}$
corresponding to the
 $n^{\prime }$
th mode, and
 $$\begin{eqnarray}\displaystyle & \displaystyle {\it\mu}_{n^{\prime }}=K_{n^{\prime }}+k_{1}+\frac{kM_{0}}{{\it\beta}^{2}+{\it\sigma}^{2}}, & \displaystyle\end{eqnarray}$$
 $$\begin{eqnarray}\displaystyle & \displaystyle \text{E}(x)=\int _{0}^{x}\frac{\text{e}^{\text{i}t}}{\sqrt{2{\rm\pi}t}}\,\text{d}t. & \displaystyle\end{eqnarray}$$
 $n$
th mode excitation (
 $x>0$
) produces only an
 $n$
th mode response (
 $x<0$
). The iteration procedure will add a coupled part to the solution of each mode. The coupled part implies that an
 $n$
th mode input (
 $x>0$
) will also produce some
 $m$
th mode responses (
 $x<0$
), where
 $m\neq n$
. It can be expected that the coupling contributions from closer modes will be stronger than those from remote modes. For sawtooth serrations, as will be shown in (2.30), the coupling strength decays quadratically with respect to the difference between their ‘mode numbers’, i.e.
 $|m-l|$
.
By substituting
 $\boldsymbol{P}^{(0)}$
into the coupling terms on the right-hand side of (2.17), one obtains some inhomogeneous equations that can no longer be solved using the standard Schwarzschild technique. However, if one can transform these equations into homogeneous ones, then Schwarzschild’s method can again be applied. It should be noted that
 $\boldsymbol{P}^{(0)}$
satisfies (2.23); hence, for
 $x\neq 0$
, where
 $\boldsymbol{P}^{(0)}$
is first-order continuously differentiable, the following equation holds:
 $$\begin{eqnarray}\text{D}\frac{\partial \boldsymbol{P}^{(0)}}{\partial x}-\unicode[STIX]{x1D63C}\frac{\partial \boldsymbol{P}^{(0)}}{\partial x}=0.\end{eqnarray}$$
Making use of (2.28), (2.21) can be equivalently written as
 $$\begin{eqnarray}\text{D}\left(\boldsymbol{P}+\unicode[STIX]{x1D66B}\frac{\partial \boldsymbol{P}^{(0)}}{\partial x}\right)-\unicode[STIX]{x1D63C}\left(\boldsymbol{P}+\unicode[STIX]{x1D66B}\frac{\partial \boldsymbol{P}^{(0)}}{\partial x}\right)=0,\end{eqnarray}$$
where
 $\unicode[STIX]{x1D66B}$
is a coefficient matrix whose entries are
 $$\begin{eqnarray}\unicode[STIX]{x1D637}_{ml}=\frac{\unicode[STIX]{x1D609}_{ml}}{k_{2m}^{2}-k_{2l}^{2}}=\left\{\begin{array}{@{}ll@{}}\displaystyle \frac{-4h}{{\rm\pi}^{2}(m-l)^{2}},\quad & m-l=\text{odd},\\ 0,\quad & m-l=\text{even}.\end{array}\right.\end{eqnarray}$$
It is worth pointing out that (2.29) only holds when
 $x\in \boldsymbol{R}$
and
 $x\neq 0$
, and in order to apply the Schwarzschild technique, it must be valid over the whole domain. However, since the singularity of
 $\partial \boldsymbol{P}^{(0)}/\partial x$
only exists at
 $x=0$
, similar to the differentiation of
 $H(y)$
, we may again make use of the generalized function to account for this singularity. Let
 $\partial \hat{\boldsymbol{P}}^{(0)}/\partial x$
denote the generalized differentiation, which allows the presence of generalized functions at the singular point
 $x=0$
but equals
 $\partial \boldsymbol{P}^{(0)}/\partial x$
elsewhere, then the equation
 $$\begin{eqnarray}\text{D}\frac{\partial \hat{\boldsymbol{P}}^{(0)}}{\partial x}-\unicode[STIX]{x1D63C}\frac{\partial \hat{\boldsymbol{P}}^{(0)}}{\partial x}=0\end{eqnarray}$$
needs to hold over
 $x\in \boldsymbol{R}$
. The Schwarzschild technique suggests that if (2.31) does hold, then the routine application of the steps described from (2.24) to (2.26) will recover the value of
 $\partial \boldsymbol{P}^{(0)}/\partial x$
for
 $x<0$
. Thus, one can verify that the intended
 $\partial \hat{\boldsymbol{P}}^{(0)}/\partial x$
can indeed be found as
 $$\begin{eqnarray}\frac{\partial \hat{P}_{n^{\prime }}^{(0)}}{\partial x}(x,0)=\frac{\partial P_{n^{\prime }}^{(0)}}{\partial x}(x,0)+P_{i}a_{n^{\prime }}(1-\text{i})(-\sqrt{{\it\mu}_{n^{\prime }}})\sqrt{2{\rm\pi}x}{\it\delta}(x),\end{eqnarray}$$
where
 $\partial \hat{P}_{n^{\prime }}^{(0)}/\partial x$
denotes the element of
 $\partial \hat{\boldsymbol{P}}^{(0)}/\partial x$
corresponding to the
 $n^{\prime }$
th mode and
 $$\begin{eqnarray}\int _{0}^{\infty }{\it\delta}(x)\,\text{d}x=\frac{1}{2}.\end{eqnarray}$$
Now, the first iterated solution can be obtained by solving the equation
 $$\begin{eqnarray}\text{D}\left(\boldsymbol{P}+\unicode[STIX]{x1D66B}\frac{\partial \hat{\boldsymbol{P}}^{(0)}}{\partial x}\right)-\unicode[STIX]{x1D63C}\left(\boldsymbol{P}+\unicode[STIX]{x1D66B}\frac{\partial \hat{\boldsymbol{P}}^{(0)}}{\partial x}\right)=0\end{eqnarray}$$
via the steps described from (2.24) to (2.26).
Solving (2.34) gives the values of
 $\boldsymbol{P}^{(1)}$
. Continuing this iteration process gives
 $\boldsymbol{P}^{(2)}$
,
 $\boldsymbol{P}^{(3)}\ldots \,$
. The exact solutions
 $\boldsymbol{P}$
can also be expressed as
 $$\begin{eqnarray}\boldsymbol{P}(x,0)=\boldsymbol{N}(x)+\boldsymbol{C}^{(1)}(x)+\boldsymbol{C}^{(2)}(x)+\boldsymbol{C}^{(3)}(x)+\cdots \,,\end{eqnarray}$$
where
 $\boldsymbol{N}$
is the non-coupled part, and the coupled parts are denoted by
 $\boldsymbol{C}^{(i)}=\boldsymbol{P}^{(i)}-\boldsymbol{P}^{(i-1)}$
(
 $i=1,2,3,\ldots \,$
). The entries of
 $\boldsymbol{N}$
and
 $\boldsymbol{C}^{(1)}$
corresponding to mode
 $n^{\prime }$
are given by
 $$\begin{eqnarray}\displaystyle & \displaystyle N_{n^{\prime }}(x)=P_{i}\text{e}^{\text{i}k_{1}x}a_{n^{\prime }}\left((1-\text{i})\text{E}(-{\it\mu}_{n^{\prime }}x)-1\right), & \displaystyle\end{eqnarray}$$
 $$\begin{eqnarray}\displaystyle & \displaystyle C_{n^{\prime }}^{(1)}(x)=P_{i}\text{e}^{\text{i}k_{1}x}(1-\text{i})\mathop{\sum }_{m=-\infty }^{\infty }v_{n^{\prime }m}a_{m}\left(\vphantom{\sqrt{\frac{{\it\mu}_{m}}{-2{\rm\pi}x}}}\text{i}k_{1}(\text{E}(-{\it\mu}_{n^{\prime }}x)-\text{E}(-{\it\mu}_{m}x))\right. & \displaystyle \nonumber\\ \displaystyle & \displaystyle \left.-\,\sqrt{\frac{{\it\mu}_{m}}{-2{\rm\pi}x}}(\text{e}^{\text{-i}{\it\mu}_{n^{\prime }}x}-\text{e}^{\text{-i}{\it\mu}_{m}x})\right).\hspace{40.00006pt} & \displaystyle\end{eqnarray}$$
The elements of the second-order function
 $\boldsymbol{C}^{(2)}$
are provided in appendix A. Since
 $v_{ml}\propto h$
it can be readily shown that
 $C_{n^{\prime }}^{(i)}\propto h^{i}$
for
 $i=1,2,3,\ldots$
. This means that the solution presented in (2.35) is a perturbation (Taylor expansion) series with respect to half of the root-to-tip amplitude
 $h$
. Therefore, a smaller value of
 $h$
compared with the sound wavelength yields faster convergence. It should be noted that the function
 $\boldsymbol{C}^{(i)}$
becomes more and more complex as
 $i$
increases. However, if
 $\boldsymbol{C}^{(i)}$
vanishes sufficiently quickly, higher orders can be neglected without causing significant errors. This appears to be the case for the frequencies relevant to trailing-edge noise, see § 3.2. By substituting (2.36), (2.37) and (A 2) into (2.35), a second-order approximation of the exact solutions is obtained.
The scattered surface pressure is obtained by summing
 $P_{n^{\prime }}(x,0)$
over all different modes and transforming back to the physical coordinate system, namely
 $$\begin{eqnarray}P(x^{\prime },y^{\prime },0)=\mathop{\sum }_{n^{\prime }=-\infty }^{\infty }P_{n^{\prime }}(x^{\prime }-H(y^{\prime }),0)\text{e}^{\text{i}k_{2n^{\prime }}y^{\prime }}.\end{eqnarray}$$
Here,
 $P_{n^{\prime }}$
is the solution obtained from the iteration procedure mentioned above,
 $$\begin{eqnarray}P(x^{\prime },y^{\prime },0)=\mathop{\sum }_{n^{\prime }=-\infty }^{\infty }(N_{n^{\prime }}+C_{n^{\prime }}^{(1)}+C_{n^{\prime }}^{(2)}+\cdots \,)(x^{\prime }-H(y^{\prime }))\text{e}^{\text{i}k_{2n^{\prime }}y^{\prime }},\end{eqnarray}$$
where
 $N_{n^{\prime }}$
and
 $C_{n^{\prime }}^{(1)}$
are defined in (2.36) and (2.37), and
 $C_{n^{\prime }}^{(2)}$
can be found in appendix A. It should be noted that the terms in the second set of parentheses are the arguments for the
 $N_{n^{\prime }}$
and
 $C_{n^{\prime }}^{(i)}\,(i=1,2,3,\ldots )$
functions. It is worth pointing out that in the limiting case when
 $H(y^{\prime })=0$
,
 $\boldsymbol{C}^{(i)}$
vanishes, and (2.39) reduces to the result obtained by Amiet (Reference Amiet1976b
) for a straight edge.
As shown in (2.39), the scattered pressure field can now be expressed in terms of an infinite series. By inspection of (2.39), one can show that at sufficiently low frequencies, i.e.
 $k_{1}h<{\rm\pi}^{2}/4$
, the infinite series is absolutely convergent. At higher frequencies, the series still appears to be convergent, but to obtain a satisfactory approximation a higher truncation number and higher-order iterations may be required. The convergence of the series will be discussed in the following sections by comparing the far-field sound predicted using different-order approximations.
2.3.2 Far-field sound pressure
As illustrated in figure 1, the observer point is located at
 $(x_{1},x_{2},x_{3})$
and the flat plate has an averaged chord length
 $c$
and span length
 $d$
. The far-field sound can be found using the surface pressure integral, as mentioned in Amiet’s model (Lamb Reference Lamb1932; Curle Reference Curle1955; Amiet Reference Amiet1975),
 $$\begin{eqnarray}p_{f}(\boldsymbol{x},{\it\omega})=\frac{-\text{i}{\it\omega}x_{3}}{4{\rm\pi}c_{0}S_{0}^{2}}\iint _{s}{\rm\Delta}P(x^{\prime },y^{\prime })\text{e}^{\text{-i}kR}\,\text{d}x^{\prime }\,\text{d}y^{\prime },\end{eqnarray}$$
where
 ${\rm\Delta}P=P$
denotes the pressure jump,
 $S_{0}^{2}=x_{1}^{2}+{\it\beta}^{2}(x_{2}^{2}+x_{3}^{2})$
and
 $$\begin{eqnarray}R=\frac{M_{0}(x_{1}-x^{\prime })-S_{0}}{{\it\beta}^{2}}+\frac{x_{1}x^{\prime }+x_{2}y^{\prime }{\it\beta}^{2}}{{\it\beta}^{2}S_{0}}.\end{eqnarray}$$
By substituting the solution obtained in (2.39) into (2.40), the far-field sound pressure can be expressed as
 $$\begin{eqnarray}p_{f}(\boldsymbol{x},{\it\omega},k_{2})=P_{i}\left(\frac{-\text{i}{\it\omega}x_{3}c}{4{\rm\pi}c_{0}S_{0}^{2}}\right){\it\lambda}\frac{\sin ((N+1/2){\it\lambda}(k_{2}-kx_{2}/S_{0}))}{\sin ((k_{2}-kx_{2}/S_{0}){\it\lambda}/2)}{\mathcal{L}}({\it\omega},k_{1},k_{2}).\end{eqnarray}$$
Here,
 $2N+1$
represents the number of sawteeth on the edge, and the far-field sound gust-response function
 ${\mathcal{L}}$
is defined as
 $$\begin{eqnarray}\displaystyle {\mathcal{L}}({\it\omega},k_{1},k_{2}) & = & \displaystyle (1-\text{i})\frac{1}{{\it\lambda}c}\text{e}^{\text{-i}k(M_{0}x_{1}-S_{0})/{\it\beta}^{2}}\text{e}^{\text{i}k(M_{0}-x_{1}/S_{0})h/{\it\beta}^{2}}\nonumber\\ \displaystyle & & \displaystyle \times \,\mathop{\sum }_{n^{\prime }=-\infty }^{\infty }({\it\Theta}_{n^{\prime }}+{\it\Theta}_{n^{\prime }}^{(1)}+{\it\Theta}_{n^{\prime }}^{(2)}+\cdots \,),\end{eqnarray}$$
with (only the first two terms are given, see more results in appendix A)
 $$\begin{eqnarray}\left.\begin{array}{@{}c@{}}\displaystyle {\it\Theta}_{n^{\prime }}=a_{n^{\prime }}Q_{n^{\prime }n^{\prime }},\\ \displaystyle {\it\Theta}_{n^{\prime }}^{(1)}=\mathop{\sum }_{m=-\infty }^{\infty }v_{n^{\prime }m}\text{i}k_{1}a_{m}(Q_{n^{\prime }n^{\prime }}-Q_{n^{\prime }m})-v_{n^{\prime }m}\sqrt{{\it\mu}_{m}}a_{m}(S_{n^{\prime }n^{\prime }}-S_{n^{\prime }m}).\end{array}\right\}\end{eqnarray}$$
The functions
 $Q_{nm}$
and
 $S_{nm}$
in the above equations are given by
 $$\begin{eqnarray}\displaystyle & \displaystyle Q_{nm}=\mathop{\sum }_{j=0}^{1}\frac{1}{{\it\kappa}_{nj}}\left(\frac{1}{{\it\mu}_{A}}[\text{e}^{\text{i}{\it\kappa}_{nj}{\it\chi}_{j+1}}{\it\Gamma}(c+{\it\epsilon}_{j+1};{\it\mu}_{m},{\it\mu}_{A})-\text{e}^{\text{i}{\it\kappa}_{nj}{\it\chi}_{j}}{\it\Gamma}(c+{\it\epsilon}_{j};{\it\mu}_{m},{\it\mu}_{A})]\right.\qquad & \displaystyle \nonumber\\ \displaystyle & \displaystyle \qquad \qquad \left.-\,\frac{1}{{\it\mu}_{Bnj}}\text{e}^{\text{i}{\it\kappa}_{nj}({\it\chi}_{j}-(c+{\it\epsilon}_{j})/{\it\sigma}_{j})}[{\it\Gamma}(c+{\it\epsilon}_{j+1};{\it\mu}_{m},{\it\mu}_{Bnj})\!-\!{\it\Gamma}(c+{\it\epsilon}_{j};{\it\mu}_{m},{\it\mu}_{Bnj})]\right),\qquad & \displaystyle\end{eqnarray}$$
 $$\begin{eqnarray}\displaystyle & \displaystyle S_{nm}=\mathop{\sum }_{j=0}^{1}\frac{1}{\text{i}{\it\kappa}_{nj}}\left(\vphantom{\frac{1}{\sqrt{{\it\eta}_{Bmj}}}}\frac{1}{\sqrt{{\it\eta}_{Am}}}[\text{e}^{\text{i}{\it\kappa}_{nj}{\it\chi}_{j+1}}\text{E}({\it\eta}_{Am}(c+{\it\epsilon}_{j+1}))-\text{e}^{\text{i}{\it\kappa}_{nj}{\it\chi}_{j}}\text{E}({\it\eta}_{Am}(c+{\it\epsilon}_{j}))]\right. & \displaystyle \nonumber\\ \displaystyle & \displaystyle \qquad -\,\left.\frac{1}{\sqrt{{\it\eta}_{Bmj}}}\text{e}^{\text{i}{\it\kappa}_{nj}({\it\chi}_{j}-(c+{\it\epsilon}_{j})/{\it\sigma}_{j})}[\text{E}({\it\eta}_{Bmj}(c+{\it\epsilon}_{j+1}))-\text{E}({\it\eta}_{Bmj}(c+{\it\epsilon}_{j}))]\right), & \displaystyle\end{eqnarray}$$
 ${\it\Gamma}$
is defined by
 $$\begin{eqnarray}{\it\Gamma}(x;{\it\mu},{\it\nu})=\text{e}^{\text{-i}{\it\nu}x}\text{E}({\it\mu}x)-\sqrt{\frac{{\it\mu}}{{\it\mu}-{\it\nu}}}\text{E}(({\it\mu}-{\it\nu})x)+\frac{1}{1-\text{i}}(1-\text{e}^{\text{-i}{\it\nu}x}),\end{eqnarray}$$
and
 $$\begin{eqnarray}\left.\begin{array}{@{}c@{}}\displaystyle {\it\mu}_{A}=k_{1}+k(M_{0}-x_{1}/S_{0})/{\it\beta}^{2},\\ \displaystyle {\it\mu}_{Bnj}=k_{1}-(k_{2n}-kx_{2}/S_{0})/{\it\sigma}_{j},\\ \displaystyle {\it\kappa}_{nj}=k_{2n}-kx_{2}/S_{0}+k(M_{0}-x_{1}/S_{0}){\it\sigma}_{j}/{\it\beta}^{2},\\ \displaystyle {\it\eta}_{Am}=K_{m}+kM_{0}/({\it\beta}^{2}+{\it\sigma}^{2})-k(M_{0}-x_{1}/S_{0})/{\it\beta}^{2},\\ \displaystyle {\it\eta}_{Bmj}=K_{m}+kM_{0}/({\it\beta}^{2}+{\it\sigma}^{2})+(k_{2n}-kx_{2}/S_{0})/{\it\sigma}_{j}.\end{array}\right\}\end{eqnarray}$$
It should be noted that (2.42) is the far-field sound induced by the scattered pressure only. When the incident pressure is also incorporated, as pointed out by Amiet (Reference Amiet1978), the number
 $1$
appearing in the parentheses of the function
 ${\it\Gamma}$
should be omitted, i.e. the third term on the right-hand side of (2.46) should be replaced by
 $-\text{e}^{\text{-i}{\it\nu}x}/(1-\text{i})$
.
2.3.3 Statistical formulation
The hypothetical surface pressure of frequency
 ${\it\omega}$
beneath a turbulent boundary layer on the plate surface that would exist when the plate was infinite can be expressed as a Fourier integral,
 $$\begin{eqnarray}P_{int}({\it\omega},x^{\prime },y^{\prime })=\iint \widetilde{P}_{int}({\it\omega},k_{1},k_{2})\text{e}^{\text{i}(k_{1}x^{\prime }+k_{2}y^{\prime })}\,\text{d}k_{1}\,\text{d}k_{2}.\end{eqnarray}$$
Generally, for a given frequency
 ${\it\omega}$
,
 $k_{1}$
can have different values (Amiet Reference Amiet1976b
). However, experiments (Willmarth Reference Willmarth1959) have shown that
 $P_{i}({\it\omega},k_{1},k_{2})$
peaks in the vicinity of
 $k_{1}={\it\omega}/U_{c}$
, where
 $U_{c}$
denotes the convection velocity of the wall pressure gusts and is only a weak function of
 ${\it\omega}$
. Hence, upon defining
 $P_{i}({\it\omega},k_{2})=\int _{-\infty }^{\infty }\widetilde{P}_{int}({\it\omega},k_{1},k_{2})\,\text{d}k_{1}$
, (2.48) reduces to
 $$\begin{eqnarray}P_{int}({\it\omega},x^{\prime },y^{\prime })=\int _{-\infty }^{\infty }P_{i}({\it\omega},k_{2})\text{e}^{\text{i}(\bar{k}_{1}x^{\prime }+k_{2}y^{\prime })}\,\text{d}k_{2},\end{eqnarray}$$
where
 $\bar{k}_{1}={\it\omega}/U_{c}$
.
As shown in the preceding section, a wall pressure gust of
 $$\begin{eqnarray}P_{i}({\it\omega},k_{2})\text{e}^{\text{i}(k_{1}x^{\prime }+k_{2}y^{\prime })}\end{eqnarray}$$
will induce a far-field sound pressure
 $$\begin{eqnarray}\left(\frac{-\text{i}{\it\omega}x_{3}c}{4{\rm\pi}c_{0}S_{0}^{2}}\right){\it\lambda}\frac{\sin ((N+1/2){\it\lambda}(k_{2}-kx_{2}/S_{0}))}{\sin ((k_{2}-kx_{2}/S_{0}){\it\lambda}/2)}{\mathcal{L}}({\it\omega},k_{1},k_{2})P_{i}({\it\omega},k_{2}).\end{eqnarray}$$
Thus, the wall pressure defined by (2.49) will induce a far-field sound pressure of
 $$\begin{eqnarray}p_{f}(\boldsymbol{x},{\it\omega})=\left(\frac{-\text{i}{\it\omega}x_{3}c}{4{\rm\pi}c_{0}S_{0}^{2}}\right)\int _{-\infty }^{\infty }{\it\lambda}\frac{\sin ((N+1/2){\it\lambda}(k_{2}-kx_{2}/S_{0}))}{\sin ((k_{2}-kx_{2}/S_{0}){\it\lambda}/2)}{\mathcal{L}}({\it\omega},\bar{k}_{1},k_{2})P_{i}({\it\omega},k_{2})\,\text{d}k_{2}.\end{eqnarray}$$
The power spectral density (PSD) of the far-field sound is given by
 $$\begin{eqnarray}S_{pp}(\boldsymbol{x},{\it\omega})=\lim _{T\rightarrow \infty }\left(\frac{{\rm\pi}}{T}\langle p_{f}(\boldsymbol{x},{\it\omega})p_{f}^{\ast }(\boldsymbol{x},{\it\omega})\rangle \right),\end{eqnarray}$$
where the asterisk denotes a complex conjugate, and
 $2T$
is the time length used to obtain
 $p_{f}(\boldsymbol{x},{\it\omega})$
by performing Fourier transformation. Substitution of (2.52) into (2.53) yields
 $$\begin{eqnarray}S_{pp}(\boldsymbol{x},{\it\omega})=\left(\frac{{\it\omega}x_{3}c}{4{\rm\pi}c_{0}S_{0}^{2}}\right)^{2}\int _{-\infty }^{\infty }{\it\lambda}^{2}\left(\frac{\sin ((N+1/2){\it\lambda}(k_{2}-kx_{2}/S_{0}))}{\sin ((k_{2}-kx_{2}/S_{0}){\it\lambda}/2)}\right)^{2}\left|{\mathcal{L}}\right|^{2}{\it\Pi}({\it\omega},k_{2})\,\text{d}k_{2},\end{eqnarray}$$
where
 ${\it\Pi}({\it\omega},k_{2})$
is the wavenumber spectral density (Amiet Reference Amiet1975) of the hypothetical wall pressure beneath the turbulent boundary layer on the plate surface. For very wide serrations, i.e.
 $h\approx 0$
, (2.54) reduces to Amiet’s model (Amiet Reference Amiet1976b
). Equation (2.54) can be simplified by assuming a very large span, i.e. the number of serrations
 $(2N+1)$
is sufficiently large. Using the equation
 $$\begin{eqnarray}\lim _{N\rightarrow \infty }{\it\lambda}^{2}\frac{\sin ^{2}((N+1/2){\it\lambda}(k_{2}-kx_{2}/S_{0}))}{\sin ^{2}((k_{2}-kx_{2}/S_{0}){\it\lambda}/2)}\sim 2{\rm\pi}d\mathop{\sum }_{m=-\infty }^{\infty }{\it\delta}(k_{2}-kx_{2}/S_{0}+2m{\rm\pi}/{\it\lambda}),\end{eqnarray}$$
where
 ${\it\delta}(x)$
is the conventional generalized function defined in § 2, one can show that the PSD of the far-field sound in the plane
 $y^{\prime }=0$
is given by
 $$\begin{eqnarray}S_{pp}(\boldsymbol{x},{\it\omega})=\left(\frac{{\it\omega}x_{3}c}{4{\rm\pi}c_{0}S_{0}^{2}}\right)^{2}2{\rm\pi}d\mathop{\sum }_{m=-\infty }^{\infty }\left|{\mathcal{L}}({\it\omega},\bar{k}_{1},2m{\rm\pi}/{\it\lambda})\right|^{2}{\it\Pi}({\it\omega},2m{\rm\pi}/{\it\lambda}).\end{eqnarray}$$
Equation (2.56) is the fundamental result of this paper, and it is interesting to note that the infinite series in (2.56) appears to be similar to that in Howe’s model shown in (4.2). For example, both results show that the PSD of far-field sound is related to the wavenumber spectral density of the surface pressure through
 ${\it\Pi}({\it\omega},2m{\rm\pi}/{\it\lambda})$
; therefore, a skewed wall pressure gust with
 $k_{2}=2m{\rm\pi}/{\it\lambda}$
plays an important role in sound generation.
2.4 Discussion of the effects of serration geometry
The complicated formulation of the far-field noise (2.56) and the response function (2.43) makes it very difficult to assess the effectiveness of serrations without numerical evaluation of the equations. This section attempts to derive two simple conditions for serrations to obtain effective noise reduction. In order to achieve significant sound reduction, we wish to minimize (2.56). Since
 $|{\mathcal{L}}({\it\omega},\bar{k}_{1},2m{\rm\pi}/{\it\lambda})|^{2}$
is very complex, we will perform an order analysis first.
Careful examination of (2.43) shows that
 $|{\mathcal{L}}|^{2}$
is proportional to
 $1/|{\it\kappa}_{n^{\prime }j}|^{2}$
. For illustration purposes, we assume that the observer is at
 $90^{\circ }$
above the trailing edge in the mid-span plane, i.e.
 $x_{1}=0$
and
 $x_{2}=0$
, and that the Mach number is low, e.g.
 $M_{0}<0.2$
. Then,
 ${\it\kappa}_{mj}\approx 0$
when
 $m$
satisfies
 $k_{2}+2m{\rm\pi}/{\it\lambda}\approx 0$
, and thus the value of
 $|{\mathcal{L}}({\it\omega},\bar{k}_{1},-2m{\rm\pi}/{\it\lambda})|^{2}$
is dominated by mode
 $m$
, i.e.
 $$\begin{eqnarray}|{\mathcal{L}}({\it\omega},\bar{k}_{1},-2m{\rm\pi}/{\it\lambda})|^{2}\approx \frac{2}{{\it\lambda}^{2}c^{2}}\left|a_{m}Q_{mm}+{\it\Theta}_{m}^{(1)}+{\it\Theta}_{m}^{(2)}+\,\cdots \,\right|^{2}.\end{eqnarray}$$
Furthermore, noting that
 $v_{nm}=4h/({\rm\pi}^{2}(n-m)^{2})$
when
 $n-m$
is odd, (2.44) suggests that
 ${\it\Theta}_{m}^{(i)}$
may be roughly approximated by only summing over modes
 $m-1$
and
 $m+1$
, since higher orders
 $m\pm (2j+1)$
with
 $j\geqslant 1$
are at least one order of magnitude smaller due to the quadratic term in the denominator of
 $v_{nm}$
. Using this approximation,
 ${\it\Theta}_{m}^{(i)}$
varies linearly with
 $a_{m-1}$
and
 $a_{m+1}$
. From the definition of
 $a_{m}$
in (2.20), it can be shown that
 $$\begin{eqnarray}a_{m}=\frac{\text{e}^{\text{i}m{\rm\pi}/2}}{2}\text{sinc}(k_{1}h-m{\rm\pi}/2)+\frac{\text{e}^{-\text{i}m{\rm\pi}/2}}{2}\text{sinc}(k_{1}h+m{\rm\pi}/2).\end{eqnarray}$$
Therefore,
 $|a_{m-1}|$
and
 $|a_{m+1}|$
are of the order of
 $|a_{m}|$
, and
 $|{\it\Theta}_{m}^{(i)}|=O(|a_{m}|)$
. From (2.57), we hence have
 $|{\mathcal{L}}({\it\omega},\bar{k}_{1},-2m{\rm\pi}/{\it\lambda})|^{2}=O(|a_{m}|^{2})$
, and
 $$\begin{eqnarray}\mathop{\sum }_{m=-\infty }^{\infty }|{\mathcal{L}}({\it\omega},\bar{k}_{1},2m{\rm\pi}/{\it\lambda})|^{2}{\it\Pi}({\it\omega},2m{\rm\pi}/{\it\lambda})=O\left(\mathop{\sum }_{m=-\infty }^{\infty }|a_{m}|^{2}{\it\Pi}({\it\omega},2m{\rm\pi}/{\it\lambda})\right).\end{eqnarray}$$
We are now in a position to discuss the conditions for minimizing (2.59). It is clear from (2.58) that
 $|a_{m}|$
is maximum when
 $m\approx \pm {\it\nu}_{0}$
, where
 ${\it\nu}_{0}=2k_{1}h/{\rm\pi}$
. To minimize the right-hand side in (2.59), we therefore require that
 ${\it\Pi}({\it\omega},2m{\rm\pi}/{\it\lambda})\ll {\it\Pi}({\it\omega},0)$
when
 $m$
approaches
 $\pm {\it\nu}_{0}$
. Assuming frozen turbulence,
 ${\it\Pi}({\it\omega},2m{\rm\pi}/{\it\lambda})$
is given by
 $$\begin{eqnarray}{\it\Pi}\left({\it\omega},\frac{2{\rm\pi}m}{{\it\lambda}}\right)=\frac{1}{2{\rm\pi}}\int _{-\infty }^{\infty }S_{qq}({\it\omega},y^{\prime })\text{e}^{-\text{i}(2{\rm\pi}m/{\it\lambda})y^{\prime }}\,\text{d}y^{\prime }.\end{eqnarray}$$
When
 $2{\rm\pi}{\it\nu}_{0}l_{y^{\prime }}/{\it\lambda}=k_{1}l_{y^{\prime }}{\it\sigma}\gg 1$
, the integrand in (2.60) for
 $m$
close to (or larger than)
 ${\it\nu}_{0}$
oscillates rapidly within the length scale
 $l_{y^{\prime }}$
of
 $S_{qq}({\it\omega},y^{\prime })$
, which corresponds to the spanwise correlation length given by
 $$\begin{eqnarray}l_{y^{\prime }}({\it\omega})=\frac{1}{S_{qq}({\it\omega},0)}\int _{-\infty }^{\infty }S_{qq}({\it\omega},y^{\prime })\,\text{d}y^{\prime }.\end{eqnarray}$$
The integral in (2.60) therefore evaluates to a small value compared with
 ${\it\Pi}({\it\omega},0)$
. Thus, a condition for noise reduction is that
 $k_{1}h_{e}\gg 1$
, where we have defined an effective root-to-tip amplitude
 $2h_{e}={\it\sigma}l_{y^{\prime }}$
that describes the correlated serration amplitude.
As
 $2k_{1}h_{e}=k_{1}{\it\sigma}l_{y^{\prime }}({\it\omega})$
, the decay rate of the spanwise correlation length
 $l_{y^{\prime }}({\it\omega})$
with respect to frequency is critical. If one makes use of Corcos’s correlation length model (Corcos Reference Corcos1964),
 $l_{y^{\prime }}({\it\omega})\approx 2.1U_{c}/{\it\omega}$
,
 $k_{1}h_{e}$
will reduce to a constant, in this case
 $2.1{\it\sigma}$
, a sole function of the serration sharpness factor and independent of frequency. This is consistent with the findings of Howe (Reference Howe1991b
). However, if the decay rate were faster than that given by Corcos, no sound reduction or even some sound increase would occur at high frequencies. An accurate description of the characteristics of the surface pressure fluctuation beneath a boundary layer is therefore critical for the model to accurately predict the sound reduction at high frequencies.
It should be noted that the condition
 $k_{1}h_{e}\gg 1$
is only a necessary condition because when
 $k_{1}h\rightarrow 0$
there is no noise reduction. This can be seen from (2.59), since
 $a_{m}=0$
when
 $k_{1}h\rightarrow 0$
except when
 $m=0$
, so the right-hand side in (2.59) reduces to
 ${\it\Pi}({\it\omega},0)$
, which corresponds to the straight-edge case. From (2.58), for a given integer
 $m$
away from
 ${\it\nu}_{0}$
,
 $|a_{m}|$
tends to zero when
 $k_{1}h\gg 1$
. This provides another necessary condition for noise reduction. Physically, the root-to-tip amplitude of the serrations must be sufficient for them to be seen by the incoming hydrodynamic waves.
We have thus obtained two necessary conditions for noise reduction,
 $k_{1}h_{e}\gg 1$
and
 $k_{1}h\gg 1$
, which are consistent with those proposed by Howe. These conditions will be further investigated in § 5.
3 Results
3.1 Model validation
3.1.1 Finite element method implementation
For the coupled differential equations mentioned in the last section, the solutions are obtained by performing an iterative-solving procedure. In this section, we shall investigate the validity of the proposed iterative solution using the finite element method (FEM). Instead of solving the far-field sound directly, costing a significant amount of computer memory, a feasible alternative is to calculate the near field using the FEM and obtain the far-field solution by performing a surface integral, as adopted in analytical models, see (2.40).
In order to make a direct comparison between the computational and analytical results, the wave equation together with the boundary conditions, given in (2.5) and (2.4) respectively, will be solved. The governing equation and boundary conditions in the frequency domain can be written as
 $$\begin{eqnarray}\left.\begin{array}{@{}ll@{}}\displaystyle {\it\beta}^{2}\frac{\partial ^{2}P}{\partial x^{\prime 2}}+\frac{\partial ^{2}P}{\partial y^{\prime 2}}+\frac{\partial ^{2}P}{\partial z^{\prime 2}}+2\text{i}kM_{0}\frac{\partial P}{\partial x^{\prime }}+k^{2}P=0, & \\ \displaystyle \frac{\partial P}{\partial z^{\prime }}(x^{\prime },y^{\prime },0)=0, & x^{\prime }<H(y^{\prime }),\\ \displaystyle P(x^{\prime },y^{\prime },0)=-P_{i}\text{e}^{\text{i}(k_{1}x^{\prime }+k_{2}y^{\prime })}, & x^{\prime }\geqslant H(y^{\prime }).\end{array}\right\}\end{eqnarray}$$
Using the transformation
 $P=\bar{P}\text{e}^{-\text{i}kM_{0}x^{\prime }/{\it\beta}^{2}}$
, the first-order derivative term, induced by the background flow, can be eliminated. The results will be transformed back to the physical domain before making comparisons. The scattered near-field pressure is obtained by solving (3.1) using the FEM, and the far-field sound pressure is obtained by integrating the pressure distribution over the surface, as described in (2.40) and (2.41).
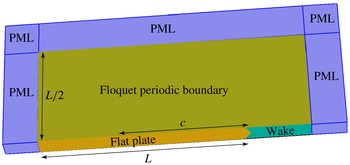
The commercial software COMSOL 4.4 is used to perform the FEM simulations. Simulations are performed for a single serration, as shown in figure 3. The domain size is approximately
 $L$
in the streamwise and
 $L/2$
in the vertical direction. The length
 $L$
depends on the frequency, while the chord length
 $c$
over which the surface integral is performed is kept constant. To eliminate the effect of leading-edge backscattering and have a fast convergence,
 $L$
is taken to be at least twice the sound wavelength. For the boundary conditions, the normal velocity on the surface of the plate vanishes, while the pressure values are fixed over the wake half-plane (the surface denoted by ‘wake’) in figure 3. To eliminate the scattering effect of the edge between the ‘wake’ and its adjacent perfectly matched layer (PML) surfaces, a Gaussian weighted pressure is given, as can be seen on the ‘wake’ surface in figure 4. In addition, as illustrated in figure 3, the walls on both the upper and lower sides of the computational domain represent Floquet periodic boundary conditions. The radiation boundary condition is implemented via PMLs, as shown in figure 3. The mesh is made of tetrahedral cells with quadratic shape functions. The mesh is highly non-uniform and is generated to accurately resolve the hydrodynamic pressure fluctuations near the serrated edge and the acoustic pressure perturbation in the far field. A mesh sensitivity test has been carried out to ensure the proper convergence of the simulation. In the hydrodynamic region, the mesh contains more than 10 grid points within one hydrodynamic wavelength. The ratio of 16 grid points per wavelength is used in the far field, relative to the acoustic wavelength. The finest mesh for the highest frequency contains approximately
 $3.0$
million elements. It should be noted that at low frequencies (e.g.
 $kc\approx 1$
) the computational domain has a very large aspect ratio, which might cause larger numerical errors.
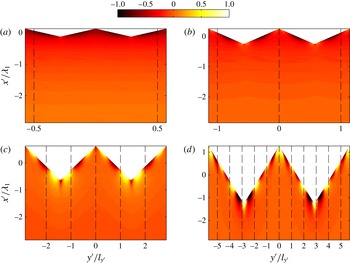
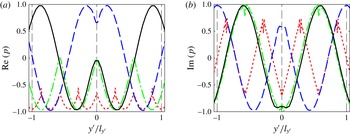
Illustration of the FEM computing domain and the boundary conditions.

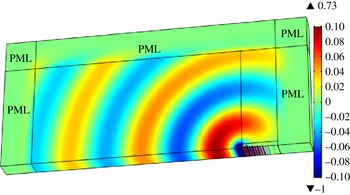
The computed pressure distribution scattered by a straight trailing edge at
 $kc=18$
and
 $M_{0}=0.1$
.

Figure 4 shows the results for a straight trailing edge at
 $kc\approx 18$
and
 $M_{0}=0.1$
. The turbulent convection velocity is assumed to be
 $U_{c}=0.7U$
, where
 $U=M_{0}c_{0}$
. The wavenumbers are
 $k_{1}=2{\rm\pi}f/U_{c}$
,
 $k_{2}=0$
and the amplitude of the incident wall pressure gust
 $P_{i}$
is unity. It can be seen that the PMLs do not cause spurious reflections. As straight-edge scattering is a 2D problem which is implemented in a 3D domain to perform FEM sensitivity analysis, a sweep mesh is used to avoid high-aspect-ratio problems at low frequencies. The solution was also compared with Amiet’s analytical solution. The maximum difference at all frequencies (
 $1<kc<40$
) was less than 1 %.
3.1.2 Finite element method model validation
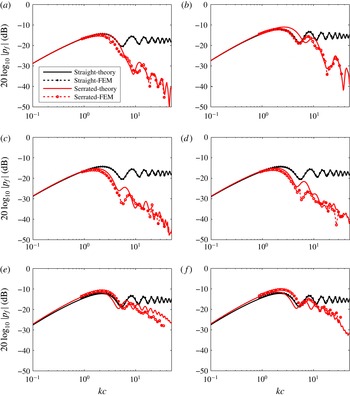
This section provides a comprehensive comparison between the analytical model for gust-induced far-field noise developed in § 2.3.2 and the FEM model developed in § 3.1.1 for different serrations and at different Mach numbers. The far-field sound pressure induced by a wall pressure gust of
 $k_{2}=0$
at different frequencies is chosen for comparison. It should be noted that in the mathematical model, we use the second-order approximation of the gust-response function
 ${\mathcal{L}}$
, as shown in (2.43). The span-to-chord ratio is chosen to be 8. The Mach number and geometrical shape of the serrations can vary in different cases.
The trailing-edge noise sound pressure level (SPL) in the mid-span plane at
 ${\it\theta}=90^{\circ }$
and
 $x_{3}/c=1$
above the plate, due to a wall pressure gust with
 $k_{2}=0$
: (a)
 $M_{0}=0.1,{\it\lambda}/h=6,h/c=0.025$
; (b)
 $M_{0}=0.2,{\it\lambda}/h=6,h/c=0.025$
; (c)
 $M_{0}=0.1,{\it\lambda}/h=3$
,
 $h/c=0.05$
; (d)
 $M_{0}=0.1,{\it\lambda}/h=2,h/c=0.05$
; (e)
 $M_{0}=0.2,{\it\lambda}/h=0.5,h/c=0.1$
; (f)
 $M_{0}=0.2,{\it\lambda}/h=0.3,h/c=0.1$
.

Results are presented for a range of serrations, as illustrated in figure 5(a–f). In this study, we shall only focus on low Mach numbers, i.e.
 $M_{0}\leqslant 0.2$
. The far-field pressure, obtained from the FEM model at
 $90^{\circ }$
above the trailing edge in the mid-span plane with
 $x_{3}/c=1$
, is plotted as
 $20\log _{10}|p_{f}(\boldsymbol{x},{\it\omega})|$
against the theoretical predictions. Results are provided for both straight (no serration, i.e.
 $h=0$
) and serrated trailing edges. It can be found that a sound reduction of more than 20 dB can be achieved for the far-field sound induced by this specific wall pressure gust. This reduction should not, however, be confused with the sound reduction of the real trailing-edge noise, which comprises different wall pressure gusts at different values of
 $k_{2}$
.
Figure 5(a–d) shows good agreement between the theoretical and computational results. In particular, excellent agreement is achieved for the straight-edge cases at all frequencies because of their 2D simplicity. The low-frequency discrepancies for the serrated cases, however, might be due to the error caused by the aforementioned high-aspect-ratio problems. The serration cases presented in figure 5(a–d) are not normally considered to be sharp enough, based on experimental observations (Gruber Reference Gruber2012), to reduce the noise significantly. Figures 5(e) and 5(f) show the results at
 $M_{0}=0.2$
for serrations with
 ${\it\lambda}/h=0.5$
,
 $h/c=0.1$
and
 ${\it\lambda}/h=0.3$
,
 $h/c=0.1$
respectively. It can be seen from these two figures that for sharper serrations, the average error between the numerical calculations and the theoretical predictions normally increases, which might be caused by the relatively slower convergence rate of the second-order approximations of (2.43) compared with that for the wide serrations. The agreement between the FEM results and the proposed model, however, is generally good, suggesting that the second-order solution does indeed give a reasonably good approximation for (2.43). The issue of the convergence of the iterative method will also be discussed later.
3.2 The far-field sound spectrum
A parametric study of far-field noise reduction was carried out by Howe (Reference Howe1991a
,Reference Howe
b
), indicating the possibility of significant noise reduction, much higher than measured data (Gruber Reference Gruber2012). In this section, we shall use the second-order iterative model developed in § 2 and carry out a parametric study. For illustration purposes, we adopt Chase’s model (Chase Reference Chase1987) of the wavenumber spectral density. It is argued by Chase (Reference Chase1987) that the convection velocity
 $U_{c}$
is weakly dependent on the frequency, and on average
 $U_{c}\approx 0.7U$
. According to Chase’s model, the wavenumber spectral density is well approximated by
 $$\begin{eqnarray}{\it\Pi}({\it\omega},k_{1},k_{2})=\frac{C_{m}{\it\rho}_{0}^{2}v_{\ast }^{3}k_{1}^{2}{\it\delta}^{5}}{\left((k_{1}-{\it\omega}/U_{c})^{2}({\it\delta}U_{c}v_{\ast }/3)^{2}+(k_{1}^{2}+k_{2}^{2}){\it\delta}^{2}+{\it\chi}^{2}\right)^{5/2}},\end{eqnarray}$$
where
 ${\it\rho}_{0}$
is the density of the fluid, and
 $C_{m}\approx 0.1553,{\it\chi}\approx 1.33,v_{\ast }\approx 0.03U$
. The turbulent boundary layer thickness
 ${\it\delta}$
in (3.2) is approximated by (Eckert & Drake Reference Eckert and Drake1959)
 $$\begin{eqnarray}{\it\delta}/c=0.382Re_{c}^{-1/5},\end{eqnarray}$$
where
 $Re_{c}$
is the Reynolds number based on the chord
 $c$
. An inspection of (3.2) shows that the wavenumber spectrum peaks around
 $k_{1}={\it\omega}/U_{c}$
. Here, we make use of this fact and obtain
 ${\it\Pi}({\it\omega},k_{2})$
by integrating (3.2) with respect to
 $k_{1}$
and then keeping the leading-order terms (Howe Reference Howe1991b
), which yields
 $$\begin{eqnarray}{\it\Pi}({\it\omega},k_{2})\approx \frac{4C_{m}{\it\rho}_{0}^{2}v_{\ast }^{4}({\it\omega}/U_{c})^{2}{\it\delta}^{4}}{U_{c}\left((({\it\omega}/U_{c})^{2}+k_{2}^{2}){\it\delta}^{2}+{\it\chi}^{2}\right)^{2}}.\end{eqnarray}$$
By substituting (3.4) into (2.56) and using
 $({\it\rho}_{0}v_{\ast }^{2})^{2}(d/c_{0})$
(Howe Reference Howe1991b
) to non-dimensionalize the far-field PSD we obtain
 $$\begin{eqnarray}\frac{S_{pp}(\boldsymbol{x},{\it\omega})}{({\it\rho}_{0}v_{\ast }^{2})^{2}(d/c_{0})}=\frac{C_{m}}{2{\rm\pi}}{\it\Psi}(\boldsymbol{x},{\it\omega}),\end{eqnarray}$$
where
 ${\it\Psi}(\boldsymbol{x},{\it\omega})$
is defined as
 $$\begin{eqnarray}{\it\Psi}(\boldsymbol{x},{\it\omega})=\left(\frac{x_{3}c}{S_{0}^{2}}\right)^{2}\left(\frac{U_{c}}{c_{0}}\right)\mathop{\sum }_{m=-\infty }^{\infty }\left|{\mathcal{L}}({\it\omega},\bar{k}_{1},2{\rm\pi}m/{\it\lambda})\right|^{2}\frac{({\it\omega}{\it\delta}/U_{c})^{4}}{\left[({\it\omega}{\it\delta}/U_{c})^{2}+(2m{\rm\pi}{\it\delta}/{\it\lambda})^{2}+{\it\chi}^{2}\right]^{2}}.\end{eqnarray}$$
The following figures are plotted using (3.6) for a variety of serration geometrical parameters. Since much of the experimental work has focused on the trailing-edge noise at low Mach numbers (Gruber, Joseph & Azarpeyvand Reference Gruber, Joseph and Azarpeyvand2013), we shall only focus on low Mach numbers, i.e.
 $M_{0}\leqslant 0.2$
. The function
 ${\mathcal{L}}$
in (3.6) is defined in (2.43), and we take the second-order approximation here. It should be noted that the incident pressure is also taken into consideration (Amiet Reference Amiet1978). The observer point is at
 $90^{\circ }$
above the trailing edge in the mid-span plane, namely
 $(x_{1}/c=0,\,x_{2}/c=0,\,x_{3}/c=1)$
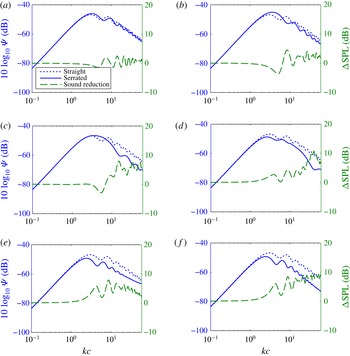
. It is worth pointing out that in figure 6 both the far-field sound spectrum and the sound reduction spectrum are shown.
The normalized spectrum of (3.6) (left axis) for serrated and straight trailing edges (plotted with solid and dotted blue lines respectively) and the sound reduction spectrum
 ${\rm\Delta}\text{SPL}$
(right axis and green dashed line) for an observer at
 ${\it\theta}=90^{\circ }$
and
 $x_{3}/c=1$
above the plate in the mid-span plane with
 $M_{0}=0.1$
: (a)
 ${\it\lambda}/h=8,h/c=0.025$
; (b)
 ${\it\lambda}/h=4,h/c=0.025$
; (c)
 ${\it\lambda}/h=2,h/c=0.05$
; (d)
 ${\it\lambda}/h=1,h/c=0.005$
; (e)
 ${\it\lambda}/h=0.4,h/c=0.05$
; (f)
 ${\it\lambda}/h=0.2,h/c=0.05$
.

The normalized sound power spectra at
 $M_{0}=0.1$
for different serrations are shown in figure 6(a–f). The spectrum for a serrated trailing edge with
 $4h/{\it\lambda}=0.5$
is shown in figure 6(a). As expected, the sound reduction is approximately zero over the entire frequency range of interest. Increasing the sharpness of the serrations gradually improves the sound reduction performance, as shown in figure 6(b–d). For sufficiently sharp serrations, significant sound reduction is achieved over a wide range of frequencies, as shown in figure 6(e), where the sharpness factor is
 $4h/{\it\lambda}=10$
. The result obtained for a sawtooth serration with
 ${\it\lambda}/h=0.2,h/c=0.05$
at
 $M_{0}=0.1$
is shown in figure 6(f). Comparison of figures 6(e) and 6(f) suggests that for already sharp serrations, further increasing the sharpness can provide a better high-frequency noise reduction performance, while the low-frequency performance (
 $kc<10$
) remains unchanged. For the sharp serrations presented in figure 6(f) the far-field sound is reduced by approximately 10 dB at high frequencies. This agrees better with experiments, where a noise reduction of up to 7–10 dB is observed (Dassen et al.
Reference Dassen, Parchen, Bruggeman and Hagg1996; Parchen et al.
Reference Parchen, Hoffmans, Gordner and Braun1999). From figure 6(a,b) it can be found that a slight noise increase may occur at low frequencies. In fact, the noise increase becomes even more pronounced at low frequencies when the Mach number is high, e.g.
 $M_{0}=0.4$
. The explanation of the noise increase at low frequencies will be given in § 5.
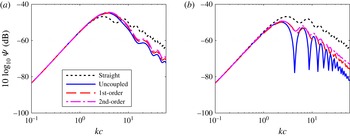
The results presented in figure 6 were based on the second-order approximation. The convergence rate of different-order solutions can be inspected by presenting the far-field sound spectrum using different-order approximations, as shown in figure 7, where the far-field spectra using zero-, first- and second-order approximations are presented. Figure 7(a) presents results for a wide serration with
 ${\it\lambda}/h=2$
. As expected, due to the weak coupling between different modes, the first- and second-order solutions yield almost the same results. It is thus safe to assume that the second-order approximation gives an accurate solution for wide serrations. Figure 7(b) shows the convergence results for a narrow serration with
 ${\it\lambda}/h=0.2$
. It can be seen that the difference between the first- and second-order solutions is much smaller than that between the zero- and first-order ones. The maximum difference between the first- and second-order approximations at high frequencies is less than 2 dB. Thus, the second-order solution can be assumed to provide a reasonably accurate solution for narrow serrations even at high frequencies.
The normalized spectra for straight and serrated trailing edges obtained using different-order approximations, for an observer at
 ${\it\theta}=90^{\circ }$
and
 $x_{3}/c=1$
above the plate in the mid-span plane with
 $M_{0}=0.1$
: (a)
 ${\it\lambda}/h=2,h/c=0.025$
; (b)
 ${\it\lambda}/h=0.2$
,
 $h/c=0.05$
.

3.3 Directivity patterns
It is a well-established fact that the trailing-edge noise directivity changes with frequency (Williams & Hall Reference Williams and Hall1970; Gruber et al.
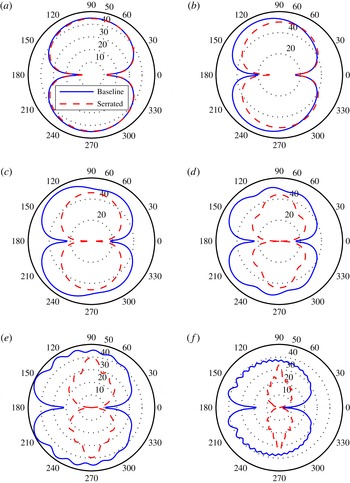
Reference Gruber, Joseph and Azarpeyvand2013). However, the effect of serrations on trailing-edge noise directivity has received very little research attention. Figures 8 and 9 present the non-dimensional far-field PSD, (3.6), based on the second-order solution. Results are presented for straight and serrated trailing edges with
 ${\it\lambda}/h=0.4$
at
 $M_{0}=0.1$
and
 $0.4$
respectively. As expected, the use of serrations has little effect on the noise generation at very low frequencies,
 $kc\leqslant 1$
. The results show, however, that serrations can effectively reduce the noise at higher frequencies. As discussed earlier, this is believed to be primarily due to destructive scattering interference effects. While most experimental investigations (Gruber et al.
Reference Gruber, Joseph and Azarpeyvand2013) have focused on the capability of serrations to reduce the noise at small angles and 90° above the trailing edge, the results in figures 8 and 9 clearly show that serrations are more effective in reducing the noise at large radiation angles, i.e. towards the leading edge,
 ${\it\theta}>90^{\circ }$
. This is a very interesting result, as noise measurement in the laboratory environment is often limited to 30°–120° due to the anechoic chamber room size constraint or reflection by the contraction nozzle, etc. (Gruber Reference Gruber2012; Moreau & Doolan Reference Moreau and Doolan2013).
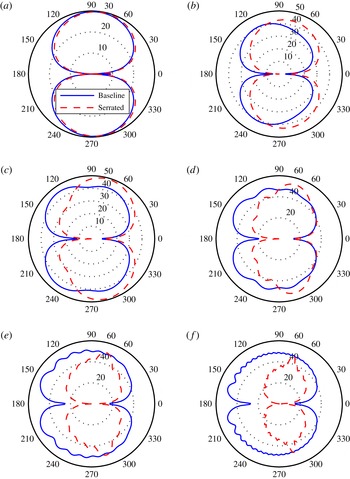
The directivity patterns plotted against
 ${\it\theta}$
in the mid-span plane (
 $x_{2}=0$
and
 $\sqrt{x_{1}^{2}+x_{3}^{2}}/c=1$
) at
 $M_{0}=0.1$
for serrations with
 ${\it\lambda}/h=0.4$
and
 $h/c=0.05$
. The far-field sound level in the figures is
 $10\log _{10}({\it\Psi}(\boldsymbol{x},{\it\omega})/(4\times 10^{-10}))$
: (a)
 $kc=1$
; (b)
 $kc=3$
; (c)
 $kc=5$
; (d)
 $kc=10$
; (e)
 $kc=20$
; (f)
 $kc=50$
.

The directivity patterns plotted against
 ${\it\theta}$
in the mid-span plane (
 $x_{2}=0$
and
 $\sqrt{x_{1}^{2}+x_{3}^{2}}/c=1$
) at
 $M_{0}=0.4$
for serrations with
 ${\it\lambda}/h=0.4$
and
 $h/c=0.05$
. The far-field sound level in the figures is
 $10\log _{10}({\it\Psi}(\boldsymbol{x},{\it\omega})/(4\times 10^{-10}))$
: (a)
 $kc=1$
; (b)
 $kc=3$
; (c)
 $kc=5$
; (d)
 $kc=10$
; (e)
 $kc=20$
; (f)
 $kc=50$
.

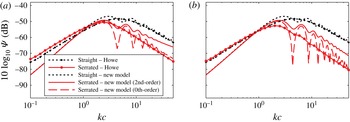
The normalized spectra of Howe’s model and the new model. The observer is at
 $90^{\circ }$
above the trailing edge in the mid-span plane with
 $x_{3}/c=1$
: (a)
 ${\it\lambda}/h=0.4,h/c=0.05,M_{0}=0.1$
; (b)
 ${\it\lambda}/h=0.2,h/c=0.05,M_{0}=0.1$
.

The results have also shown that the use of serrations can lead to significant changes to the directivity pattern of the scattered pressure field at high frequencies. While one would expect a cardioid pattern for straight edges at high frequencies, associated with the edge scattering of a half-plane (Williams & Hall Reference Williams and Hall1970), the results for serrated trailing edges show that the directivity pattern is more dipolar with a clear peak at a specific angle which depends on both the serration sharpness and the Mach number. Numerical study of the directivity pattern for different serrations has shown that the expected cardioid shape gradually changes to a more dipolar shape as the serration sharpness increases, and the directivity peak also gradually moves downstream, towards the trailing edge. The dipolar behaviour of the noise from serrated trailing edges means that the leading-edge region,
 ${\it\theta}=180^{\circ }$
, is much quieter than that for a straight trailing edge. Increasing the Mach number also appears to move the peak angle towards the trailing edge, as can be seen by comparing figures 8 and 9. It is also worth mentioning that in the case of high Mach numbers, see figure 9, the use of serrations can lead to considerable noise increase in the trailing-edge region (
 $0^{\circ }<{\it\theta}<90^{\circ }$
) for intermediate frequencies,
 $1<kc<10$
.
4 Comparison with Howe’s model
The mathematical model and serration geometrical criteria developed by Howe have long been used as a tool to evaluate the effectiveness of trailing-edge serrations and estimate the level of noise reduction (Gruber Reference Gruber2012; Jones & Sandberg Reference Jones and Sandberg2012; Azarpeyvand et al. Reference Azarpeyvand, Gruber and Joseph2013). However, it has repeatedly been shown that Howe’s model overpredicts the level of noise reduction (Dassen et al. Reference Dassen, Parchen, Bruggeman and Hagg1996; Parchen et al. Reference Parchen, Hoffmans, Gordner and Braun1999; Gruber Reference Gruber2012). To simplify the model, Howe assumes that the Mach number is sufficiently low to neglect the convection effect, the statistical property of the turbulence inside the boundary layer remains the same before and after passing the trailing edge and the diffraction model is based on the Green’s function for straight trailing edges and the slender-wing approximation.
With the introduction of Chase’s surface pressure wavenumber spectral density model, Howe (Reference Howe1991a ) shows that the far-field PSD is given by
 $$\begin{eqnarray}\frac{S_{pp}({\it\omega},\boldsymbol{x})}{({\it\rho}_{0}v_{\ast }^{2})^{2}(d/c_{0})({\it\delta}/|\boldsymbol{x}|)^{2}}=\frac{C_{m}}{{\rm\pi}}\sin ^{2}({\it\theta}/2)\sin ({\it\phi}){\it\Psi}_{f}({\it\omega}),\end{eqnarray}$$
where
 $$\begin{eqnarray}{\it\Psi}_{f}({\it\omega})=8(h/{\it\delta})^{2}\mathop{\sum }_{m=-\infty }^{\infty }\frac{({\it\omega}h/U_{c})^{2}[({\it\omega}h/U_{c})^{2}+(2m{\rm\pi}h/{\it\lambda})^{2}][1-\cos (2{\it\omega}h/U_{c})/\cos (m{\rm\pi})]}{[(2{\it\omega}h/U_{c})^{2}-m^{2}{\rm\pi}^{2}]^{2}[({\it\omega}h/U_{c})^{2}+(2m{\rm\pi}h/{\it\lambda})^{2}+({\it\chi}h/{\it\delta})^{2}]^{2}}.\end{eqnarray}$$
Even though the assumption of frozen turbulence is used in both models, Howe’s model differs from the model presented in this paper in several ways. In Howe’s model, the far-field sound pressure is based on a compact Green’s function. The Green’s function is obtained by making use of the slender-wing approximation. The model developed in this paper, however, gives the scattered sound by solving the convected wave equation. Howe’s model neglects the effects of convection, so it is only valid at low Mach numbers. The new model is valid for any subsonic Mach number, as the convection effects have been incorporated in the convected wave equation. In addition, the new model requires
 $kc>1$
, as a semi-infinite chord is assumed in the derivation.
The figures in this section represent the results obtained using Howe’s model, i.e. (4.1), and the model developed in this paper, i.e. (3.5). The normalized spectrum
 ${\it\Psi}(\boldsymbol{x},{\it\omega})$
is defined in the same way as in (3.5). The result of the new model with the correction applied to the third term in (2.46), according to Amiet (Reference Amiet1978), is to systematically increase the noise level by
 $6$
dB. Figure 10(a) shows the noise prediction results for a serrated trailing edge with
 ${\it\lambda}/h=0.4,h/c=0.05$
at
 $M_{0}=0.1$
using both models. The comparison of the results shows a clear difference between the two methods. At high frequencies, e.g.
 $kc\approx 50$
, Howe’s model gives a sound reduction of approximately
 $13$
dB, while the new model predicts approximately
 $7$
dB of noise reduction. Figure 10(b) presents the comparison for sharper serrations, with
 ${\it\lambda}/h=0.2,h/c=0.05$
at
 $M_{0}=0.1$
. At
 $kc\approx 50$
, the noise reductions predicted by Howe’s model and the new model are respectively 18 dB and 10 dB. It can be interpreted from the results that the new model provides a much more realistic noise reduction estimate and is more consistent with experimental observations (Dassen et al.
Reference Dassen, Parchen, Bruggeman and Hagg1996; Parchen et al.
Reference Parchen, Hoffmans, Gordner and Braun1999; Gruber Reference Gruber2012; Gruber et al.
Reference Gruber, Joseph and Azarpeyvand2013).
It is very interesting to note that the zero-order solution accurately follows Howe’s solution at high frequencies, as shown in figure 10. At intermediate frequencies, i.e.
 $2<kc<20$
, the zero-order solution oscillates strongly, but the mean value seems to be following Howe’s result. This is actually not hard to understand, as the Green’s function used in Howe’s model (Howe Reference Howe1991a
) is in fact only valid locally. In other words, it does not include the coupling effect between adjacent sawtooth edges. Thus, at high frequency we expect the zero-order (without the coupling effect induced by the singular root and tip points) solution to coincide with Howe’s results. The high-order solution, however, adds the coupled interactions between different modes, and this coupling effect clearly reduces the sound reduction predicted by the zero-order solution at high frequencies. Thus, the large overprediction of Howe’s model is likely to have been caused by the choice of the Green’s function, since the Green’s function is not able to take the coupling effects into account.
5 Noise reduction mechanism
In order to better understand the noise reduction mechanism, the pressure distribution over the flat plate surface is presented, see figures 11–14. As mentioned earlier, the incident pressure only raises the far-field sound by 6 dB systematically, thus it suffices to consider the scattered pressure distribution only. The scattered pressure, as mentioned in § 2, is essentially the pressure jump across the flat plate. As mentioned in § 2.4, the two non-dimensional parameters
 $k_{1}h$
and
 $k_{1}h_{e}$
play an important role for effective sound reduction using serrated trailing edges. In what follows, the scattered pressure distribution will be presented by fixing one parameter and varying the other. It should be noted that the scattered pressure mentioned here is due to wall pressure gusts with
 $k_{2}=0$
. The discussion, however, also applies to gusts with
 $k_{2}\neq 0$
, as the streamwise number
 $k_{1}$
has the same value for different gusts.
The scattered surface pressure distribution at a fixed frequency for the same
 $k_{1}h_{e}=7$
: (a)
 $k_{1}h=2$
; (b)
 $k_{1}h=4$
; (c)
 $k_{1}h=10$
; (d)
 $k_{1}h=20$
. The horizontal axis shows the spanwise coordinate normalized by the spanwise correlation length and the vertical axis shows the streamwise coordinate normalized by the hydrodynamic wavelength.

The scattered pressure on the serrated edge, with the red dotted line for
 $k_{1}h=2$
, the green dot-dashed line for
 $k_{1}h=4$
, the blue dashed line for
 $k_{1}h=10$
and the black solid line for
 $k_{1}h=20$
. (a) Real part; (b) imaginary part.

The scattered surface pressure distribution for different serrations at a fixed frequency and
 $k_{1}h=10$
: (a)
 $k_{1}h_{e}=1$
; (b)
 $k_{1}h_{e}=3$
; (c)
 $k_{1}h_{e}=6$
; (d)
 $k_{1}h_{e}=10$
. The horizontal axis shows the spanwise coordinate normalized by the spanwise correlation length and the vertical axis shows the streamwise coordinate normalized by the hydrodynamic wavelength.

The scattered pressure on the flat plate is presented in figure 11 for different values of
 $k_{1}h$
. The scattered surface pressure is obtained by evaluating the real part of (2.39) using the second-order approximation (
 $P_{i}=1$
) and then normalizing to unity. The results presented in figure 11 are obtained for
 $k_{1}h_{e}=7$
, while
 $k_{1}h$
varies between
 $2$
and
 $20$
. The spanwise coordinate
 $y^{\prime }$
is normalized by the spanwise correlation length
 $l_{y^{\prime }}$
and the streamwise coordinate
 $x^{\prime }$
is normalized by the hydrodynamic wavelength
 ${\it\lambda}_{1}=2{\rm\pi}/k_{1}$
. Thus, the distance between two adjacent streamwise dashed lines corresponds to the spanwise correlation length,
 $l_{y^{\prime }}$
. Figure 11(a) plots the scattered surface pressure distribution near the trailing edge for
 $k_{1}h=2$
. It shows that the scattered surface pressure field between two adjacent streamwise lines is essentially in phase, so no strong phase variation within
 $l_{y^{\prime }}$
occurs. Figure 11(b) shows the scattered surface pressure distribution for
 $k_{1}h=4$
, and it can seen that small phase differences appear within a spanwise correlation length. Figure 11(c) shows the scattered surface pressure distribution for
 $k_{1}h=10$
. It is clear that even if the spanwise correlation length becomes smaller, a pronounced phase difference still appears within adjacent streamwise lines. Further increasing the value of
 $k_{1}h$
to
 $20$
, as shown in figure 11(d), decreases the spanwise correlation length, but enough phase difference still appears within the increasingly narrow ranges.
To make the phase variation induced by the presence of serrations even clearer, the scattered surface pressure along the trailing edge is presented in figure 12. Each line corresponds to a different value of
 $k_{1}h$
. The real and imaginary parts of the pressure are shown in figures 12(a) and 12(b) respectively. The two figures are thus showing the pressure distributions at different instants. The red curve in figure 12(a), which corresponds to the real part for
 $k_{1}h=2$
, remains almost entirely negative. The corresponding imaginary part, shown in red in figure 12(b), has a phase that slightly changes sign over
 $l_{y^{\prime }}$
. Since the signal oscillates between the real and imaginary parts, the phase changes sign only over a small fraction of the cycle. The black curves corresponding to
 $k_{1}h=20$
, on the other hand, show a strong variation within a spanwise correlation length in both figures 12(a) and 12(b), indicating a strong phase variation over the whole cycle. Therefore, the phase differences of the scattered pressure are more likely to be strong and permanent for high values of
 $k_{1}h$
.
The scattered pressure distributions for different values of
 $k_{1}h_{e}$
are presented in figure 13. The value of
 $k_{1}h$
is fixed at
 $10$
, while
 $k_{1}h_{e}$
increases from
 $1$
to
 $10$
(see figure 13
a–d). The spanwise and streamwise coordinates are also normalized by
 $l_{y^{\prime }}$
and
 ${\it\lambda}_{1}$
respectively. Figure 13(a) presents the scattered surface pressure distribution for
 $k_{1}h_{e}=1$
. As
 $k_{1}h_{e}$
is small, the distance between two adjacent dashed lines is very small compared with the serration wavelength. Thus, even though pronounced phase differences appear along the edge, one can hardly see any phase variations within a spanwise correlation length. The pressure distribution for
 $k_{1}h_{e}=2$
is shown in figure 13(b), and no significant phase variations are achieved. However, for
 $k_{1}h_{e}=4$
a clear phase variation of the scattered pressure begins to appear within adjacent lines, as shown in figure 13(c). From figure 13(d), where
 $k_{1}h_{3}=10$
, it can be seen that pronounced phase differences appear within a correlation length
 $l_{y^{\prime }}$
in the spanwise direction. To better visualize the phase variation appearing in the spanwise direction due to serrations, the scattered pressure along the serrated edge is shown in figure 14 for the same values of
 $k_{1}h_{e}$
as in figure 13. Both the real and imaginary parts of the scattered pressure are presented. The tendency for large values of
 $k_{1}h_{e}$
to favour strong phase variations is clearly demonstrated.
The scattered pressure on the serrated edge for different serration geometries, with the black solid line for
 $k_{1}h_{3}=1$
, the blue dashed line for
 $k_{1}h_{e}=3$
, the green dot-dashed line for
 $k_{1}h_{e}=6$
and the red dotted line for
 $k_{1}h_{e}=10$
. (a) Real part; (b) imaginary part.

Finally, one is in a position to discuss the noise reduction mechanism by investigating the physical implications of the two parameters
 $k_{1}h$
and
 $k_{1}h_{e}$
. From figure 11 it is obvious that the criterion
 $k_{1}h\gg 1$
ensures an effective phase variation appearing along and near the trailing edge in the spanwise direction. In addition, as shown by figure 13, the condition
 $k_{1}h_{e}\gg 1$
ensures that the phase difference appears within one spanwise correlation length, i.e. between two adjacent dashed lines shown in figures 11 and 13. Since the surface pressure within the regions bordered by dashed lines is coherent, and since the range over which the phase difference appears is clearly much smaller than the acoustic wavelength, the far-field sound will be reduced due to destructive interference. Physically, this means that the phase differences induced on the flat plate in the spanwise direction due to the presence of serrations should be well situated within a correlated turbulent structure. Therefore, as demonstrated in both figures 11 and 13, the sound reduction is caused by the destructive interference of the scattered surface pressure due to the presence of serrations.
The results in § 3.2 have shown that in the case of wide serrations, a noise increase at low frequencies is also possible, especially at high Mach numbers. The reason is that at low frequencies, only little phase variation is induced by the presence of serrated trailing edges in the spanwise direction, but the wetted length of the trailing edge is in fact much longer than that of a straight one. Thus, the net effect of phase interference can be constructive, which leads to an increase in the far-field noise. This is more likely to occur when
 $k_{1}h$
is small, i.e.
 $M_{0}$
is large, the frequency is low or the serration is wide (small value of
 $h$
).
Based on the preceding discussion, one can conclude that the minimum effective serration length required for noise reduction can be obtained from
 $h_{min}=\min (h,h_{e})$
. It is then straightforward to combine the two conditions stated above into one, i.e.
 $k_{1}h_{min}\gg 1$
. Therefore, in order to achieve an effective noise reduction in the far field, the geometry of the serrations should satisfy
 $k_{1}h_{min}\gg 1$
. Based on the interference results in figures 11 and 13, it can be found that a common rule of thumb is
 $k_{1}h_{min}\gtrsim {\rm\pi}$
, with a higher value more favourable.
6 Conclusion
A new mathematical model is developed in this paper to predict the sound radiated by serrated trailing edges. The model begins by establishing an idealized scattering problem, resulting in a mixed boundary value convective wave equation problem with complex boundaries. This leads to a set of coupled partial differential equations, which cannot be solved using the standard separation method. A solution is obtained based on Fourier expansion to separate the variables and Schwarzschild’s method together with an iterative technique to solve the resulting coupled equations. The far-field sound is evaluated using the surface pressure integrals. The PSD of the far-field sound is related to the wavenumber spectral density of the wall pressure beneath the turbulent boundary layer near the trailing edge using Amiet’s approach (Amiet Reference Amiet1976b , Reference Amiet1978).
The results obtained using the new model agree well with FEM computations, suggesting that the model developed in this paper captures the scattering process and gives correct predictions for the sound generated by serrated trailing edges. It is shown that the coupling effect must not be ignored, and as a result the new model can predict the sound reduction more accurately than Howe’s model (Howe Reference Howe1991a ,Reference Howe b ). The results obtained using the new model agree better with experiments, in which the average sound reduction is reported to be up to approximately 7 dB. The directivity results show that serrations can significantly reduce the noise in the area near the leading edge and that at high Mach numbers the use of serrations can lead to noise increase at small angles.
The physical mechanism for noise reduction is found to be interference effects in the wall pressure fluctuations due to the presence of serrations. Two non-dimensional parameters are found to be critical. The first is
 $k_{1}h\gg 1$
, to ensure the existence of strong phase variation in the spanwise direction. The second is
 $k_{1}h_{e}\gg 1$
, to ensure that the phase differences along the edges are correlated in the spanwise direction. The sound reduction generally increases as the serration sharpness increases, but if the serrations are already sharp enough, further increasing the slope only affects high frequencies.
The results obtained using Chase’s turbulent boundary layer spectrum model do not appear to explain the noise increase observed in experiments at high frequencies (Parchen et al. Reference Parchen, Hoffmans, Gordner and Braun1999; Oerlemans et al. Reference Oerlemans, Fisher, Maeder and Kögler2009; Gruber Reference Gruber2012). This suggests that the wavenumber–frequency spectra of the surface pressure fluctuations (see § 2.4) are not accurate or that this noise increase is due to some other mechanisms, such as the high-intensity flow through serration valleys. In addition, the current model assumes perfect correlations in the streamwise direction, which may not be sufficiently accurate according to the measurements of Gruber (Reference Gruber2012). Thus, the current model may be further improved by incorporating more physical parameters such as the streamwise correlation length.
Acknowledgements
The first author (B.L.) wishes to gratefully acknowledge the financial support cofunded by the Cambridge Commonwealth European and International Trust and the China Scholarship Council. The second author (M.A.) would like to acknowledge the financial support of the Royal Academy of Engineering. The third author (S.S.) wishes to gratefully acknowledge the support of the Royal Commission for the exhibition of 1851. Finally, the authors thank S. Moreau and M. Roger for their useful feedback and many stimulating discussions, and Professor D. A. Dowling for helping to resolve an early error in modelling the scattered pressure jump.
Appendix A
A.1 The scattered pressure of the second iteration
The solution after the second iteration can be expressed as
 $$\begin{eqnarray}\boldsymbol{P}^{(2)}(x,0)=\boldsymbol{N}(x)+\boldsymbol{C}^{(1)}(x)+\boldsymbol{C}^{(2)}(x),\end{eqnarray}$$
where
 $\boldsymbol{N}(x)$
and
 $\boldsymbol{C}^{(1)}(x)$
are defined in § 2, and the entry for
 $\boldsymbol{C}^{(2)}(x)$
corresponding to mode
 $n^{\prime }$
is
 $$\begin{eqnarray}\displaystyle C_{n^{\prime }}^{(2)}(x) & = & \displaystyle P_{i}(1-\text{i})\text{e}^{\text{i}k_{1}x}\mathop{\sum }_{m=-\infty }^{\infty }\left\{\vphantom{\left(\sqrt{\frac{{\it\mu}_{m}}{-2{\rm\pi}x}}\right)}{\it\beta}_{n^{\prime }m}(\text{i}k_{1})^{2}(\text{E}(-{\it\mu}_{n^{\prime }}x)-\text{E}(-{\it\mu}_{m}x))\right.\nonumber\\ \displaystyle & & \displaystyle -\,({\it\beta}_{n^{\prime }m}\text{i}k_{1}+{\it\gamma}_{n^{\prime }m}\text{i}(k_{1}-{\it\mu}_{m}))\sqrt{\frac{{\it\mu}_{m}}{-2{\rm\pi}x}}(\text{e}^{-\text{i}{\it\mu}_{n^{\prime }}x}-\text{e}^{-\text{i}{\it\mu}_{m}x})\nonumber\\ \displaystyle & & \displaystyle -\,\frac{{\it\gamma}_{n^{\prime }m}}{2}\left(\sqrt{\frac{{\it\mu}_{m}}{-2{\rm\pi}x}}\frac{1}{(-x)}(\text{e}^{-\text{i}{\it\mu}_{n^{\prime }}x}-\text{e}^{-\text{i}{\it\mu}_{m}x})\right.\nonumber\\ \displaystyle & & \displaystyle -\,\left.\left.\text{i}({\it\mu}_{n^{\prime }}-{\it\mu}_{m})\sqrt{\frac{{\it\mu}_{m}}{-2{\rm\pi}x}}\text{e}^{-\text{i}{\it\mu}_{n^{\prime }}x}\right)\right\},\end{eqnarray}$$
where
 $$\begin{eqnarray}\displaystyle & \displaystyle {\it\beta}_{ln}=\mathop{\sum }_{m=-\infty }^{\infty }(v_{ln}a_{m}-B_{lm}a_{n}/(k_{2l}^{2}-k_{2n}^{2}))v_{nm}, & \displaystyle\end{eqnarray}$$
 $$\begin{eqnarray}\displaystyle & \displaystyle {\it\gamma}_{ln}=\mathop{\sum }_{m=-\infty }^{\infty }(v_{ln}a_{m}\sqrt{{\it\mu}_{m}/{\it\mu}_{n}}-B_{lm}a_{n}/(k_{2l}^{2}-k_{2n}^{2}))v_{nm}. & \displaystyle\end{eqnarray}$$
A.2 The far-field sound pressure of the second iteration
The function
 $T_{nm}$
involved in the second iteration can be defined as
 $$\begin{eqnarray}\displaystyle T_{nm} & = & \displaystyle \mathop{\sum }_{j=0}^{1}\frac{1}{\text{i}{\it\kappa}_{nj}}\left\{\left(\vphantom{\left(\frac{1}{\sqrt{2{\rm\pi}(c+{\it\epsilon}_{j})}}\right)}\frac{\text{i}{\it\eta}_{Am}}{\sqrt{{\it\eta}_{Am}}}(\text{e}^{\text{i}{\it\kappa}_{nj}{\it\chi}_{j+1}}\text{E}({\it\eta}_{Am}(c+{\it\epsilon}_{j+1}))-\text{e}^{\text{i}{\it\kappa}_{nj}{\it\chi}_{j}}\text{E}({\it\eta}_{Am}(c+{\it\epsilon}_{j})))\right.\right.\nonumber\\ \displaystyle & & \displaystyle \left.-\,\frac{\text{i}{\it\eta}_{Bmj}}{\sqrt{{\it\eta}_{Bmj}}}\text{e}^{\text{i}{\it\kappa}_{nj}({\it\chi}_{j}-(c+{\it\epsilon}_{j})/{\it\sigma}_{j})}(\text{E}({\it\eta}_{Bmj}(c+{\it\epsilon}_{j+1}))-\text{E}({\it\eta}_{Bmj}(c+{\it\epsilon}_{j})))\right)\nonumber\\ \displaystyle & & \displaystyle -\,\left(\left(\text{e}^{\text{i}{\it\kappa}_{nj}{\it\chi}_{j+1}}\frac{1}{\sqrt{2{\rm\pi}(c+{\it\epsilon}_{j+1})}}\text{e}^{\text{i}{\it\eta}_{Am}(c+{\it\epsilon}_{j+1})}-\text{e}^{\text{i}{\it\kappa}_{nj}{\it\chi}_{j}}\frac{1}{\sqrt{2{\rm\pi}(c+{\it\epsilon}_{j})}}\text{e}^{i{\it\eta}_{Am}(c+{\it\epsilon}_{j})}\right)\right.\nonumber\\ \displaystyle & & \displaystyle \left.\left.-\,\text{e}^{\text{i}{\it\kappa}_{nj}({\it\chi}_{j}-(c+{\it\epsilon}_{j})/{\it\sigma}_{j})}\left(\frac{1}{\sqrt{2{\rm\pi}(c+{\it\epsilon}_{j+1})}}\text{e}^{\text{i}{\it\eta}_{Bmj}(c+{\it\epsilon}_{j+1})}-\frac{1}{\sqrt{2{\rm\pi}(c+{\it\epsilon}_{j})}}\text{e}^{\text{i}{\it\eta}_{Bmj}(c+{\it\epsilon}_{j})}\right)\right)\right\}.\nonumber\\ \displaystyle & & \displaystyle\end{eqnarray}$$
The second iterated solution falls into the same pattern,
 $$\begin{eqnarray}\displaystyle & \displaystyle p^{(2)}(\boldsymbol{x},{\it\omega})=\frac{-\text{i}{\it\omega}x_{3}}{4{\rm\pi}c_{0}S_{0}^{2}}P_{i}\text{e}^{-\text{i}k(Mx_{1}-S_{0})/{\it\beta}^{2}}\text{e}^{\text{i}k(M-x_{1}/S_{0})h/{\it\beta}^{2}}(1-\text{i})\hspace{55.00008pt} & \displaystyle \nonumber\\ \displaystyle & \displaystyle \hspace{60.00009pt}\times \,\frac{\sin ((N+1/2){\it\lambda}(k_{2}-kx_{2}/S_{0}))}{\sin ((k_{2}-kx_{2}/S_{0}){\it\lambda}/2)}\mathop{\sum }_{n^{\prime }=-\infty }^{\infty }({\it\Theta}_{n^{\prime }}+{\it\Theta}_{n^{\prime }}^{(1)}+{\it\Theta}_{n^{\prime }}^{(2)}), & \displaystyle\end{eqnarray}$$
where
 ${\it\Theta}_{n^{\prime }}$
and
 ${\it\Theta}_{n^{\prime }}^{(1)}$
are defined in § 2, and
 $$\begin{eqnarray}\displaystyle {\it\Theta}_{n^{\prime }}^{(2)} & = & \displaystyle \mathop{\sum }_{m=-\infty }^{\infty }{\it\beta}_{n^{\prime }m}(\text{i}k_{1})^{2}(Q_{n^{\prime }n^{\prime }}-Q_{n^{\prime }m})\nonumber\\ \displaystyle & & \displaystyle -\,({\it\beta}_{n^{\prime }m}\sqrt{{\it\mu}_{m}}\text{i}k_{1}+{\it\gamma}_{n^{\prime }m}\sqrt{{\it\mu}_{m}}\text{i}(k_{1}-{\it\mu}_{m}))(S_{n^{\prime }n^{\prime }}-S_{n^{\prime }m})\nonumber\\ \displaystyle & & \displaystyle -\,{\it\gamma}_{n^{\prime }m}\sqrt{{\it\mu}_{m}}(T_{n^{\prime }n^{\prime }}-T_{n^{\prime }m}-\text{i}({\it\mu}_{n^{\prime }}-{\it\mu}_{m})S_{n^{\prime }n^{\prime }}/2).\end{eqnarray}$$