I. INTRODUCTION
Nanostructured materials have been attracting great attention because of their size and surface structure dependent properties.Reference Burda, Chen, Narayanan and El-Sayed1 These nanomaterials have a higher ratio of surface-to-interior atoms compared with their bulk counterparts. The local atomic environment of the surface atoms may be significantly different from that of the interior atoms, consequently yielding surface effects. For example, these surface atoms with unsaturated dangling bonds would interact with the surrounding environment. NaYF4:Yb,Er nanoparticles, one of the most efficient near infrared (NIR)-to-visible upconversion (UC) lanthanide-doped phosphors,Reference Menyuk, Dwight and Pierce2 has received growing interest because of its promising potential in bioimaging. These nanoparticles are rendered dispersible using common long-chain organic surfactants (e.g., oleylamine and oleic acid) to prevent aggregation. These surfactants, however, possess undesirably high vibrational energy functional groups (typically ∼1500 and ∼3000 cm−1)Reference Wang, Tu, Zhao, Sun, Kong and Zhang3 and may interact with the UC active surface ions, leading to undesirable nonradiative multiphonon losses.Reference Yuan, Yi and Chow4–Reference Heer, Kömpe, Güdel and Haase6 For example, a study of lanthanide-doped LaF3 and LaPO4 nanoparticles showed that the ligands on the nanoparticle surface from either the surfactant functional group or the surrounding solvents enhanced the nonradiative relaxation because of their high vibrational energy with respect to that of the host.Reference Stouwdam, Hebbink, Huskens and van Veggel7 It was reported that the surface of particles may significantly differ from the interior environment because of compositional segregation of dopant ions at the surface, resulting in significant change of optical properties.Reference Yuan, Yi and Chow4 A recent report demonstrated that the UC properties of the prism-, plate-, and rod-shaped NaYF4:Yb,Er nanoparticles were attributed to the surface-to-volume ratio and the particle shapes.Reference Shan, Uddi, Wei, Yao and Ju8 The relationship between luminescence decay time and the ratio of surface area-to-volume of the nanoparticles was reported.Reference Shan, Uddi, Wei, Yao and Ju8, Reference Lim, Ryu and Austin9 To minimize the nonradiative loss, the UC active surface ions of the particle core were passivated by surface coating of low phonon energy materials that are commonly undoped host materials.Reference Yi and Chow10, Reference Mai, Zhang, Sun and Yan11 The surface coating of undoped host on the UC core, referred to as undoped shell, provides a barrier to prevent undesired interactions between the UC active surface ions of the core and high phonon energy environment, thus leading to emission enhancement. However, our previous study showed that the emission intensity of UC core/undoped shell nanoparticles increased with increasing thickness of the undoped shell, which had no further enhancement when the thickness exceeded 3 nm.Reference Qian, Yuan, Yi and Chow5
Recently, hollow structures have gained growing interest because of the potential applications in drug delivery, catalyst, and photonic devices.Reference Li, Chu, Liu and Dong12–Reference Ding and Liu16 The hollow structures of UC nanoparticles may find combined use in bioimaging and drug-delivery applications. However, the hollow nanoparticles have even larger numbers of surface atoms due to both inner and outer surfaces, accentuating the surface-dependent properties. The hollow nanospheres are thermodynamically less stable compared with the solid nanospheres. Aging at high temperatures for sufficiently long time transformed the hollow nanospheres to solid nanospheres.Reference Tu and Gösele17 Templating approach, using for example mesoporous silica, polystyrene, and carbon sphere, is commonly adopted to synthesize hollow particles.Reference Li, Chu, Liu and Dong12, Reference Ren, Wang, Yang, Zhang, Yang, Yue, Gao and Tang18, Reference Wang, Angelatos and Caruso19 This approach, however, requires the core template material to be removed by etching with toxic chemicals (e.g., HF solution). The shell of the hollow structure could easily be damaged or contaminated during the core template removal. Successfully fabricated hollow structures may further require surface modification to prevent particle agglomeration. A soft templating method using nanosized water droplet in oil for formation of hollow structure has been recently reported. AlO(OH) hollow spheres with outer diameter of 30 nm and wall thickness of 5–6 nm were synthesized via such water-in-oil microemulsion.Reference Buchold and Feldmann20 The similar approach was also used to synthesize hollow silica nanospheres.Reference Lin, Wu, Tseng, Hung, Chang and Mou21 In recent reports, the hollow nanostructured particles were synthesized via Kirkendall effect.Reference Zhang, Shi, Sun, Zhao and Stucky22–Reference Wang, Cai and Xia28 The first Kirkendall effect was reported in 1942, and the result was confirmed in 1947.Reference Kirkendall29, Reference Smigelskas and Kirkendall30 The Kirkendall effect was first studied for the synthesis of hollow structures of cobalt sulfide nanoparticles from room temperature to 182 °C.Reference Yin, Rioux, Erdonmez, Hughes, Somorjai and Alivisatos24, Reference Yin, Erdonmez, Cabot, Hughes and Alivisatos25 The process of void formation was dominated by outward diffusion of cobalt cations and balanced by inward diffusion of vacancies. The small voids in each particle were observed between the cobalt core and sulfide shell due to condensation of vacancies at the boundary. These small voids were coalesced into bigger ones, followed by disappearance of the cobalt cores. Finally, a single void with some remaining filaments in the center of the cobalt sulfide nanoparticles was formed. The fabrications of hollow nanospheres via Ostwald ripening mechanism were recently reported for anatase TiO2, Sn doped TiO2, and CdS.Reference Yang and Zeng31–Reference Lin, Zheng and Xu33
Studies of spherical nanoparticles, nanorods, nanoplates, and prism-shaped particles of NaYF4:Yb,Er have been reported.Reference Shan, Uddi, Wei, Yao and Ju8, Reference Yi and Chow34–Reference Liu, Wang, Li and Chen37 More recently, hollow NaYF4:Yb,Er nanoparticles were fabricated from an assembled solid NaYF4:Yb,Er nanoparticle by electron-beam lithography.Reference Feng, Sun, Zhang and Yan38 Hollow NaYF4:Yb,Er nanoparticles with cubic phase were synthesized using a controlled ion-exchange process from cubic-phase Y2O3 nanospheres.Reference Zhang, Shi, Sun, Zhao and Stucky22 Formation of hollow structures of undoped and lanthanide ion doped NaYF4 nanocrystals were reported via the co-thermolysis of a mixture of trifluoroacetate precursors in trioctylphosphine oxide (TOPO).Reference Shan, Yao and Ju23 However, the surface effects of the hollow structures on the optical properties are not well understood.
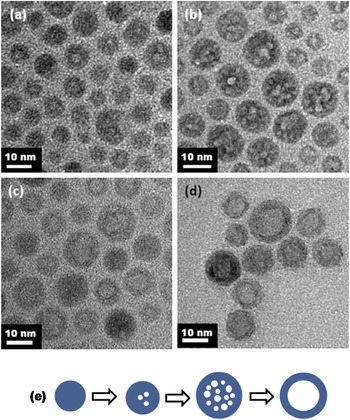
In this paper, we report the surface effects of the hollow structures of NaYF4:Yb,Er nanoparticles on the luminescence properties and an approach to enhance their UC emission intensities. The hexagonal close-packed (hcp) hollow NaYF4:Yb,Er nanoparticles were synthesized by thermal decomposition of trifluoroacetate precursors at 340 °C in trifluoroacetic acid–oleylamine-water system via vacancy diffusion, likely due to the Kirkendall effect and Ostwald ripening mechanism. Initially, small voids in the particles were formed at 300 °C. When temperature increased to 340 °C for 5 min, more small voids were observed in each particle. Eventually, a single large void was found, while the small voids disappeared after 10 min at 340 °C, thus leading to formation of hollow Yb:Er doped NaYF4 with hcp crystal structure. The shell thickness of the hollow ∼14 nm particles was ∼4 nm. To study their surface effects on the luminescence properties, the UC emission intensities of these hollow particles were compared with that of solid NaYF4:Yb,Er (∼15 nm in size) nanoparticles and solid NaYF4 core (∼10 nm in size)/NaYF4:Yb,Er shell (∼3 nm in thickness) nanoparticles prepared according to our previous work.Reference Yi and Chow10, Reference Yi and Chow34 Deposition of undoped NaYF4 thin layers (estimated ∼3 nm)Reference Qian, Yuan, Yi and Chow5 on both the inner and outer surfaces of the hollow NaYF4:Yb,Er nanoparticles showed an emission enhancement compared with the hollow NaYF4:Yb,Er and solid NaYF4:Yb,Er nanoparticles.
II. EXPERIMENTAL SECTION
A. Materials
All chemicals were purchased from Sigma-Aldrich (St. Louis, MO, USA) without further purification. Oleylamine and trifluoroacetatic acid were 70% and 99% purity, respectively. Trifluoroacetate salts [(CF3COO)3M, M = Y, Yb, Er ions] were prepared by dissolving their hydroxides in trifluoroacetic acid (CF3COOH), followed by drying in oven. Sodium trifluoroacetate (CF3COONa) was prepared by dissolving sodium carbonate (Na2CO3) in trifluoroacetic acid.
B. Synthesis of hollow NaYF4:Yb,Er nanoparticles
In the synthesis of hollow NaYF4:Yb,Er nanoparticles, 20 mL of oleylamine was reacted with 3 mL of trifluoroacetic acid. (CF3COO)3Y (0.488 mmol), (CF3COO)3Yb (0.125 mmol), (CF3COO)3Er (0.013 mmol), and CF3COONa (1.252 mmol) were then added and followed by deionized water under vigorous stirring at 60 °C for 5 min. This mixture was heated to 340 °C under refluxing condition and presence of Ar gas for protection from oxidation. After 30 min, the mixture was allowed to cool to 80 °C. The nanoparticles were isolated by centrifugation and washing and were redispersed in hexane for transmission electron microscopy (TEM), dynamic light scattering (DLS), and optical spectroscopy and ethanol for x-ray diffraction (XRD). The nanoparticles were washed six times with ethanol and dried at 80 °C in an oven overnight before thermal gravimetric analysis (TGA) and differential thermal analysis (DTA) measurements. To investigate the mechanism of hollow structure formation, samples were collected at 300 °C, 5 min at 340 °C, 10 min at 340 °C, and 30 min at 340 °C for XRD and TEM experiments.
C. Synthesis of hcp solid NaYF4:Yb,Er and solid NaYF4 core/NaYF4:Yb,Er shell nanoparticles
The solid NaYF4:Yb,Er and solid NaYF4 core/NaYF4:Yb,Er shell nanoparticles were prepared using our reported methods.Reference Yi and Chow10, Reference Yi and Chow34 For the synthesis of NaYF4 core/NaYF4:Yb,Er shell nanoparticles, undoped NaYF4 core was coated by NaYF4:Yb,Er shell.
D. Synthesis of hollow NaYF4/NaYF4:Yb,Er shell/NaYF4 shell nanoparticles
Hollow undoped NaYF4 nanoparticles were first synthesized using the synthesis method of hollow NaYF4:Yb,Er nanoparticles (Sec. II. B). The hollow NaYF4/NaYF4:Yb,Er shell/NaYF4 shell nanoparticles were prepared by coating the hollow undoped NaYF4 nanoparticles with Yb,Er doped NaYF4 shell, followed by undoped NaYF4 shell.Reference Qian, Yuan, Yi and Chow5
E. Characterization
The microstructures of the nanoparticles were studied using a JEOL JEM 3010 transmission electron microscope (JEOL, Tokyo, Japan) operated at 300 kV. The crystal structures were investigated using powder XRD diffractometer system (Cu Kα radiation) (Bruker AXS, Karlsruhe, Germany). The particle size distribution was measured using a Malvern Zetasizer Nano ZEN3600 (Malvern Instruments, Worcestershire, UK). The upconversion fluorescence spectra were measured using a LS-55 luminescence spectrometer (Perkin Elmer Instruments, Cambridge, UK) with an external 980 nm laser diode (0.5 W, continuous wave with 1 m fiber, Beijing Viasho Technology Co., Beijing, China) as the excitation source in place of the xenon lamp in the spectrometer. The spectrometer was operated in the bioluminescence mode, with a gate time of 1 ms, delay time of 10 ms, cycle of 20 ms, and a flash count of 1. The upconversion fluorescence photographs were taken using a Canon Powershot A620 camera (Canon, Tokyo, Japan). The thermally induced weight loss and the melting point of nanoparticles were obtained using a thermal gravimetric analyzer SDT Q600 (TA Instruments, New Castle, DE, USA). X-ray photoelectron spectroscopy (XPS) analysis was performed using Kratos Axis Ultra DLD (Kratos analytical, Manchester, UK) with a monochromated Al Ka source (1486.6 eV). The XPS measurement was repeated three times for each sample. The relative ionic concentrations were calculated through the ratios of integrated peak areas modified by respective sensitivity factors.
III. RESULTS AND DISCUSSION
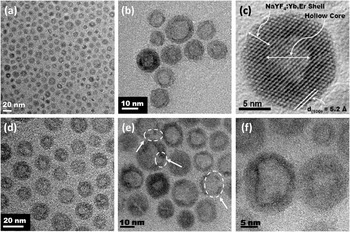
Figure 1 shows the TEM images of the as-synthesized hollow NaYF4:Yb,Er nanoparticles collected at different magnifications. The image [Fig. 1(c)] of hollow NaYF4:Yb,Er nanoparticles at higher magnification shows notably different contrasts between the center (light) and the periphery (dark) of equiaxed nanoparticles. The light contrast in the center was caused by the lack of diffraction contrasts due to the absence of the inorganic materials, whereas the dark contrast at the periphery of the particles was caused by the NaYF4:Yb,Er shell. These results confirmed the formation of hollow nanoparticles. The NaYF4:Yb,Er shell showed good crystallinity as indicated by the (100) lattice fringes (d 100 = 0.52 nm) [Fig. 1(c)]. The arrows in Fig. 1(e) show the discontinuity in contrast at the periphery, suggesting that some of these shells were partially fractured because of the stress buildup during the growth, similar to the previous report.Reference Yin, Erdonmez, Cabot, Hughes and Alivisatos25
(a) to (f) are transmission electron microscopy (TEM) images of hollow NaYF4:Yb,Er nanoparticles showing a low mass density at the center (light contrast) and UC shell (dark contrast) of the hollow particles. These TEM images were collected at different magnifications from 50,000 to 400,000×.

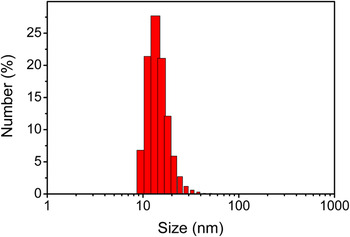
The average particle size, estimated by random measurements of ∼100 particles from TEM images, was found to be 14 ± 3 nm. The shell thickness was 4 ± 1 nm, whereas the hollow diameter was 7 ± 2 nm. The hydrodynamic diameter measured by DLS was ∼15.1 nm (Appendix Fig. A1), consistent with the TEM data of the size of the hollow particles. This result also confirmed that the hollow particles were well dispersed.
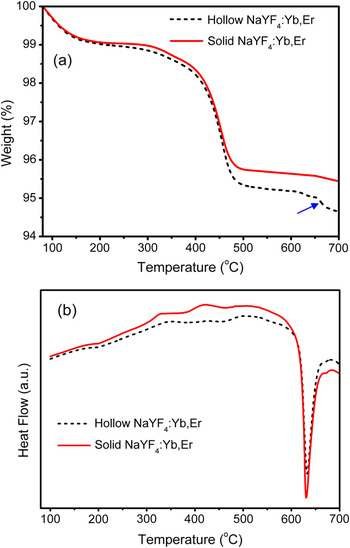
The TGA curve of the hollow NaYF4:Yb,Er nanoparticles was compared with that of the solid NaYF4:Yb,Er (∼15 nm) nanoparticles [Appendix Fig. A2(a)]. From 80 to 160 °C, the weight loss could be associated with the moisture desorption from the nanoparticles. From ∼300 to ∼450 °C, the weight loss could be attributed to the decomposition of oleylamine attracted at the surface of nanoparticles. However, above 450 °C, a significant weight loss occurred in hollow NaYF4:Yb,Er when compared with the solid NaYF4:Yb,Er nanoparticles. This could be attributed to the decomposition of oleylamine trapped inside the hollow particles with fractured shell. Both hollow and solid NaYF4:Yb,Er nanoparticles melted at ∼630 °C [Appendix Fig. A2(b)]. For the solid UC particles, the TGA curve almost flattened around their melting temperature. However, for the hollow UC particles, there was a noticeable weight loss at ∼654 °C [indicated by an arrow in Appendix Fig. A2(a)]. At this temperature, the melting of the UC shell allowed the release of organics or water trapped in the hollow center to escape. These results indicated that the organics or water from the reaction may be trapped inside the hollow nanoparticles during the synthesis process. These trapped organics or water would provide an environment with high phonon energy. The effects of this high phonon energy environment on the emission intensity of the hollow nanoparticles is discussed in detail.
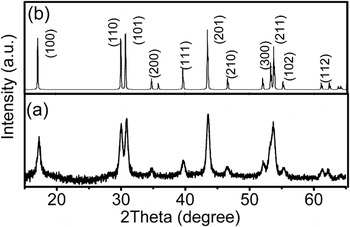
The crystal structure of the hollow particles was confirmed to be hcp as shown in XRD spectra [Fig. 2(a)], compared with the standard pattern of hcp sodium yttrium fluoride [Joint Committee on Powder Diffraction Standards (JCPDS) file number PDF 16-334] [Fig. 2(b)].
(a) XRD pattern of the hollow NaYF4:Yb,Er nanoparticles as synthesized matched well with (b) the standard pattern of hcp sodium yttrium fluoride [Na(Y1.5)Na0.5F6] [Joint Committee on Powder Diffraction Standards (JCPDS) file number PDF 16-334].

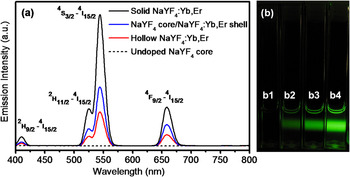
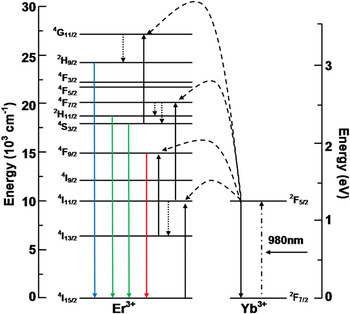
Figure 3(a) shows the upconversion fluorescence spectra normalized by the mass of UC active NaYF4:Yb,Er. Four emission peaks in the upconversion spectra of hollow NaYF4:Yb,Er, NaYF4 core/NaYF4:Yb,Er shell, and solid NaYF4:Yb,Er (∼15 nm), 410 (blue), 522.5 (green), 541.5 (green), and 655 nm (red) were attributed to the 2H9/2–4I15/2, 2H11/2–4I15/2, 4S3/2–4I15/2, and 4F9/2–4I15/2 transitions of Er3+, respectively (Fig. 4). As expected, there was no emission for undoped NaYF4 core [Figs. 3(a) and 3(b)]. The emission intensity decreased in the order of (solid NaYF4:Yb,Er) → (solid NaYF4 core/NaYF4:Yb,Er shell) → (hollow NaYF4:Yb,Er), as shown in Figs. 3(a) and 3(b). The total emission intensities of hollow NaYF4:Yb,Er and solid NaYF4 core/NaYF4:Yb,Er shell nanoparticles decreased by 73% and 53% compared with that of solid NaYF4:Yb,Er nanoparticles (∼15 nm), respectively.
The UC mass-normalized emission intensities of upconversion nanoparticles. The nanoparticles were dispersed in hexane and excited using 980 nm NIR irradiation. (a) Room-temperature upconversion fluorescence spectra and (b) photographs of the upconversion fluorescence of nanoparticles, from left to right are (b1) undoped NaYF4 core showing no upconversion, (b2) hollow NaYF4:Yb,Er (∼14 nm), (b3) NaYF4 core/NaYF4:Yb,Er shell, and (b4) solid NaYF4:Yb,Er (∼15 nm) nanoparticles. For the NaYF4 core/NaYF4:Yb,Er shell nanoparticles, the undoped NaYF4 core and NaYF4:Yb,Er shell were ∼10 and ∼3 nm, respectively.

A schematic energy-level diagram of Yb3+ and Er3+ ions and the upconversion mechanisms under 980 nm excitation. The dashed-dotted, dashed, and dotted lines represent photon excitation, energy transfer, and multiphonon relaxation, respectively. The blue, green, and red solid lines indicate the blue, green, and red emissions, respectively.

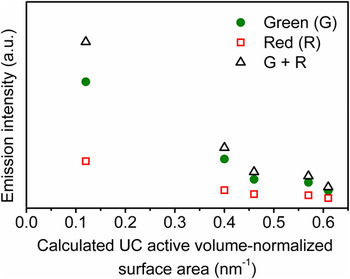
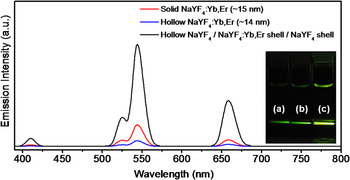
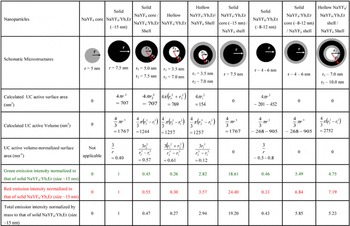
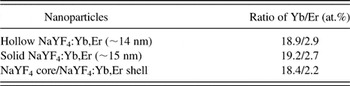
Assuming a spherical microstructure, the UC active surface area and the UC active volume-normalized surface area of the four different microstructures (with their respective emission intensities shown in Fig. 3) were calculated (Appendix Table AI). The UC active volume is defined as the effective volume of the NaYF4 with Yb and Er dopant ions. The UC active surface area is referred to as the surface of the NaYF4 with Yb and Er dopant ions that directly interacts with high phonon energy environment (e.g., oleylamine and hexane). By this definition, the UC active volume and UC active surface area of the undoped NaYF4 core are zero. In our estimations, the interface area between the doped shell (∼3 nm) and the solid undoped core (∼10 nm) in NaYF4 core/NaYF4:Yb,Er shell nanoparticles was ignored. Here undoped core provided a protective interior environment against undesirable nonradiative loss, compared with the hollow core that might contain trapped organic materials from the reactions. The UC active volume-normalized surface area is an indication of the ratio of UC active surface-to-bulk atoms. The green, red, and total emission intensities decreased in the order of (solid NaYF4:Yb,Er) → (solid NaYF4 core/NaYF4:Yb,Er shell) → (hollow NaYF4:Yb,Er). For the hollow NaYF4:Yb,Er, the green, red, and total emission intensities were 26%, 30%, and 27% of those of the solid NaYF4:Yb,Er (∼15 nm) nanoparticles, respectively. The emission intensities of solid NaYF4 core/NaYF4:Yb,Er shell nanoparticles normalized to that of solid NaYF4:Yb,Er (∼15 nm) nanoparticles were 45%, 55%, and 47% for green, red, and total emission intensities, respectively. In this study, these nanoparticles were stabilized using the same surfactant (oleylamine) and dispersed in hexane. Therefore, the significant decrease of emission intensity from solid to hollow NaYF4:Yb,Er nanoparticles could not be associated with the surfactants and solvents. The compositional analysis measured by XPS (Appendix Table AII) shows that the composition ratios of Yb and Er ions of the solid NaYF4:Yb,Er (∼15 nm), solid NaYF4 core/NaYF4:Yb,Er shell, and hollow NaYF4:Yb,Er nanoparticles were similar. Therefore, the significant differences of their emission intensities could not be attributed to the different concentration of Yb and Er ions. Among the four microstructures (Fig. 3), the solid NaYF4:Yb,Er nanoparticles showed the highest emission intensity since these particles contained fewer surface atoms (thus fewer defects) leading to undesirable phonon relaxations. The hollow particles had the highest UC active volume-normalized surface area. The contents trapped inside the hollow particles, possibly oleylamine, water, and other organics from precipitation, would provide an environment with high phonon energy compared with that of the UC shell surrounding the undoped solid NaYF4 core (low phonon energy material) in the solid NaYF4 core/NaYF4:Yb,Er shell nanoparticles. This explains the decrease of the emission intensity of hollow NaYF4:Yb,Er compared with solid NaYF4 core/NaYF4:Yb,Er shell. The relation between the emission intensity and the UC active volume-normalized surface area for different microstructures of UC nanoparticles (Appendix Table AI) was demonstrated in Fig. 5, showing the decrease of the green, red, and total emission intensities with increasing UC active volume-normalized surface area. The surface atoms may interact with high-phonon energy environment, leading to an increase of nonradiative loss that competes with radiative transfer process.Reference Wang, Tu, Zhao, Sun, Kong and Zhang3–Reference Qian, Yuan, Yi and Chow5, Reference Shan, Uddi, Wei, Yao and Ju8, Reference Lim, Ryu and Austin9 Further, the larger local disorder at the surface and surface compositional segregation of the lanthanide dopants may enhance the nonradiative loss mechanisms.Reference Yuan, Yi and Chow4 It has recently been shown that capping the UC active doped NaYF4 with a low phonon energy undoped NaYF4 shell provided an alternative to prevent such undesirable nonradiative loss and enhanced the emission intensity.Reference Qian, Yuan, Yi and Chow5, Reference Yi and Chow34 There appeared, however, a critical thickness of the undoped shell beyond which no further emission enhancement can be observed.Reference Qian, Yuan, Yi and Chow5 The surface coatings of undoped NaYF4 (thickness of ∼3 nm, following the method in Ref. 5) on both the inner and outer surfaces of the hollow NaYF4:Yb,Er nanoparticles increased the total emission intensity by ∼19 times of that of the hollow NaYF4:Yb,Er nanoparticles, and ∼5 times of that of solid NaYF4:Yb,Er (∼15 nm) nanoparticles (Fig. 6). The hollow particles after the inner and outer surface coatings are denoted as hollow NaYF4/NaYF4;Yb,Er shell/NaYF4 shell in Fig. 6.
Relation between the emission intensities and the UC active volume-normalized surface area for various hollow and solid microstructures of UC nanoparticles (Appendix Table AI). The legends of green (G), red (R), and (G + R) indicate the green light, red light, and total emissions, respectively. The measurements of the emission intensities were normalized using the same mass of UC active NaYF4:Yb,Er for the UC active samples dispersed in hexane and excited using 980 nm NIR irradiation. The UC active volume-normalized surface area of the nanoparticles was calculated from the diameter sizes (Appendix Table AI).

Room-temperature upconversion fluorescence spectra and photographs of the upconversion fluorescence of the nanoparticles (bottom inset), (a) hollow NaYF4:Yb,Er, (b) solid NaYF4:Yb,Er (∼15 nm), and (c) hollow NaYF4/NaYF4:Yb,Er shell/NaYF4 shell (referred to as the hollow NaYF4:Yb,Er nanoparticles after the inner and outer surface coatings with undoped NaYF4). The measurements were normalized by using the same mass of UC active NaYF4:Yb,Er for the UC active samples dispersed in hexane and excited using 980 nm NIR irradiation.

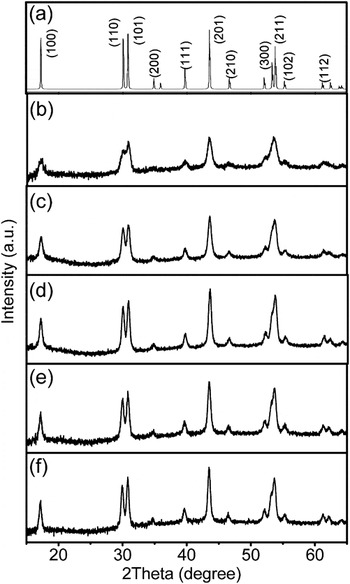
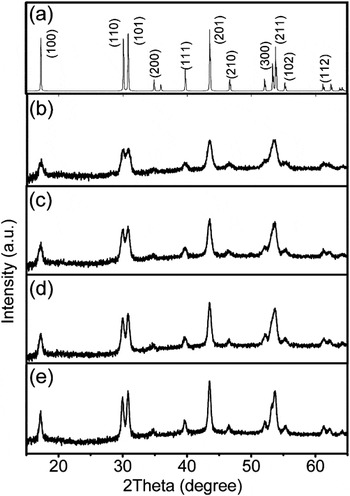
The dependence of crystal structures and microstructures on temperature and time of reaction were investigated to understand the formation mechanism of the hollow NaYF4:Yb,Er nanoparticles. The samples of hollow NaYF4:Yb,Er samples were collected at different temperatures from 300 to 340 °C and times from 5 to 30 min at 340 °C for XRD analysis (Appendix Fig. A3). The XRD patterns of all the samples matched with hcp sodium yttrium fluoride [Na(Y1.5)Na0.5F6] (JCPDS file number PDF 16-334). The intensity increased in order of the samples collected at 300, 320, and 340 °C (after 5 min) [Appendix Figs. A3(b), A3(c), and A3(d)], indicating the crystallinity of the particles increased with increasing temperature of reaction. There was no noticeable difference in the intensity among the samples obtained at 5, 10, and 30 min at 340 °C [Appendix Figs. A3(d), A3(e), and A3(f)]. The XRD patterns for the hollow nanoparticles synthesized with fixed reaction time of 30 min at different temperatures, from 280 to 340 °C, further confirmed the crystallinity increased with temperature (Appendix Fig. A4). These results indicate that the formation of hollow particles could initiate at temperature as low as 280 °C, the temperature at which the precursor of lanthanide trifluoroacetate salts started to decompose.Reference Yi and Chow34, Reference Zhang, Sun, Si, You and Yan39–Reference Yoshimura and Ohara41 The microstructures of hollow nanoparticles during the synthesis process were investigated through TEM images (Appendix Fig. A5). Initially, small solid core particles were observed, and simultaneously small voids were already formed in some particles when the temperature reached 300 °C [Appendix Fig. A5(a)]. After 5 min at 340 °C, more voids in each particle were observed and the solid cores disappeared [Appendix Fig. A5(b)]. These voids appeared to start coalescing with each other. The small voids are thermodynamically less stable than the big voids. Eventually, a single large void in each particle was found, whereas the small voids disappeared after 10 min at 340 °C [Appendix Fig. A5(c)]. The gradual coalescence of small voids into big single ones was previously reported in formation of hollow cobalt sulfide nanocrystals through Kirkendall effect.Reference Yin, Erdonmez, Cabot, Hughes and Alivisatos25 The hollow nanoparticles showed little differences in microstructure after 30 min at 340 °C [Appendix Fig. A5(d)] compared with that of 10 min at 340 °C.
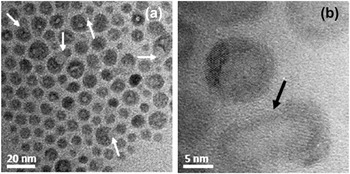
Ostwald ripening mechanism was observed for the sample collected at 300 °C [Appendix Figs. A6(a) and A6(b)], suggesting this mechanism also contributed to the growth of the hollow particles. In this mechanism, the small particles with high surface energy dissolved into the bigger ones, thus lowering the surface energy of the system. According to our results, the formation of hollow nanoparticles involved the vacancy diffusion, likely due to the Kirkendall effect and Ostwald ripening mechanism.
IV. SUMMARY
Hollow NaYF4:Yb,Er nanoparticles with hcp crystal structure were successfully synthesized using thermal decomposition of trifluoroacetate precursors at 340 °C via vacancy diffusion, likely induced by the Kirkendall effect and Ostwald ripening mechanism. The hollow diameter and UC shell thickness were ∼7 nm and ∼4 nm, respectively. The total emission intensity of the hollow doped particles significantly decreased when compared with that of the solid ones (∼15 nm) because the hollow particles had higher UC active volume-normalized surface area. Investigation of the different microstructures of the hollow and solid nanoparticles confirmed the green, red, and total emission intensities decreased with increasing the UC active volume-normalized surface area. The surface coatings of undoped NaYF4 (thickness of ∼3 nm) on both the inner and outer surfaces of the hollow NaYF4:Yb,Er nanoparticles led to emission enhancement to ∼19 and ∼5 times compared with that of the hollow NaYF4:Yb,Er and the solid NaYF4:Yb,Er (∼15 nm) nanoparticles, respectively.
ACKNOWLEDGMENTS
Karvianto acknowledges the support of the NUS research scholarship. We thank D. Yuan, L.P. Qian, and Dr. Daniel Chua for helpful technical discussions. G.M. Chow thanks the support of this work by FoE (FB) NUS research fund and the grant from the Office of Naval Research, USA.
APPENDIX
The calculation of UC active surface area and UC active volume-normalized surface area for different microstructures of upconversion nanoparticles and their emission intensities normalized by UC mass to that of solid NaYF4:Yb,Er nanoparticles (size ∼15 nm). The undoped NaYF4 shells were estimated to be ∼3 nm.

The compositional analysis of Y, Yb, and Er ions of the nanoparticles measured by x-ray photoelectron spectroscopy (XPS).

The particle size distribution of hollow NaYF4:Yb,Er nanoparticles in hexane was measured using DLS. The average hydrodynamic diameter was ∼15.1 nm.

(a) Thermal gravimetric analysis (TGA) curve of hollow and solid NaYF4:Yb,Er nanoparticles. The nanoparticles were washed six times using ethanol to remove the surfactants at the surface of the nanoparticles and dried at 80 °C in oven overnight before the TGA measurement. (b) Differential thermal analysis (DTA) curve of hollow and solid NaYF4:Yb,Er nanoparticles. The endothermic peaks at ∼630 °C corresponded to their melting point.

XRD patterns of (a) hcp sodium yttrium fluoride [Na(Y1.5)Na0.5F6] (JCPDS file number PDF 16-334) and the samples of hollow NaYF4:Yb,Er nanoparticles collected during the reaction at (b) 300 °C, (c) 320 °C, (d) 5 min at 340 °C, (e) 10 min at 340 °C, and (f) 30 min at 340 °C. The intensity increases in order of (b) to (d) indicating the crystallinity increases. From (d) to (f), there was no noticeable difference in the intensity.

XRD patterns of (a) hcp sodium yttrium fluoride [Na(Y1.5)Na0.5F6] (JCPDS file number PDF 16-334) and the hollow NaYF4:Yb,Er nanoparticles obtained after 30 min reaction at (b) 280 °C, (c) 300 °C, (d) 320 °C, and (e) 340 °C.

TEM images of samples obtained at different temperatures and times of reaction: (a) at 300 °C, (b) 5 min at 340 °C, (c) 10 min at 340 °C, and (d) 30 min at 340 °C. (e) The illustration of the formation of hollow NaYF4:Yb,Er nanoparticles according to the TEM images (a) to (d).

TEM images of samples obtained at 300 °C. (a) and (b) show the Ostwald ripening mechanism (arrow signs) was observed in the sample collected at 300 °C.