




No CrossRef data available.
Article contents
Quantitative and qualitative analyses of clock drawing in frontotemporal dementia and Alzheimer's disease
Published online by Cambridge University Press: 22 March 2006
Abstract
The clock drawing test (CDT) is a widely used cognitive screening test. It is useful in identifying focal lesions and cognitive deficits in dementia groups. Lately, several studies attempted its use to differentiate between dementia subtypes. Although many studies have examined the CDT in dementia populations, research into the use of clock drawing in frontotemporal dementia (FTD) is limited. We examined quantitative (global) and qualitative (specific error type) differences on the CDT between FTD (n = 36) and Alzheimer's disease (AD; n = 25) patients and controls without dementia (n = 25). Results showed significantly lower overall scores in the dementia groups compared to the control group, whereas FTD patients scored significantly higher than the AD group. On qualitative analysis, the FTD group had fewer stimulus bound responses, conceptual deficits, and spatial or planning errors compared to the AD group. In conclusion, both global and error analysis of the CDT helped discriminate the FTD group from controls and AD patients. (JINS, 2006, 12, 159–165.)
Keywords
Information
- Type
- Research Article
- Information
- Journal of the International Neuropsychological Society , Volume 12 , Issue 2 , March 2006 , pp. 159 - 165
- Copyright
- © 2006 The International Neuropsychological Society
INTRODUCTION
The clock drawing test (CDT) is a widely used clinical measure to screen for dementia (Wolf-Klein et al., 1989; Dastoor et al., 1991; Kirk & Kertesz, 1991; Huntzinger et al., 1992; Libon et al., 1993; Shulman et al., 1993). It is a quick (less than two minutes) and easy test to administer. It is well tolerated by patients and straightforward to score, giving results that are relatively independent of culture and language (Shulman, 2000). Even though there are many scoring systems for the clock with differing instructions and emphases, the mean sensitivity and specificity for dementia were estimated by Shulman to be high at 85% for both. The CDT is usually performed correctly in individuals without cognitive impairment and is sensitive to cognitive changes in those with dementia (Freedman et al., 1994; Rouleau et al., 1996; Shulman, 2000). The CDT gives clinicians information about the level of planning, numerical and visual memory, comprehension, graphomotor ability, and visuospatial and constructive skills of patients (Freedman et al., 1994; Shulman, 2000; Kremer, 2002). It has been shown to discriminate individuals without dementia from dementia populations (Sunderland et al., 1989; Wolf-Klein et al., 1989; Mendez et al., 1992; Tuokko et al., 1992; Esteban-Santillan et al., 1998). It also has discriminative power among various dementia populations, discriminating Alzheimer's disease (AD) from dementia with Lewy bodies and Parkinson's disease (Cahn-Weiner et al., 2003), vascular dementia (VAD; Kitabayashi et al., 2001), and Huntington's disease (HD; Rouleau et al., 1992).
Frontotemporal dementia (FTD) has a probable prevalence of 12.5% of autopsied degenerative dementia cases (Brun, 1987). A recent study by Knopman et al. (2005) reported a lower estimate of 7.9%. The clinical syndromes of FTD accepted by various consensus groups (Neary et al., 1998; McKhann et al., 2001) are the behavioral variant (FTD-bv), progressive nonfluent aphasia (PNFA), and semantic dementia (SD). Patients with FTD have relatively preserved episodic memory with prominent deficits in behavior and language, which distinguishes them from AD. Behavioral changes and executive dysfunction or both are characteristic of FTD-bv; logopenia, agrammatism, effortful, and nonfluent speech are typical of PNFA (Mesulam, 1987), whereas comprehension deficits, loss of word and object meaning, and semantic paraphasias define SD (Snowden et al., 1989; Hodges et al., 1992). The clinical evolution and sharing of underlying pathological features are in favor of an overlapping cohesive complex (Kertesz & Munoz, 1998; Kertesz et al., 2005) and these conditions rarely if ever remain pure during the natural evolution of the illness. These clinical syndromes contrast with AD, where episodic memory loss is the primary deficit followed in the early stages by some degree of executive, visuospatial, and semantic impairment (Hodges & Patterson, 1995; Perry & Hodges, 1999).
Although many studies have investigated various clock drawing tasks in dementia populations, research into the use of clock drawing in FTD is limited (Kremer, 2002). Moretti et al. (2002) showed that FTD patients had similar scores to VAD patients, but higher scores than AD patients on a 10-point scoring system. Rating was confined to overall CDT scores rather than detailed error analysis among the groups. Rascovsky et al. (2002) found that pathologically confirmed FTD patients (3 with Pick body pathology and 11 with Dementia Lacking Distinctive Histology) scored higher than AD patients on the CDT, but again, only overall differences were examined. Because clock drawing is a complex task, requiring various cognitive skills, detailed error analysis may reveal cognitive changes reflecting different dementias (Kitabayashi et al., 2001). For example, Rouleau et al. (1992) found no overall difference between patients diagnosed with AD and HD on the command condition of the CDT. However, on qualitative error analysis, important distinctions became evident in graphic difficulties, conceptual errors, perseveration, and stimulus-bound responses. Additional research by Cahn-Weiner et al. (2003) and Heinik et al. (2000) has shown that qualitative differences emerge between dementia groups when no disparity was found overall.
The aim of our study therefore, was to examine both overall and error differences among clock drawings provided by FTD and AD patients, as well as individuals without dementia. We hypothesized that the early preservation of visuospatial skills in FTD patients (Elfgren et al., 1994; Rascovsky et al., 2002; Kertesz et al., 2003) would yield higher scores in the spatial layout of the clock in these groups compared to the AD group. The AD group was expected to have significantly more difficulty on conceptual aspects of the task, as reported previously (Rouleau et al., 1992, 1996). We only examined the command condition of the CDT in this pilot study, which has been shown to be a more sensitive and cognitively demanding measure compared to the copy condition (Freedman et al., 1994).
METHOD
Research Participants
We analyzed clocks drawn by older individuals without dementia (n = 25) and patients diagnosed with FTD (n = 36) and AD (n = 25). The FTD group was composed of FTD-bv (n = 18), PNFA (n = 13), and SD (n = 5) patients. All study participants were seen in our clinic between 2003, when CDT according to the Rouleau et al. (1992) system became a regular part of clinical assessment, and early 2005 (see Table 1). The AD patients all met the criteria for probable Alzheimer's disease according to the National Institute of Neurological and Communicative Disorders and Stroke and the Alzheimer's Disease and Related Disorders Association (NINCDS-ADRDA; McKhann et al., 1984). The FTD sample fulfilled the Neary et al. (1998) and McKhann et al. (2001) criteria. The positive predictive value on autopsy based on the McKhann et al. (1984) and Neary et al. (1998) criteria have been shown to be greater than 80% (Bowler et al., 1998; Kertesz et al., 2005). The PNFA group included patients who were anomic, logopenic, and nonfluent. The SD group was diagnosed by the presence of a prominent comprehension deficit, naming difficulty, and asking the meaning of nouns and objects. All FTD patients were placed into FTD-bv, SD, and PNFA groups based on syndromes at the onset of illness. From the history provided at consultation, 15 patients in the FTD-bv group had a behavioral syndrome at onset, 2 had dysexecutive problems observed around the home and at work, and 1 had a combination of both behavioral and dysexecutive symptoms at onset. At the time of the CDT, 3 FTD-bv patients had began to develop symptoms of progressive aphasia (PA), 2 had features of SD, and 1 had signs of motor neuron disease. Of the 5 SD patients, 3 had developed behavioral changes by the time of testing.
Demographic characteristics, cognitive test results, and overall CDT scores of participants

FTD patients with extrapyramidal disorders, such as corticobasal degeneration syndrome (CBDS) and progressive supranuclear palsy (PSP) that would interfere with their ability to perform the CDT, were excluded. This only resulted in the exclusion of two patients. One patient had FTD-bv as a primary syndrome with secondary and tertiary syndromes of CBDS and PA, respectively. The other patient had PNFA as a primary syndrome and PSP as the secondary syndrome.
The exclusion criteria for all patients included metabolic causes of dementia, history of drug abuse, alcohol dependence, serious psychiatric condition, neurological disorder such as stroke or closed head injury, a current major depressive episode, psychosis, acute mania, and bipolar disorder. Imaging was conducted on all patients to exclude other causes of dementia such as stroke or tumor. However, imaging was not used as a confirmatory diagnostic measure; diagnosis was based on the prior mentioned clinical criteria.
Control data was obtained from the accompanying caregivers of patients. The control group was selected to match the FTD groups in age and education. The inclusion criteria for controls consisted of no history of memory problems, age and education-adjusted scale score of nine or higher (normal range) on the second edition of the dementia rating scale (DRS-2; Jurica et al., 2001); and Mini-Mental State Examination (MMSE; Folstein et al., 1975) scores above age and education adjusted cut-off scores (Crum et al., 1993).
Procedures
After receiving a pencil and a blank sheet of paper, participants were told, “I would like you to draw a clock, put in all the numbers, and set the hands for 10 after 11.” The drawings were analyzed by two judges (WD and NB) who were blinded to the diagnosis and identity of each individual in our study. The judges followed the quantitative (overall) scoring system, set out by Rouleau et al. (1992), with a maximum of 10 points. It was designed to examine the clock face (maximum, 2 points), layout of numbers (maximum, 4 points), and the position of the hands (maximum, 4 points). The average score of the raters was used in the analysis. Qualitative error scoring was done according to six error types also employed by Rouleau et al.: (1) clock sizes that are either large (greater than 12.7 cm) or small (less than 3.81 cm); (2) graphic difficulties such as distortions in the clock face, hands or a general clumsy performance; (3) stimulus-bound responses that are either pure (also known as the “frontal pull” response), where the hands are set to 10 to 11 instead of 10 after 11; or other types of stimulus bound responses that are also rated as conceptual errors, such as the time written on the clock, absent hands or hands pointed to 10 or 11; (4) conceptual deficits that include misrepresentation of the time, such as the hands are absent or inadequately displayed; or misrepresentation of the clock face, such as a clock without numbers or the inappropriate use of numbers; (5) spatial or planning deficits that include neglect of the left half of the clock, gaps between numbers, numbers outside the clock, and counterclockwise layout of numbers; and (6) perseveration of hands or numbers. A qualitative error was considered present only if both judges agreed on its presence. The judges reviewed each clock independently and in a random order. Using a two-way random effects model based on consistency, the interrater reliability intraclass correlation coefficient of the average rater for overall scores was .95 (.92–.96), p < .001. Cohen's kappa measure of agreement between the raters on qualitative measures ranged from fair to excellent (.49–.8). The Cohen's kappa value and standard error for qualitative measures were as follows: clock size (.54 ± .12), graphic difficulty (.49 ± .1), stimulus-bound responses (.73 ± .08), conceptual deficits (.66 ± .08), spatial or planning deficits (.59 ± .09), and perseveration (.8 ± .11). All participants were administered the DRS-2 except for 4/36 FTD and 5/25 AD patients, whereas all received the MMSE. Time pressure during clinic visits resulted in the missing DRS-2 data.
Statistical Analyses
A multivariate analysis of variance (MANOVA) was conducted to assess age, education, MMSE, and DRS-2 scores among the groups. Tukey-Kramer post hoc comparisons were done. A t test was performed to examine duration of illness differences between the dementia groups. Gender differences among the groups were analyzed using the chi-square test. An analysis of covariance (ANCOVA) was performed to examine overall CDT scores among the control, FTD, and AD groups using age and education as covariates. Post hoc tests were conducted with a Bonferroni adjustment. Chi-square tests were performed to analyze qualitative error frequencies among the groups. A logistic regression analysis was utilized to discriminate AD patients from the FTD group based on CDT measures.
All statistical analyses were performed using the Statistical Package for the Social Sciences (SPSS version 10.1 for Windows, Chicago, IL, USA) and all hypotheses were tested at alpha level of .05 (2-tailed).
RESULTS
Demographic and Cognitive Test Results for Groups
Table 1 shows demographic characteristics and cognitive test results of the groups. A MANOVA showed a significant difference between the groups in demographic variables [Pillai's Trace = 1.03, F(8,146) = 19.41, p < .001]. Age was significantly different among the groups, F(2,75) = 33.72, p < .001. On Tukey-Kramer post hoc analysis, the AD group was significantly older than the FTD, p < .001, and control groups, p < .001. No difference in age was found between the control and FTD groups, p = .92. There were no significant differences among the groups in education, F(2,75) = 1.82, p = .17. MMSE scores were significantly different among the groups, F(2,75) = 34.76, p < .001. On Tukey-Kramer post hoc analysis, the control group had significantly higher MMSE scores compared to the FTD, p < .001, and AD groups, p < .001. The FTD group had significantly higher MMSE scores than the AD group, p = .04. DRS-2 scores were significantly different among the groups, F(2,75) = 27.46, p < .001, with higher scores in the control group compared to the FTD, p < .001, and AD groups, p < .001, on Tukey-Kramer post hoc analysis. There was no significant difference in total DRS-2 scores between the dementia groups, p = 1. An independent samples t test showed that the time from onset of illness to testing (represented as duration of illness in Table 1) was similar between the dementia groups, t(58) = .77, p = .45. Chi-square analysis showed no significant gender differences among the groups, χ2(2, N = 86) = .86, p = .65.
Overall and Error Analysis of CDT comparing Control, AD, and FTD groups
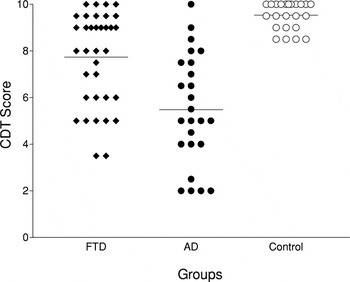
Figure 1 shows the quantitative CDT scores for the groups. An ANCOVA covarying for age and education showed a significant difference in overall scores among the groups, F(2,80) = 19.97, p < .001 (see Table 1). Post hoc analysis with a Bonferroni adjustment showed that the control group had significantly higher scores than the FTD, p < .001, and AD groups, p < .001. The adjusted means for the control, FTD, and AD groups were 9.6 (SE = .38), 7.62 (SE = .33), and 5.53 (SE = .48), respectively. The FTD group had significantly higher scores than the AD group, p < .01. A second ANCOVA comparing the dementia groups covarying for severity of dementia as measured by the MMSE in addition to age and education still showed significantly higher overall scores in the FTD group compared to the AD patients, p < .047.

Mean and individual data points of quantitative scores among the FTD (n = 36), AD (n = 25), and control (n = 25) groups.
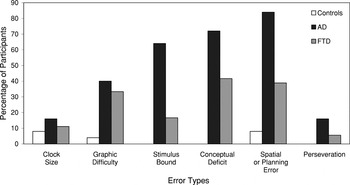
Figure 2 shows the percentage of different errors types committed by the groups. On qualitative error analysis using the chi-square test, the groups differed significantly in graphic, χ2(2, N = 86) = 9.64, p < .01, stimulus bound, χ2(2, N = 86) = 29.48, p < .001, conceptual, χ2(2, N = 86) = 27.69, p < .001, and spatial or planning errors, χ2(2, N = 86) = 29.89, p < .001. Comparisons between the dementia groups showed significantly fewer errors in stimulus bound responses, p < .001, conceptual deficits, p = .02, and spatial or planning errors, p < .001, in FTD patients compared to the AD group. Subanalysis of stimulus-bound responses showed significantly fewer errors in the FTD group compared to the AD group in “frontal pull”, p = .04, and stimulus bound responses that are also rated as conceptual errors, p < .01. Subanalysis of conceptual errors showed significantly fewer errors in misrepresentation of time, p = .02, in FTD patients compared to the AD group. No difference in misrepresentation of clock face was found between the groups, p = .34. Subanalysis of spatial or planning errors showed significantly more errors in the spatial layout of numbers, p < .01, and numbers outside the clock, p = .03, in AD patients compared to the FTD group. There was no difference between the groups in neglect of the left hemisphere, gaps before 12, 3, 6, and 9, and numbers arranged counter-clockwise, p > .05.

Percentage of control individuals (n = 25) and FTD (n = 36) and AD (n = 25) patients making different kinds of qualitative errors.
The control group made significantly less errors in graphic difficulty, p < .05, fewer stimulus-bound responses, p < .05, conceptual deficits, p < .05, and spatial or planning errors compared to both FTD and AD patients. The AD group also made more perseverative errors compared to the control group, p = .04.
A logistic regression analysis was performed to discriminate AD patients from the FTD group. The analysis was done with a diagnosis of FTD or AD as the categorical dependent variable and overall scores, stimulus-bound responses, conceptual deficits, and spatial or planning errors as predictor variables. The model was significant, χ2(4, N = 61) = 26.18, p < .001, accounting for between 34.9% and 47% of the variance in discriminating FTD from AD patients. The model correctly classified 88.9% of FTD patients and 76% of AD patients with an overall prediction accuracy of 83.6%.
DISCUSSION
Consistent with previous studies investigating the CDT (Moretti et al., 2002; Rascovsky et al., 2002), the FTD group has higher overall scores on the CDT compared to the AD group. Qualitative error analysis shows that the FTD group has fewer visuospatial deficits, particularly in the spatial layout of numbers. Previous studies (Elfgren et al., 1994; Rascovsky et al., 2002) have shown better performance in FTD patients compared to AD patients on visuospatial abilities, but this is the first study to show such deficits in the context of the clock drawing task. Compared to the FTD group, the AD group has more conceptual deficits and stimulus-bound errors most consistent with a conceptual deficit. Rouleau et al. (1992, 1996) suggested that this increased occurrence of conceptual deficits in AD patients is due to a loss of semantic association evoked by the word “clock.”
The finding of increased errors on visuospatial aspects of the clock in the AD group compared to FTD patients was expected because memory function is necessary for the accurate recall of the visuospatial aspects of a clock (Freedman et al., 1994). However, Rouleau et al. (1992) found that AD patients show a vast improvement in the copy condition of the CDT where perceptual ability, not intact recall, is an essential component. The command condition examined in our study requires language skills to comprehend verbal instructions, and memory and conceptualization for the visual layout of a clock and the various time settings, making it more demanding than the copy condition (Freedman et al., 1994). The command condition is not only sensitive to parietal lobe damage, reflected by visuospatial deficits, but also to deficits in language, semantic, and memory processes in the temporal lobe, and executive functioning in the frontal lobe. As a result, the command condition is the most widely used administrative procedure of the CDT. This is in contrast to two other options, namely, placing various time settings in partially completed clocks with numbers and circular boundaries or copying visually presented clocks, already completed. Rouleau et al. (1996) showed that the command condition was most sensitive to change, which was evidenced by a steeper decline over three annual sessions compared to the copy condition. Given sufficient time, patients could complete all three forms of CDT because they each have a different emphasis, despite the considerable overlap in cognitive resources required (Freedman et al., 1994). However, the command condition places greater reliance on conceptualization and visual memory, which is more difficult and impaired in AD patients than other groups, perhaps adding to the diagnostic value of this format in dementia.
Compared to the FTD group, the AD group had more errors in what is considered executive function errors, specifically, the “frontal pull” response, despite some research showing greater executive impairment in FTD compared to AD patients (Pachana et al., 1996). Executive deficit depends on the measures used and it is very sensitive to aging and to all dementing processes. Both AD and FTD groups have a degree of executive deficit but the extent and contribution of this to clock drawing needs to be explored further. The Royall et al. (1998) “CLOX” format uses specific instruction to identify dysexecutive errors that may be useful for this purpose. The “frontal pull” response is consistently referred to as an error of executive function in the clock drawing literature (Freedman et al., 1994). However, we believe that in addition to an executive error, the “frontal pull” response can be indicative of a comprehension deficit, for example, as a conceptual misunderstanding of the time instruction of “10 after 11” for “10 to 11.” Rouleau et al. (1992) also alluded to the “frontal pull” response as a grammatical error or a momentary lapse of attention. Cosentino et al. (2004) failed to find significant correlations between qualitative error deficits on the command condition of CDT and executive and semantic test indices. They used a qualitative scoring system comparable to the Rouleau et al. (1992) version to compare AD and VAD patients. They suggested that discrepant findings in previous studies focusing on the CDT as strict measures of executive dysfunction (Royall et al., 1998) or semantic deficits (Libon et al., 1993, 1996) are most likely due to the multiple cognitive resources utilized in this task. Their results suggest that deficits in executive control and semantic knowledge can have similar effects on the command condition of the CDT. To a certain extent, Rouleau et al. recognize the overlapping cognitive skills needed to perform the CDT and stipulate that certain errors be scored simultaneously in different categories. Their qualitative error scoring system requires that instances where the time is written on the clock and hands are absent or pointed to 10 or 11 be scored as both stimulus-bound and conceptual errors.
Our results suggest better-preserved visuospatial skills and conceptual abilities on the CDT in patients presenting with cognitive presentations of FTD compared to AD patients after adjusting for age, education, and dementia severity. The regression analysis correctly classified 88.9% of FTD patients and 76% of AD patients. Although the MMSE and DRS-2 are generally used to assess severity in dementia, these measures are heavily language dependent. Despite the ability of the CDT to discriminate FTD and AD patients, there is much overlap between these groups. Similar to other brief cognitive screens, the CDT should not be used in isolation. However, it is an effective tool to utilize in combination with other measures to aid diagnosis. Analysis of FTD subtypes should be the priority for future research in this area. This was not done in our study due to the small sample sizes. Moreover, an understanding of changes in the clock drawing profiles of different FTD subgroups over time is likely to yield valuable information regarding the cognitive profile of FTD as the disease progresses.
References
REFERENCES
Brun, A.
(1987).
Frontal lobe degeneration of non-Alzheimer type. I.
Neuropathology.
Archives of Gerontology and Geriatrics,
6,
193–208.Google Scholar
Bowler, J.V.,
Munoz, D.G.,
Merskey, H., &
Hachinski, V.
(1998).
Fallacies in the pathological confirmation of the diagnosis of
Alzheimer's disease.
Journal of Neurology, Neurosurgery and Psychiatry,
64,
18–24.Google Scholar
Cahn-Weiner, D.A.,
Williams, K.,
Grace, J.,
Tremont, G.,
Westervelt, H., &
Stern, R.A.
(2003).
Discrimination of dementia with lewy bodies from Alzheimer disease
and Parkinson disease using the clock drawing test.
Cognitive and Behavioral Neurology,
16,
85–92.Google Scholar
Cosentino, S.,
Jefferson, A.,
Chute, D.L.,
Kaplan, E., &
Libon, D.L.
(2004).
Clock drawing errors in dementia: Neuropsychological and
neuroanatomical considerations.
Cognitive and Behavioral Neurology,
17,
74–84.Google Scholar
Crum, R.M.,
Anthony, J.C.,
Bassett, S.S., &
Folstein, M.F.
(1993).
Population-based norms for the mini-mental state examination by age
and educational level.
Journal of the American Medical Association,
269,
2386–2391.Google Scholar
Dastoor, D.,
Schwartz, G., &
Kurtzman, D.
(1991).
Clock drawing: An assessment technique in dementia.
Journal of Clinical and Experimental Gerontology,
13,
69–85.Google Scholar
Elfgren, C.,
Brun, A.,
Gustafson, L.,
Johanson, A.,
Minthon, L.,
Passant, U., &
Risberg, J.
(1994).
Neuropsychological tests as discriminators between dementia of
Alzheimer's type and frontotemporal dementia.
International Journal of Geriatric Psychiatry,
9,
635–642.Google Scholar
Esteban-Santillan, C.,
Praditsuwan, R.,
Ueda, H., &
Geldmacher, D.S.
(1998).
Clock drawing test in very mild Alzheimer's disease.
Journal of the American Geriatrics Society,
46,
1266–1269.Google Scholar
Folstein, M.F.,
Folstein, S.E., &
McHugh, P.R.
(1975).
Mini-mental state: A practical method for grading the cognitive
state of patients for the clinician.
Journal of Psychiatric Research,
12,
189–198.CrossRefGoogle Scholar
Freedman, M.,
Leach, L.,
Kaplan, E.,
Shulman, K.I., &
Delis, D.C.
(1994).
Clock drawing: A neuropsychological analysis.
New York:
Oxford University Press.
Heinik, J.,
Lahav, D.,
Drummer, D.,
Vainer-Benajah, Z., &
Lin, R.
(2000).
Comparison of a clock drawing test in elderly schizophrenia and
Alzheimer's disease patients: A preliminary study.
International Journal of Geriatric Psychiatry,
15,
638–643.Google Scholar
Hodges, J.R. &
Patterson, K.
(1995).
Is semantic memory consistently impaired early in the course of
Alzheimer's disease? Neuroanatomical and diagnostic
implications. Neuropsychologia
33,
441–459.Google Scholar
Hodges, J.R.,
Patterson, K.,
Oxbury, S., &
Funnell, E.
(1992).
Semantic dementia: Progressive fluent aphasia with temporal lobe
atrophy.
Brain,
115,
1783–1806.Google Scholar
Huntzinger, J.A.,
Rosse, R.B.,
Schwartz, B.L.,
Ross, L.A., &
Deutsch, S.I.
(1992).
Clock drawing in the screening assessment of cognitive impairment in
an ambulatory care setting: A preliminary report.
General Hospital Psychiatry,
14,
142–144.Google Scholar
Jurica, P.J.,
Leitten, C.L., &
Mattis, S.
(2001).
Dementia rating scale-2.
Lutz, FL.:
Psychological Assessment Resources.
Kertesz, A.,
Davidson, W.,
McCabe, P.,
Takagi, K., &
Munoz, D.
(2003).
Primary progressive aphasia: Diagnosis, varieties, evolution.
Journal of the International Neuropsychological Society,
9,
710–719.Google Scholar
Kertesz, A.,
McMonagle, P.,
Blair, M.,
Davidson, W., &
Munoz, D.G.
(2005).
The evolution and pathology of frontotemporal dementia.
Brain,
128,
1996–2005.Google Scholar
Kertesz, A. &
Munoz, D.G.
(1998).
Pick's disease and Pick complex.
New York:
Wiley-Liss.
Kirk, A. &
Kertesz, A.
(1991).
On drawing impairment in Alzheimer's disease.
Archives of Neurology,
48,
73–77.Google Scholar
Kitabayashi, Y.,
Ueda, H.,
Narumoto, J.,
Nakamura, K.,
Kita, H., &
Fukui, K.
(2001).
Qualitative analyses of clock drawings in Alzheimer's disease
and vascular dementia.
Psychiatry and Clinical Neurosciences,
55,
485–491.Google Scholar
Knopman, D.S.,
Boeve, B.F.,
Parisi, J.E.,
Dickson, D.W.,
Smith, G.E.,
Ivnik, R.J.,
Josephs, K.A., &
Petersen, R.C.
(2005).
Antemortem diagnosis of frontotemporal lobar degeneration.
Annals of Neurology,
57,
480–488.Google Scholar
Kremer, R.
(2002).
Clock drawing test in dementia: A critical review.
Revista Neurológica Argentina,
27,
223–227.Google Scholar
Libon, D.J.,
Malamut, B.L.,
Swenson, R.,
Sands, L.P., &
Cloud, B.S.
(1996).
Further analysis of clock drawing among demented and nondemented
older subjects.
Archives of Clinical Neuropsychology,
11,
193–205.Google Scholar
Libon, D.J.,
Swenson, R.A.,
Barnoski, E.J., &
Sands, L.P.
(1993).
Clock drawing as an assessment tool for dementia.
Archives of Clinical Neuropsychology,
8,
405–415.Google Scholar
McKhann, G.M.,
Albert, M.S.,
Grossman, M.,
Miller, B.,
Dickson, D., &
Trojanowski, J.Q.
(2001).
Clinical and pathological diagnosis of frontotemporal
dementia.
Archives of Neurology,
58,
1803–1809.Google Scholar
McKhann, G.,
Drachman, D.,
Folstein, M.,
Katzman, R.,
Price, D., &
Stadlan, E.M.
(1984).
Clinical diagnosis of Alzheimer's disease: Report of
NINCDS-ADRDA Work Group under auspices of Department of Health and Human
Services Task Force on Alzheimer's Disease.
Neurology,
34,
939–944.Google Scholar
Mendez, M.F.,
Ala, T., &
Underwood, K.L.
(1992).
Development of scoring criteria for the clock drawing task in
Alzheimer's disease.
Journal of the American Geriatrics Society,
40,
1095–1099.Google Scholar
Mesulam, M.M.
(1987).
Primary progressive aphasia—Differentiation from
Alzheimer's disease.
Annals of Neurology,
22,
533–534.Google Scholar
Moretti, R.,
Torre, P.,
Rodolfo, M.A.,
Giuseppe, C., &
Bava, A.
(2002).
Ten-point clock test: A correlation analysis with other
neuropsychological tests in dementia.
International Journal of Geriatric Psychiatry,
17,
347–353.CrossRefGoogle Scholar
Neary, D.,
Snowden, J.S.,
Gustafson, L.,
Passant, U.,
Stuss, D.,
Black, S.,
Freedman, M.,
Kertesz, A.,
Robert, P.H.,
Albert, M.,
Boone, K.,
Miller, B.L.,
Cummings, J., &
Benson, D.F.
(1998).
Frontotemporal lobar degeneration—A consensus on clinical
diagnostic criteria.
Neurology,
51,
1546–1554.Google Scholar
Pachana, N.A.,
Boone, K.B,
Miller, B.L.,
Cummings, J.L., &
Berman, N.
(1996).
Comparison of neuropsychological functioning in Alzheimer's
disease and frontotemporal dementia.
Journal of the International Neuropsychological Society,
2,
505–510.Google Scholar
Perry, R.J. &
Hodges, J.R.
(1999).
Attention and executive deficits in Alzheimer's disease.
Brain,
122,
383–404.Google Scholar
Rascovsky, K.,
Salmon, D.P.,
Ho, G.J.,
Galasko, D.,
Peavy, G.M.,
Hansen, L.A., &
Thal, L.J.
(2002).
Cognitive profiles differ in autopsy-confirmed frontotemporal
dementia and AD.
Neurology,
58,
1801–1808.Google Scholar
Rouleau, I.,
Salmon, D.P., &
Butters, N.
(1996).
Longitudinal analysis of clock drawing in Alzheimer's disease
patients.
Brain and Cognition,
31,
17–34.Google Scholar
Rouleau, I.,
Salmon, D.P.,
Butters, N.,
Kennedy, C., &
McGuire, K.
(1992).
Quantitative and qualitative analyses of clock drawings in
Alzheimer's and Huntington's disease.
Brain and Cognition,
18,
70–87.Google Scholar
Royall, D.R.,
Cordes, J.A., &
Polk, M.
(1998).
CLOX: An executive clock drawing task.
Journal of Neurology, Neurosurgery and Psychiatry,
64,
588–594.Google Scholar
Shulman, K.I.
(2000).
Clock-drawing: Is it the ideal cognitive screening test?
International Journal of Geriatric Psychiatry,
15,
548–561.Google Scholar
Shulman, K.I.,
Gold, D.,
Cohen, C., &
Zucchero, C.
(1993).
Clock-drawing and dementia in the community: A longitudinal
study.
International Journal of Geriatric Psychiatry,
8,
487–496.Google Scholar
Snowden, J.S.,
Goulding, P.J., &
Neary, D.
(1989).
Semantic dementia: A form of circumscribed cerebral atrophy.
Behavioural Neurology,
2,
167–182.Google Scholar
Sunderland, T.,
Hill, J.L.,
Mellow, A.M.,
Lawlor, B.A.,
Gundersheimer, J.,
Newhouse, P.A., &
Grafman, J.H.
(1989).
Clock drawing in Alzheimer's disease: A novel measure of
dementia severity.
Journal of the American Geriatrics Society,
37,
725–729.Google Scholar
Tuokko, H.,
Hadjistavropoulos, T.,
Miller, J.A., &
Beattie, B.L.
(1992).
The clock test: A sensitive measure to differentiate normal elderly
from those with Alzheimer disease.
Journal of the American Geriatrics Society,
40,
579–584.Google Scholar
Wolf-Klein, G.P.,
Silverstone, F.A.,
Levy, A.P., &
Brod, M.S.
(1989).
Screening for Alzheimer's disease by clock drawing.
Journal of the American Geriatrics Society,
37,
730–773.Google Scholar

Demographic characteristics, cognitive test results, and overall CDT scores of participants
Mean and individual data points of quantitative scores among the FTD (n = 36), AD (n = 25), and control (n = 25) groups.
Percentage of control individuals (n = 25) and FTD (n = 36) and AD (n = 25) patients making different kinds of qualitative errors.
 You have
Access
- 50
- Cited by