Introduction
The need to develop effective procedures to detect and document resistance to pesticides for the successful implementation of resistance management strategies is well recognised (Dennehy & Granett, Reference Dennehy and Granett1984b; Roush & Miller, Reference Roush and Miller1986; Brewer & Trumble, Reference Brewer and Trumble1991). Despite such recognition, few publications discuss sampling methodology or sample size requirements for effective resistance monitoring programmes of insects and mites. The earliest reports that discuss the collection of insects for resistance monitoring (Anonymous, 1968, 1970, 1972) failed to mention the sample sizes required for detection/estimation of resistance. Roush & Miller (Reference Roush and Miller1986) showed that using a perfectly discriminating dose (which would categorize an individual either resistant or susceptible), the detection of at least one resistant individual at very low frequencies (≤0.1%) requires samples in the thousands and for resistance levels of 1% and 10%, sample sizes of approximately 298 and 50, respectively, are needed. They also determined that when the test technique is not perfectly diagnostic and an LD99 (or similar lethal dose) is used, the sample sizes required to detect resistance increased.
Surprisingly, no or little emphasis has been placed on the method by which insects and mites are sampled which appears to be more haphazard (Tabashnik et al., Reference Tabashnik, Cushing and Johnson1987; Ffrench-Constant & Roush, Reference Ffrench-Constant, Roush, Roush and Tabashnik1990; Knight et al., Reference Knight, Beers, Hoyt and Riedl1990; Tian et al., Reference Tian, Grafton-Cardwell and Granett1992; Follett et al., Reference Follett, Gould and Kennedy1993; Forrester et al., Reference Forrester, Matthew, Lisa and Jacquelyn1993; Ahmad et al., Reference Ahmad, Arif and Ahmad1995; Unruh et al., Reference Unruh, Knight and Bush1996; Perez & Shelton, Reference Perez and Shelton1997). Venette et al. (Reference Venette, Moon and Hutchison2002) stated that when individuals were particularly rare, hundreds if not thousands of sample units must be examined to have a significant chance of finding at least one individual. Sensitivity of a sampling program depends on sample size and on the techniques/technologies used to collect and process a sample.
Dispersion of resistant individuals
Several factors, including insect migration patterns (e.g. between treated and untreated habitats) and insecticide-use history, may result in subpopulations (or a patchy distribution) of insects within a field with various levels of susceptibility to insecticides (Follett et al., Reference Follett, Croft and Westigard1985; Brewer & Trumble, Reference Brewer and Trumble1991; Croft & Dunley, Reference Croft, Dunley, Kim and McPheron1993; Vencill & Zehnder, Reference Vencill and Zehnder1993; Hollingsworth et al., Reference Hollingsworth, Tabashnik, Ullman, Johnson and Messing1994). Other factors, like gradual reversion of resistance in the absence of selection pressure and individuals of a species with multiple resistance, could contribute to the over dispersion of resistant individuals. If resistance development in a pest population at a location is a recent phenomenon, as reported by Heim et al. (Reference Heim, Kennedy and VanDuyan1990) for North Carolina populations of Leptinotarsa decemlineata (Chrysomelidae: Coleoptera), large variations in susceptibility would be expected as resistant foci could be widely separated. The selective mortality of homozygous resistant (RR), homozygous susceptible (SS) and heterozygous (S♂R♀ and R♂S♀) individuals after insecticide treatments could help concentrate the resistant individuals in certain areas (Shah et al., unpublished data). Dennehy & Granett (Reference Dennehy and Granett1984a) also concluded that resistance is often localized.
Clearly, the dispersion pattern of most insect pests where insecticide resistance has become a problem tends to be patchy. Documented examples are spider mites (Mowery et al., Reference Mowery, Hull and Asquith1980; Chen et al., Reference Chen, Tanigoshi and Long1989), L. decemlineata (Martel et al., Reference Martel, Belcourt, Choquette and Boivin1986; French et al., Reference French, Follett, Nault and Kennedy1993), aphids (Rai et al., Reference Rai, Rai, Singh and Nath1989) and diamondback moth (Chen & Su, Reference Chen and Su1986; Sivapragasam et al., Reference Sivapragasam, Ito, Saito and Iwao1986; Srinivasan & Rao, Reference Srinivasan and Rao1987), etc. This patchiness in the overall population of a pest species increases the over dispersion chances of resistant individuals.
Resistance monitoring (detection and documentation/measurement)
A resistance detection programme is usually aimed at detecting resistant individuals before any resistance management strategy is employed. It is desirable to detect resistance at much lower phenotypic frequencies, but 1% is considered to be practical limit in most cases (Roush & Miller, Reference Roush and Miller1986). Resistance documentation would attempt to get an estimate of the entire resistant population, and such a sample size should be used which would contain ≥90% of resistant individuals with a probability of 0.95. Thus, a representative estimate of the resistance frequency present in a particular area at a particular time could be achieved.
After initial detection, systematic monitoring (documentation) can reveal subsequent changes (if any) in the frequency, degree of resistance, its geographical distribution (Brent, Reference Brent and Glass1986), and to determine if a management programme is effective (Zhao & Grafius, Reference Zhao and Grafius1993). Therefore, development of methodology for documenting changes in susceptibility of populations (Roush & Miller, Reference Roush and Miller1986) and determining the degree to which such changes impair the performance of chemicals under commercial application conditions (Davies, Reference Davies1984; Denholm et al., Reference Denholm, Sawicki and Farnham1984; Chen et al., Reference Chen, Zhong, Zhang, Shi and Zhou2010) are essential steps in the development of resistance management programmes.
More attention needs to be paid to the selection of a sample size and a sampling plan that could correctly measure population frequencies of resistant individuals present in an area. Therefore, different sample sizes must be used for resistance detection and documentation. For resistance monitoring (detection and documentation), the influence of different sampling methods on the precision and reliability of bioassay results has not been compared. Neither has the influence of dispersion pattern of resistant individuals on sampling outcome been investigated.
In this computer simulation study, the effect of random and patchy dispersion patterns of resistant individuals on sample size requirements and the efficiency of sampling plans for insecticide resistance monitoring are investigated. Random and systematic sampling plans are compared for relative efficiency and the sample sizes required to detect at least one (≥1) resistant individual (resistance detection) and to detect ≥90% of the resistant individuals (resistance documentation) with a probability of 0.95 present in a particular area/field.
Materials and methods
A sampling simulator was designed and programmed in Microsoft FORTRAN 4.1 (Miscrosoft, 1987). A computer based data matrix of 100×1000 cells was used to simulate a sampling grid of 100,000 individuals; each cell of the matrix was represented by a single sampling unit (for example, a single individual selected from a single leaf). Resistant individuals were represented by assigning individuals a value of 1. Susceptible individuals were represented by 0. No hybrids were included in this simulation. Resistant individuals could be perfectly distinguished from the susceptible individuals. Resistant individuals were allocated either randomly throughout the matrix (using a random number function to select the coordinates of the cells) or in a patchy (contagious) distribution. Where a contagious distribution was used, patches were positioned randomly in the data matrix, and the number of resistant individuals allocated to each patch was determined using a log-normal distribution function. For a sampling simulation, simple random and systematic sampling plans were compared. The percentage (frequency) of resistant individuals used in the simulations were 1%, 10% and 20% (1000, 10,000 and 20,000 individuals, respectively). In most cases, 1% is considered to be practical limit for resistance detection (Roush & Miller, Reference Roush and Miller1986) whereas 10% and 20% could be used as a critical frequency and action threshold, respectively (Dennehy & Granett, Reference Dennehy and Granett1984b). For each of the aforementioned resistance frequencies, different dispersion patterns were used. These varied from no patch (randomly distributed resistant individuals) through 50, 30, 20, 10 and 5 patches to 2 (highly patchy) patches of resistant individuals. As the number of patches decreases (i.e. from 50 to 2 patches), the index of patchiness (I) (Pedigo & Buntin, Reference Pedigo and Buntin1994) increases and the degree of patchiness increases.
For every specified combination of resistance frequency, dispersion pattern and sampling plan, the sampling simulation was repeated 100 times using the same matrix or grid. Three sets of data for these combinations were generated with three different grids. Different sample sizes were compared for each combination of resistance frequency, dispersion pattern and sampling plan. For random sampling, the sampling programme selected each cell based on co-ordinates obtained using a random number generator. For systematic sampling, cells were selected systematically starting from a single randomly selected cell. Thereafter, every nth cell was selected as the next sample unit where the size of n was based on the sample size and calculated in such a way to distribute the sample points throughout the matrix. In this way, every sample point had an equal chance of being selected (at least initially). The number of resistant (1 s) and susceptible (0 s) individuals were recorded by the programme for each simulation for further processing. For the 100 simulation replicates, the probability of resistance detection, the minimum and maximum values detected, standard deviations, standard errors, 95% confidence intervals and Lloyd's index of patchiness (I) were calculated. Theoretical probabilities of detection were calculated following Snedecor & Cochran (Reference Snedecor and Cochran1967). The probability of detecting at least one resistant individual, P(x≥1), is [1–P(x=0)], where P(x=0) is the probability of not detecting a resistant individual, and P(x=0)=(1–f)n, where f is the frequency of resistant individuals and n is the sample size.
The theoretical probability of detecting ≥90% of resistant individuals in a population was calculated using estimates from the cumulative binomial probability distribution function using Minitab (version 9). Data were analysed by ANOVA (Minitab, 1994), and correlations were performed using Spearman rank correlation.
Results
Effect of degree of patchiness
Resistance detection (detection of at least one (≥1) resistant individual)
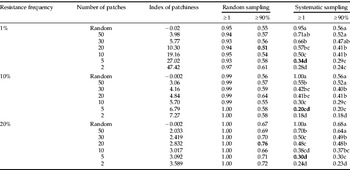
The effect of an increase in the degree of patchiness (described by the index of patchiness, I) of resistant individuals on the probability of detecting at least one resistant individual, P(x≥1), with a perfectly diagnostic dose, is shown in table 1. When samples were taken randomly, the increase in I did not significantly affect the probability of detection using sample sizes of 300 and 50 (the recommended sample sizes to detect ≥1 resistant individual (Roush & Miller, Reference Roush and Miller1986)) for resistance frequencies of 1% and above 10%, respectively. However, when samples were taken systematically, using the same sample sizes, the probability of detection decreased significantly (P<0.001) as the index of dispersion increased and the relationship was highly negatively correlated (r s=−0.94, −0.79 and −0.88 for resistance frequencies of 1%, 10% and 20%, respectively). For example, using the recommended sample sizes of 300 and 50, there is only a 34%, 20% and 30% chance of detecting ≥1 resistant individual present at resistance frequencies of 1%, 10% and 20%, respectively, when resistant individuals were clumped into five patches.
Effect of degree of patchiness of resistant individuals on the probability of resistance detection and documentation using the sample sizes of 300 (for resistance frequency of 1%) and 50 (for resistance frequency of 10% and above).

Resistance documentation (detection of ≥90% of the resistant individuals)
The effect of an increase in the degree of patchiness of resistant individuals on probability of detecting ≥90% of resistant individuals, with a perfectly diagnostic dose, is also shown in table 1. For random sampling using the sample sizes (300 for 1% resistance frequency and 50 for 10% resistance frequency and above), probability of detection of ≥90% of resistant individuals was not significantly affected by the changes in the value of I. However, probability of detection ranged from only 0.51–0.76 for any of the resistance frequencies investigated (0.51–0.61 for resistance frequency of 1%; 0.55–0.64 for 10% and 0.66–0.76 for 20%). Systematic sampling showed the same trend as that for detecting ≥1 resistant individual and there was a significant (P<0.001) decrease in probability of detection of ≥90% of resistant individuals; probability decreased with the increase in the value of I (r s=−0.93, −0.79 and −0.88).
Sample sizes required for resistance detection
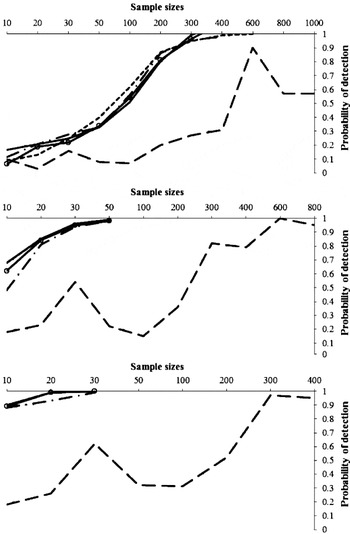
When resistant individuals are randomly dispersed and randomly sampled, the sample sizes needed to detect at least one (≥1) resistant individual present within a resistance frequency of 1%, 10% and 20% with 0.95 probability were similar to the theoretical values. The lines for the theoretical sample sizes required and those obtained from simulations overlap each other so that a sample size of 300 (for 1%) and 50 (for 10% and 20%) would detect ≥1 resistant individual with a probability of 0.95 (fig. 1). Systematic sampling gave similar results when resistant individuals were randomly dispersed. The outcome of the two sampling plans differed greatly when resistant individuals were aggregated. For example, when sampling systematically and when resistance frequencies were 1%, 10% and 20%, simulations showed that there was only a 27%, 22% and 32% chance, respectively, of detecting ≥1 resistant individual using sample size of 300 and 50, while there is 95% chance of detecting ≥1 resistant individual using a random sample of the same size. To obtain the same efficiency as a random sample, a systematic sample of 6000, 600 and 300 is required to detect ≥1 of resistant individual present at resistance frequency of 1%, 10% and 20%, respectively, with a probability of 0.95. In general, to detect ≥1 of resistant individuals with systematic sampling when resistant individuals are patchily distributed, there seems to be a trend of approximately a two-fold increase in sample size required for resistance detection with every percentage increase in the frequency of resistant individuals. Furthermore, for systematic sampling, a 20-fold increase occurs in the sample sizes required to detect ≥1 of resistant individual over the theoretical sample sizes when the resistant individuals were patchily distributed.
Sample sizes necessary to detect at least one (≥1) resistant individual(s) in random or patchy disperson pattern present at a resistance frequency of 1%, 10% and 20% ( , Random sampling Random dispersion;
 , Random sampling Patchy dispersion;
 , Systematic sampling Random dispersion;
 , Systematic sampling Patchy dispersion;
 , Theoretical).

Sample sizes required for resistance documentation
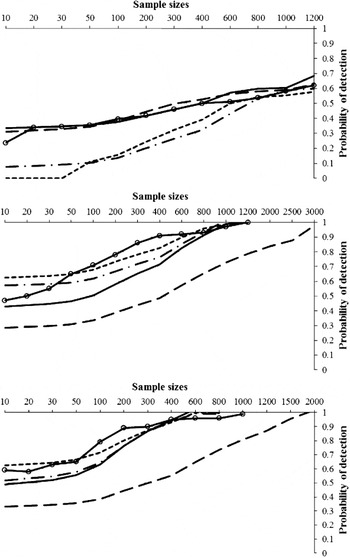
To obtain a representative estimate of resistance severity (frequency) present in an area with 0.95 probability (to detect ≥90% of the resistant individuals in a sample), much larger sample sizes are required. The theoretical probability of detecting ≥90% of the resistant individuals using a sample size of 1000 at the resistance frequency of 1% is only 0.58. Our simulation using random and systematic sampling when resistant individuals are randomly dispersed gave 0.60% and 0.58% probability, respectively (fig. 2). The simulations showed that to detect ≥90% of the resistant individuals at the resistance frequency of 1% with a probability of 0.95 would require a sample size of 20,000; whereas, a sample size of 900 and 400 would detect ≥90% of resistant individuals randomly dispersed at the higher frequencies of 10% and 20%, respectively, with 0.95 probability sampled either randomly or systematically. The theoretical sample sizes required are the same (900 and 400, respectively) for both frequencies. For systematic samples, sample sizes of 3000 and 1500 are necessary to detect ≥90% of the resistant individuals with 0.95 probability if they are patchily distributed, approximately three times the sample size required for random sampling.
Sample sizes necessary to document (≥90%) resistant individuals in random or patchy disperson pattern present at a resistance frequency of 1%, 10% and 20% (, Random sampling Random dispersion; , Random sampling Patchy dispersion; , Systematic sampling Random dispersion; , Systematic sampling Patchy dispersion; , Theoretical).

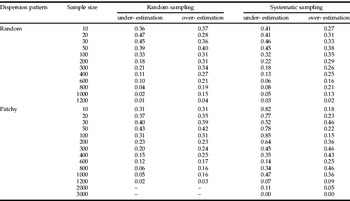
The probabilities that resistance frequency was either underestimated or overestimated from an acceptable limit of ±10% of the true resistance frequency are given in table 2. Small sample sizes either underestimated or overestimated the resistance frequency for both random and systematic sampling. Much higher probabilities of such incorrect estimation were observed for systematic sampling when the dispersion pattern of resistant individuals was patchy.
Sample sizes and associated probabilities of under- and over-estimation at resistance frequency of 10%.

Discussion
There are many reasons to suspect that resistant individuals could be patchily distributed throughout a region, or even in a field (Follett et al., Reference Follett, Croft and Westigard1985; Brewer & Trumble, Reference Brewer and Trumble1991; Croft & Dunley, Reference Croft, Dunley, Kim and McPheron1993; Vencill & Zehnder, Reference Vencill and Zehnder1993; Hollingsworth et al., Reference Hollingsworth, Tabashnik, Ullman, Johnson and Messing1994). If so, then an attempt to detect at least one (≥1) resistant individual using a systematic sampling plan is problematic if the dispersion pattern of the resistant individuals is patchy. Not only does the probability of detection decrease dramatically with increasing patchiness, but the observed probabilities are inconsistent. The problem worsens when attempts are made to document (measure) resistance frequencies by detecting ≥90% of the resistant individuals, as in this study. In a simulation study to detect leek rust, Puccinia allii Rodulphi, Jong (Reference Jong1995) found that patchiness of the diseased plants did affect the sampling efficiency of certain sampling plans, but the outcome of random sampling was independent of the spatial distribution of the diseased plants.
Venette et al. (Reference Venette, Moon and Hutchison2002), after reviewing strategies and statistics of sampling for rare individuals, discussed a situation when sampling is systematic and positive individuals (e.g. resistant individuals in our case) are aggregated in the sampling universe, as occurs when faecal samples are collected from herd mates in a herd infected with Escherichia coli (e.g. Jordan & McEwen, Reference Jordan and McEwen1998). Spatial aggregation leads to serial correlation among neighbouring individuals, which leads to underestimates of rare individual frequency when low, and renders confidence limits unreliably small. They suggested that this problem could be solved by randomization, while Hung & Swallow (Reference Hung and Swallow1999) recommended avoiding small group sizes. Finding a resistant allele, for example, a kdr mutation which was reported to be only 3.38% in the M form of Anopheles gambiae (Yawson et al., Reference Yawson, Mccall, Wilson and Donnelly2004), would also require larger sample sizes.
The simulations in the present study clearly show that a simple random sampling plan for resistance detection and subsequent documentation is also not affected by the dispersion patterns of the resistant individuals. Therefore, systematic sampling should be avoided if it is suspected that the dispersion pattern of an insect species with resistant individuals is patchy. Systematic sampling is often chosen because it is faster and easier to implement than a random sampling plan; however, simple random sampling methods that may be just as easy and cost effective to implement do exist (e.g. Legg & Yeargan, Reference Legg and Yeargan1985; Worner et al., Reference Worner, Shah and Chapman1999; Venette et al., Reference Venette, Moon and Hutchison2002). While sample sizes should be selected according to the objectives of the monitoring programme (resistance detection or documentation), it is clear that the dispersion pattern of the population needs to be considered as well.
Because resistant and susceptible individuals could be absolutely identified in this computer simulation study, all probabilities are based on what amounts to a perfectly diagnostic test. This means that, unfortunately, sample size requirements would increase if a perfectly discriminating dose is not available and an LD99 or similar dose is used (Roush & Miller, Reference Roush and Miller1986). Small sample sizes will give a very wrong impression, by either underestimation or overestimation, of the resistance frequency present in a field, especially when there are few large patches, or so-called ‘hot spots’. Under these circumstances, sampling outside (underestimation) or inside (overestimation) such patches has a reasonably high probability, especially when samples are taken systematically. In this study, systematic sampling, using sample sizes of 50 to 200 individuals when resistant individuals were distributed in five patches, never detected resistance frequency within an error criterion of ±10% for any of the resistance frequencies used. Resistance was either underestimated (≈30%) or overestimated (≈70%).
The sample sizes required are a linear function of the resistance frequency, i.e. doubling the resistance frequency requires half the sample size needed and vice versa. For example, to detect resistance frequency within ±10% of resistant individuals present at a frequency of 5%, a sample size of 2400 (for randomly distributed resistant individuals and using random sampling) would be necessary.
Once resistance has been detected, management tactics involve attempts to slow down the rate of resistance development. Baseline resistance frequencies, sometimes with critical frequencies and action thresholds (Dennehy & Granett, Reference Dennehy and Granett1984b; Brewer & Trumble, Reference Brewer and Trumble1991) are established. For management tactics to be successful, the changes in the observed resistance frequency over time need to be compared with the baseline resistance frequency. For such comparisons, an accurate measure of the frequency of resistant individuals present in a particular area is very important. The resistance frequencies measured within ±10% of the true frequency of the resistant individuals could give such acceptable precision and changes in the resistance frequencies over time could be correctly measured. If estimates of resistance frequencies using a sample size of 2400, 1200, 600 and 240 (for resistance frequencies of 5%, 10%, 20% and 50%, respectively) using a simple random sampling (for both random and patchy dispersion patterns) is carried out once a season, or once in two seasons, it could give a clear picture of the resistance frequency present in a certain area at a certain time to help achieve the management objectives. If tests indicate an appreciable shift in sensitivity from the baseline position, then further monitoring, preferably at the same sites, would be justified to reveal whether resistance is spreading, declining, fluctuating or showing little change and how far it is associated with losses of control (Brent, Reference Brent and Glass1986). Chen et al. (Reference Chen, Zhong, Zhang, Shi and Zhou2010), who studied pyrethroid knockdown resistance in Culex pipiens pallens mosquitoes, found resistance frequency ranging from 21.4% to 79.8% at different locations. Further documentation of these frequencies would, therefore, need different sample sizes at each location.
However, the results obtained from these computer simulation studies should be validated under glasshouse/field conditions. For lower resistance frequencies (for example 1%), when it is suspected that the resistant individuals are patchily distributed, resistance documentation (detection of ≥90% of resistant individuals) would not be practical as a sample size of 20,000 would be required. However, for higher resistance frequencies (10% and above), ≥90% of resistant individuals could easily be detected and, therefore, resistance frequency in fields could be documented. Resistance documentation could be easier where it is easy to sample and bioassay large numbers of arthropods, for example, aphids, whiteflies or mites, etc. Bioassays using pheromone traps (Riedl et al., Reference Riedl, Seaman and Henrie1985) or yellow sticky traps (Prabhaker et al., Reference Prabhaker, Toscano, Perring, Nuessley, Kido and Youngman1992) could also be tried for such resistance documentation. When large numbers cannot be sampled, lower probabilities of estimation should be expected. A trade-off between the selected sample size and corresponding probability of correct estimation is a possible alternative. It is clear that in all cases individuals should be collected using a strictly random procedure from a predefined area or location. The estimated resistance frequency could, thus, be used to classify the location as resistant or otherwise and could confidently be associated with control failures.
Efficient sampling programs for resistance management are critical. While standard statistical equations can be used to determine the number of samples required to detect the presence or level of resistance in a population, these equations assume that the resistant individuals are dispersed randomly within the larger population. In reality, such individuals often have a sparse or patchy dispersion as they develop from resistant foci within an area. To design and test an appropriate sampling program for resistance management (detection and documentation) of such populations at the field scale is not feasible, simply because the true frequency of resistant individuals in the population must be known to test sampling efficiency. In reality, the true frequency is never known and must be estimated. The simulations used in this study allow sampling methodology and sample size requirements to be quickly determined and tested to increase the chance of detection of resistant individuals at any level of phenotypic frequency. Additionally, samples sizes and methodology to increase the precision of estimates of resistance severity can been determined. This research has shown that, if an aggregated dispersion pattern is expected, systematic sampling should be avoided and that simple random sampling would give more precise and reliable bioassay results.