

1 INTRODUCTION
Contact-induced phonological innovations have been attested in many languages and dialects, using multiple laboratory, corpus and fieldwork methodologies. These studies, carried out in a variety of historical and contemporary settings, revealed intriguing similarities between phonetic and phonological features and socio-demographic settings conducive to the uptake and spread of innovations in language. Urban multiethnolects (Clyne, Reference Clyne2000, Quist, Reference Quist2008, Cheshire, Kerswill, Fox, and Torgersen Reference Cheshire, Kerswill, Fox and Torgersen2011), the focus of this article, represent one such case of language contact. “Born in the informal spontaneous talk of multiethnic peer groups” (Cheshire, Nortier, and Adger, Reference Cheshire, Nortier and Adger2015: 2), multiethnolects are thought to emerge from multiple input varieties used by speakers of diverse ethno-linguistic background. These speakers are typically exposed to a wide variety of features and forms of different origins that they encounter more or less frequently and systematically and that they can adopt and recombine on their own (see the ‘feature pool’ analogy in Mufwene (2001: 4–6)). Consequently, the linguistic ‘triggers’ and ‘outcomes’ of contact-induced phonological innovations in urban multiethnolects can be highly variable, sometimes ephemeral, and often tied to interactional constraints, such as participants’ stance and footing in ‘talk in interaction’ (Kern and Selting, Reference Kern and Selting2011, Fagyal and Stewart, Reference Fagyal, Stewart, Kern and Selting2011). For these reasons, multiethnolects are probably best characterized as vernacular speech styles (Rampton, Reference Rampton, Nortier and Svendsen2015).
In this article, we examine some characteristics of prosodic rhythm in a small sample of contemporary adolescent urban vernacular of French spoken in Paris. We first discuss relevant previous findings that led us to our hypotheses and methodology, and then present our findings on the possible influence of gender and cultural background on the prosodic rhythm of 24 teens featured in the Multilingual Paris French corpus (Gardner-Chloros, Cheshire, and Secova, Reference Gardner-Chloros, Cheshire and Secova2014).
Studies of contact-induced prosodic innovations grounded in shared histories of colonization and immigration have been particularly numerous in English. Based on contemporary and archival field recordings with White and African speakers born in North Carolina before and after the Civil War, for instance, Thomas and Carter (Reference Thomas and Carter2006) showed that African-American English spoken in North Carolina “was once similar to Jamaican English in prosodic rhythm” (p. 331), exhibiting less vowel reduction and smaller differences in length between vowel categories. This type of rhythm is typically referred to as ‘syllable-timed’. Their results also revealed that over the course of the last century the prosodic rhythms of White and African English speakers in North Carolina became more similar. In this process of convergence, the local African variety progressively aligned on the timing and durational patterns typical of a more ‘stress-timed’ rhythm, characterized by more marked vowel reduction and starker differences in vowel length. Studying rhythm-type distinctions in another postcolonial context, Szakay (Reference Szakay and Gorman2008) also found that the prosodic rhythm of Maori New-Zealand English speakers was more syllable-timed than White New Zealanders’ rhythm. In her corpus, variable degrees of vowel reduction and differences in the timing of vocalic intervals were some of the main correlates of rhythm-type distinctions. Furthermore, greater integration into the local Maori culture patterned together with greater differentiation from the more stress-timed rhythm of White New Zealand English. In a multilingual urban immigrant contact setting in New York, Newman (2010) demonstrated how phonetic correlates of prosodic rhythm contributed to the more or less accurate identification of speakers of various ethnic origins. In his study, rhythm was measured using the nPVI index that compares the durations of adjacent vocalic segments, normalized for rate. While, in light of this index, two Asian speaker groups (Chinese and Korean) could not be reliably told apart from other ethnic groups, gender seems to have mattered in some way: the prosodic rhythms of men showed considerable variation within and between groups, while “the women's median nPVI scores hardly varied” (idem: 167). As expected in light of previous studies (see for instance Low et al. Reference Low, Grabe and Nolan2000 on Singapore English), the speech of all Chinese men was significantly more syllable-timed than other speakers’ rhythm. Asian women's previously unattested uniformity of prosodic rhythm, however, remains an intriguing finding that might warrant further investigations.
Segmental and timing differences in prosodic rhythm have also been identified in contemporary urban vernaculars in Europe. In high-contact areas targeted by mass labor and refugee migrations, national standard languages spoken by multicultural populations of immigrant descent, for instance, have been reported to differ noticeably from local non-contact varieties. Hansen and Pharao's (Reference Hansen, Pharao, Quist and Svendsen2010) study of the speech rhythm of vernacular Copenhagen Danish revealed greater differences between short and long vowel durations in the speech of ethnically Danish speakers than in that of immigrant speakers, indicating that adult L2 learners of Danish might have difficulties replicating subtle patterns of timing and relative segment duration ratio in contrastive vowel durations. Torgersen and Szakay (Reference Torgersen and Szakay2012) reached similar conclusions on timing differences and contrastive durations of diphthongs and schwa in Multicultural London English where the speech of young non-Anglos was found to be more syllable-timed than the speech of Anglo teens. One important correlate was the monophthongization of certain diphthongs that lead to shorter vowel durations.
While there have been relatively few comparisons between contact varieties of French, previous studies focusing on regional varieties identified a wide variety of phonetic differences cueing measurable rhythm-type distinctions. Avanzi, Obin, Bordal, and Bardiaux (Reference Avanzi, Obin, Bordal, Bardiaux, Quiuwu, Ding and Hirst2012), for instance, found greater variability between adjacent consonantal durations (ΔC) when combined with the effect of speech rate in comparisons of French spoken in France, Belgium and Switzerland. Obin, Avanzi, Bordal, and Bardiaux (Reference Obin, Avanzi, Bordal, Bardiaux, Ma, Ding and Hirst2012), on the other hand, contrasting the prosodic rhythms of several varieties of European and African French, as well as Kaminskaïa, Tennant, and Russell (Reference Kaminskaïa, Tennant and Russell2016) examining the rhythmic properties of Ontario French in minority and majority contexts, concluded on important differences in rhythm using canonical rhythm metrics (e.g. nPVI, see infra). In immigrant contact settings, Fagyal (Reference Fagyal2010a, Reference Fagyal, Preston and Niedzielskib) applied canonical measures of rhythm metrics (%V, ΔC, and ΔV, see infra) together with analyses of syllabic structure and consonant inventory to examine the prosodic rhythms of French monolingual and French-Arabic bilingual adolescents in Paris. All speakers had grown up in the same working-class suburb of Paris known for its predominantly immigrant-origin population. It was hypothesized that the speakers with African backgrounds, who, in addition to French, spoke at least one other language that was typologically stress-timed, would show a less syllable-timed rhythm than French youth of non-immigrant background. Although the hypothesis could not be confirmed in light of the central tendencies of rhythm metrics, the speech samples of bilingual French youth showed greater variability in vowel durations and stop consonant realizations, typical of stress-timed rhythm, than monolingual French youth.
Taken together, these findings suggest that subtle timing patterns underlying prosodic rhythm can be difficult to replicate even by the most advanced learners, sequential bilinguals, and native speakers of various ethnic varieties of English and French. In many varieties of English, for instance, stress-timed rhythm entails the shortening of vowel durations in unstressed syllables and the marking of contrastive vowel length distinctions using precise ratios of short vs. long vowel durations. The incomplete replication of these patterns typically lead to the perception of a more ‘leveled’, so-called syllable-timed, rhythm, a type of prosodic rhythm that appears to be atypical in most contemporary Anglo varieties. Conversely, in many varieties of French, only a few of which have so far been examined in postcolonial and immigrant contact settings, the faithful reproduction of syllable-timed rhythm entails no vowel reduction in unstressed syllables and less difference in vowel length between stressed syllables. Whenever these patterns are not faithfully replicated, more stress-timed rhythmic patterns can arise.
Building on this extensive body of literature, in this article we examine the rhythm-type characteristics of a small sample of contemporary adolescent urban vernacular in Paris and compare our findings to those obtained from parallel corpora collected elsewhere. In keeping with a growing trend in sociolinguistics, we study variation within a broader interpretative framework that allows for comparisons between different languages in similar socio-demographic settings (see Kern and Selting, Reference Kern and Selting2011, Nortier and Svendsen, Reference Nortier and Svendsen2015, and Gardner-Chloros and Cheshire, this volume). Similar to multiethnic areas of London and New York, we expect to find innovations in prosodic rhythm in multiethnic areas of Paris, as these areas represent multilingual urban spaces conducive to the formation of so-called multiethnolects: “[linguistic forms and practices] born in the informal spontaneous talk of multiethnic peer groups [with] a defining characteristic that they are used by (usually monolingual) young people from non-immigrant backgrounds as well as by their bilingual peers” (Cheshire et al., Reference Cheshire, Nortier and Adger2015: 1).
2 METHOD
2.1 Speakers and corpus
We analyzed speech samples extracted from the unconstrained conversations of 24 teens featured in the open-access Multicultural Paris French (MPF) corpus compiled by Gardner-Chloros, Cheshire, and Secova (Reference Gardner-Chloros, Cheshire and Secova2014). The teens were between 13 and 17 years of age and were divided into two groups comprising equal number of female (F) and male (M) speakers. Their average ages in the two gender groups were 14.33 and 15.08 years, respectively. The two groups were also evenly split according to their reported cultural backgrounds, indicating either (a) second- and third-generation immigrant origins (referred to as ‘multicultural’, henceforth MC), or (b) the lack of known recent immigrant origins (referred to as ‘Franco-dominant’, henceforth FD). In keeping with the hypotheses of the MPF-MLE research group, cultural background was not considered a substitute for ethnicity. Rather, this variable aims at operationalizing the concept of potential multilingual and multiethnolectal influence, with presumably more (MC) or less (FD) diversity of linguistic forms and practices in the vernacular (see for instance Cheshire et al. Reference Cheshire, Nortier and Adger2015). The average age of participants was 15.25 (MC) in the MC group and 14.33 in the FD groups. All but one MC male participant were still in school.
Following previous corpus-based studies of prosodic rhythm (e.g. Torgersen and Szakay (Reference Torgersen and Szakay2012) and Kaminskïa et al. (Reference Kaminskaïa, Tennant and Russell2016)), we examined continuous stretches of personal narratives, whose length could vary between 40 to 180 seconds for any given speaker. These narratives were extracted starting from about 1–1.5 minutes into each conversation in order to capture on-going interactions that were thought to favour longer continuous speech material. Samples were relatively free from disfluencies, overlaps and backchannel cues from peers participating in the exchanges. While emotional involvement in narratives could not be controlled, passages with too many interjections, laughter and vocal manifestations of emotion were excluded. The somewhat rapid pace of exchanges made it unlikely, in our opinion that any speaker could have accommodated to their interlocutors’ speech rhythm in the course of their conversations.
Our hypotheses were as follows. (1) Adolescents with a multicultural background who grew up surrounded by bilingual and L2 varieties of French would be more likely to show innovations in prosodic rhythm compared to teens whose ambient linguistic input comprised fewer or no other language(s) than French. (2) Much in the same way as non-Anglo speakers’ prosodic rhythm in Multicultural London English (MLE) and the rhythm of Danish speakers of immigrant descent in Copenhagen, the prosodic rhythm of multicultural teens in MPF was expected to show opposite tendencies to the standard: it was predicted to be more stress-timed. We aimed to confirm or to reject these hypotheses based on canonical rhythm-type metrics reviewed in the next sections.
2.2 Materials and segmentation
Each speech sample was segmented into adjacent consonantal and vocalic elements using EasyAlign (Goldman, Reference Goldman2011), an automatic forced alignment tool for French under Praat that returns a TextGrid composed of phonetic, syllabic, lexical and utterance tiers. Errors of forced alignment were checked manually and corrected, where necessary, using auditory and visual feedback derived from spectrograms. Inter-rater agreement, qualified as ‘high’ (0.87 and 0.79, respectively) was obtained from two expert raters who examined four randomly selected short excerpts from four speakers in the corpus. Pauses and all marks of hesitation – vocalic or consonantal in nature – have been discarded. Following Fagyal (Reference Fagyal2010a, Reference Fagyal, Preston and Niedzielskib), the beginning of vowels following stop consonants was set at the release of the stop burst. Glides, glottal stops and voiceless vowels that did not display formants were considered consonantal. All but one allophone of /R/ were treated as non-vocalic elements; fully voiced allophones of /R/ in intervocalic positions were treated as vocalic segments when they contained no friction noise or could not be reliably segmented from adjacent vocalic elements. Vocalic and consonantal elements in every prosodic position were included to remain consistent with our expectations to find a variety of structures (including more or less phrase-final lengthening) in these spontaneous speech samples.
2.3 Metrics and measurements of rhythm
The rhythmic classification of languages is typically represented on a continuum and is determined by specific phonetic and phonological characteristics. Language varieties with predominantly simple CV-type syllable structure, absence of vowel reduction and relatively small variations of vowel duration tend to yield speech signals that contain more vocalic than consonantal material. This typically translates into an overall higher ratio of vocalic intervals per utterance and cues so-called ‘syllable-timed rhythm’. Such rhythmic patterns differ markedly from the rhythms of languages with complex syllable structure and a strong tendency towards vowel reduction referred to as ‘stress-timed rhythm’. To analyse these contrasts, the following measurements were made:
– %V: interval measure capturing the ratio of vocalic portions in the signal, indicative of more vocalic material in the speech signal, which is one of the correlates of syllable-timed rhythm;
– ΔV: interval measure based on the standard deviation of vocalic interval durations. This measure is expected to be relatively low, for instance, in European varieties of French that have no diphthongisation and/or vowel reduction.
– ΔC: interval measure based on the standard deviation of consonantal interval durations. This measure is expected to be relatively high, for instance, in most varieties of English with different types of simple and complex consonant clusters.
– nPVI: normalised index calculated for all between-pause speech passages (‘utterances’ in read-aloud speech corpora) according to the canonical formula (see Appendix) used in the literature since its first application by Grabe and Low (Reference Grabe, Low, Warner and Gussenhoven2002). The formula takes the absolute value of the difference between two consecutive vocalic intervals and divides it by the average duration of the intervals.Footnote 1 The higher the nPVI value, the greater is the difference between the durations of adjacent vocalic segments and the more stress-timed the excerpt is likely to be. Conversely, the lower the index, the smaller durational differences are, and the more the speech excerpt is expected to be syllable-timed.
Given the small number of speakers (2 sexes x 2 types of cultural background x 6 speakers) and the exploratory, rather than predictive, nature of these analyses, we avoided the use of regression models when testing for statistical significance. Rather, following previous methods (e.g. Newman, 2010, Kaminskaïa et al., Reference Kaminskaïa, Tennant and Russell2016), we applied a series of ANOVA tests to gauge the effects of two social factors: gender and cultural background. Pearson correlations were used, whenever necessary, to determine statistically important similarities and differences between particular datasets.
3 RESULTS
3.1 Interval and nPVI measures: gender and cultural background
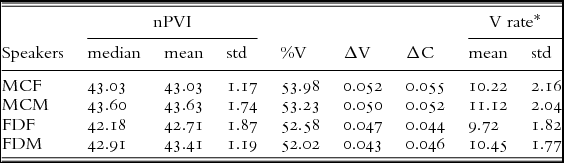
As the leftmost columns in Table 1 indicate, median and mean nPVI values were higher, overall, for the two multicultural gender groups (MCF and MCM) than the two Franco-dominant groups (FDF and FDM), pointing to a possibly more stress-timed prosodic rhythm in the former. There seemed to be no gender differences in this respect: both multicultural gender groups had higher median and mean nPVI values than the two Franco-dominant gender groups. The standard deviations of nPVI values per group also suggest lack of uniformity across the board, as variation in nPVI was the largest among Franco-dominant females and the smallest among multicultural females. The opposite was true for male speakers: multicultural male speakers’ nPVIs appeared to vary more with respect to the mean than the nPVIs of their Franco-dominant counterparts. The range of variations, however, was similar in all cases.
Rhythm metrics for participant groups by gender and cultural background.

*vocalic interval/second
Results of between-subject ANOVAs for nPVI showed a small but significant overall effect for cultural background: (F (1, 3) = 2.319; p = 0.042). Results for the interval measures %V, ΔV and ΔC (middle columns of Table 1) also indicate some degree of split between the four groups with respect to background. Multicultural females had the highest amount of vocalic material measured in the speech signal (%V), which is typical in language varieties with predominantly syllable-timed rhythm. However, somewhat contradictorily, this group also scored the highest with respect to variation in the durations of adjacent vocalic (ΔV) and consonantal (ΔC) intervals that are more commonly associated with stress-timed rhythm. Mean vocalic articulation rates, together with corresponding standard deviations shown in the rightmost columns of Table 1, indicated a small but statistically non-significant difference in gender: male speakers articulated slightly faster, overall, than female speakers did. A closer look at the differences also showed that within each gender group, speakers with multicultural background tended to articulate somewhat faster than Franco-dominant teens. Thus, in light of these rhythm measures, there appears to be a small effect of cultural background with little or no significant effect of gender. It is possible that some of the suggestive differences observed in these samples could turn out to be stronger with increased sample size.
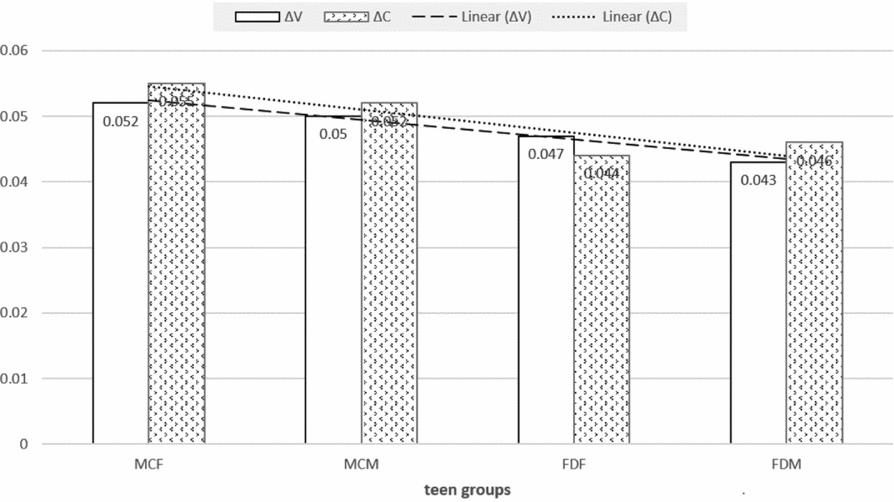
When the four groups’ ΔV and ΔC values are plotted in a decreasing order, as in Figure 1, between-group differences become even clearer. It is noticeable, for instance, that the two multicultural groups showed the most overall variability of both vocalic (ΔV) and consonantal (ΔC) intervals, which is typically taken to be indicative of more stress-timed rhythm. However, these differences were not statistically significant. The trends for ΔV and ΔC (dotted lines overlaid on the columns) show a slight monotonous decrease across all four speaker groups, indicating that while variations in the durations of adjacent intervals were group-specific (MCF and MCM), patterns of variation were relatively uniform, overall.
Median interval measures ΔV and ΔV and linear trends (dotted lines) between the four teen groups by gender and cultural backgrounds.

3.2 Speaker participation
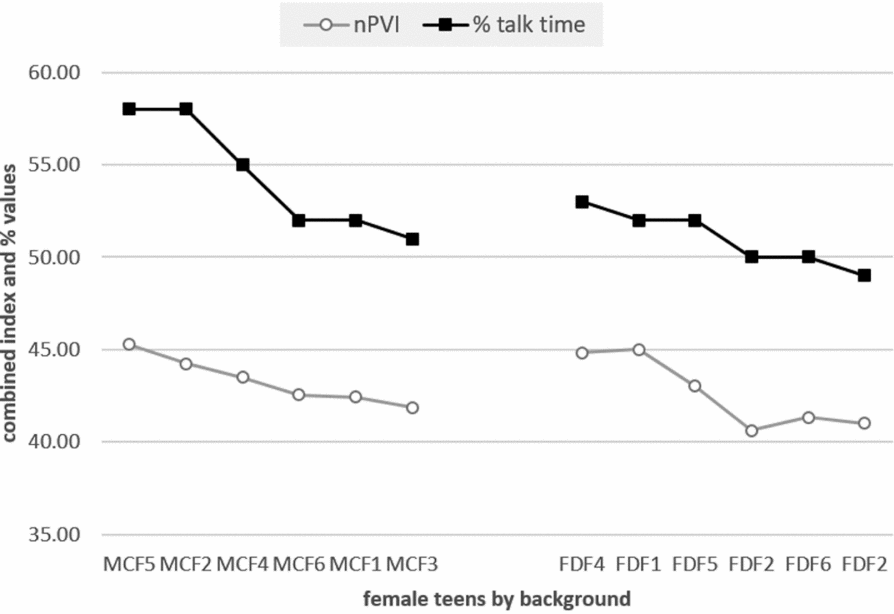
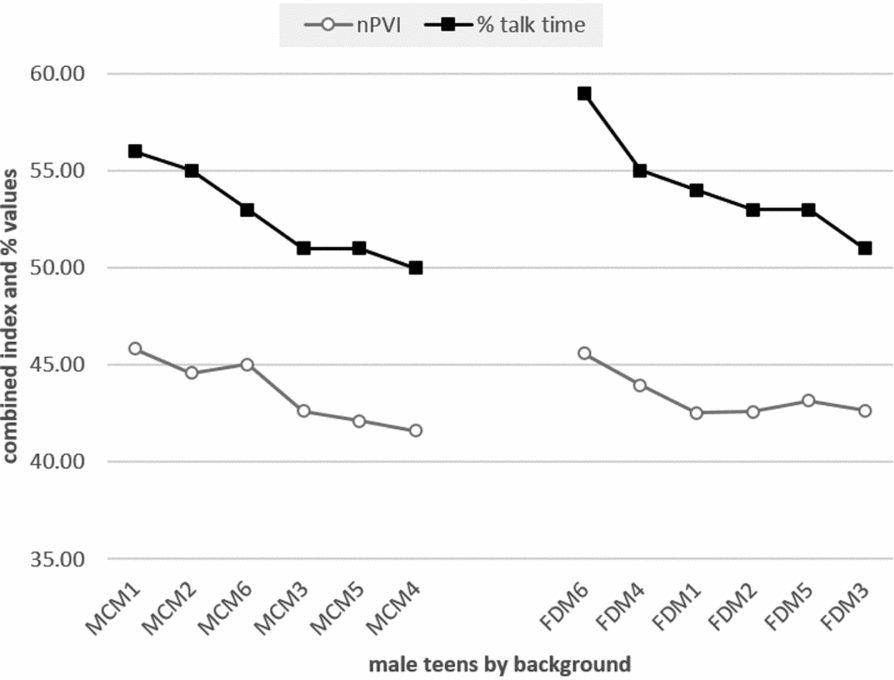
While social and cultural variables do not seem to have had any large group effects in this corpus, one speaker-specific variable revealed some interesting correlations with nPVI values. Figures 2 and 3 show the percentage of time spent by the speakers holding the floor in their conversation samples (top half of each figure), plotted against the normalised pairwise variability index values for speaker (bottom half of each figure).
Percentage of time spent by female speakers holding the floor in their conversation samples (top half) plotted against their normalized pairwise variability index values (bottom half).

Percentage of time spent by male speakers holding the floor in their conversation samples (top half) plotted against their normalised pairwise variability index values (bottom half).

What is immediately apparent from even a cursory inspection of the trend in each speaker group is that the most profuse talkers, plotted on the left end of each line chart, also systematically had some of the highest nPVI values in their respective gender and cultural groups.
With less talkative speakers – who held the floor less often and/or less long within their conversational samples recorded with their peers – the tendency was similar, but not as strong (i.e., some had relatively high ‘% rate’ values and yet low nPVI values, or vice versa). Within-group Pearson's correlations between ‘% talk time’ and ‘aggregate median nPVI’ were positive and statistically significant (p ≤ 0.001) for each speaker group (MCF: r= 0.849, FDF: r= 0.794, MCM: r= 0.669, and FDM: r= 0.602).
Although the percentage of time spent holding the floor represents an arguably crude measure of dominance within any given interaction, in this particular corpus that sampled a variety of short and rapid exchanges with multiple peer group members, ‘% talk time’ might indicate an important speaker characteristic: ‘propensity’ to seize the floor and take the opportunity to talk. Perhaps it is not a coincidence that in more talkative speakers’ speech the length of adjacent vocalic intervals varied more despite normalisations for rate, which could definitively have an impact on several rhythm-type measures.
3.3 Multiethnic phonetic repertoires
In addition to longer talk times, some of the most talkative speakers also tended to use a rich repertoire of allophones of /R/ and word-initial dental and velar stops. While it proved to be too challenging to illustrate this observation within the speech of the same speaker, the following excerpt taken from one of the conversational samples of speakers MCM1 and MCM6 shows the same narrative performed jointly by two particularly talkative male speakers with multicultural background:
MCM1: ah ça c'est peut-être le métro londonien parce qu'à Paris tu restes coincé comme ça (.) parce que un mec il était coincé comme ça il courait (.) on a on a entendu 'beep' il a sauté (.) il est resté coincé
[rire]
il est resté coincé comme ça là tu vois sur la ligne huit là (.) on était là on le tirait à l'intérieur du truc c'était méga drôle.
[= interjections]
MCM6: même dans le bus là dans le cent trois (.) j'étais à [. . .] (il) y a un mec il a fait la même il a couru il a sauté ça s'est bloqué sur sa jambe gros dedans (.) et un bras seulement (.) gros il était comme ça c'était sur sa tête il avait trop mal et nous on était à l'intérieur et on poussait sa tête (.) pour le jeter à l'extérieur du bus (.) il faisait trop pitié (..) eh c'était méga drôle
As shown by consonants underlined in the bolded words, affricated realisations of /t/ and /d/ in tu ‘you’, (on) tirait ‘we were pulling’, and du (bus) ‘of (the bus)’ co-occurred with non-affricated realisations in the same words or in similar syllable positions throughout the excerpt. Palatalised and affricated realisations of dental stops, one of the most salient and widely discussed vernacular features of contemporary urban French (e.g. Berns, 2013; Trimaille et al., Reference Trimaille, Candea and Lehka-Lemarchand2012), were used in tandem between the two speakers, whose lively enactment of an incident with a passenger whose legs were caught between the closing doors of a bus in Paris is accompanied by multiple backchannel cues and various other participatory noises from the audience. The translation of this excerpt is included in the Appendix.
Variations in the repertoires of phonetic features have also been identified in other urban vernaculars. Rampton (Reference Rampton, Nortier and Svendsen2015), for instance, showed that, within the same narrative, a British business man of Pakistani descent, code-named Anwar, used multiple combinations of consonantal and vocalic features characterising at last three recognisably different language varieties: Creole, Punjabi and London English. Anwar's distinctly multicultural style, amplified or toned down depending on the goal and the context of the exchange, is rightly interpreted as a particular interactional style rather than a distinct ‘variety’, due to its adaptability to the goals of the exchange and the ethnic and socio-economic backgrounds of the interlocutors.
4. CONCLUSIONS AND DISCUSSION
In this study, we set out to investigate whether or not the prosodic rhythms of 24 female and male adolescents featured in the MPF corpus showed characteristics of stress-timed rhythm, as previously established for many multiethnic urban vernaculars in Europe. Using canonical rhythm metrics, among them the normalised Pairwise Variability Index (nPVI), we showed that there is no clear effect of gender and only a small effect of cultural background on the variability of adjacent vocalic and consonantal duration intervals, both previously correlated with more or less syllable-timed rhythm. However, male and female teens with multicultural background who clearly dominated their exchanges and also used multiple phonetic features attributed to adolescent urban-vernaculars in French tended to show more variability in interval durations, which can point to more stressed-timed rhythm.
Multicultural females had the highest amount of vocalic material measured in the speech signal (%V), which is typical in language varieties with predominantly syllable-timed rhythm. The fact that this group also scored the highest with respect to variation in the durations of adjacent vocalic (ΔV) and consonantal (ΔC) intervals is unusual, but not contradictory to stress-timed rhythm. Phrasing – and thus vowel length differences – can play a key role in structuring narratives and, as a consequence, display a tendency to greater variations in vowel durations (ΔV). Allophonic complexity, especially for consonants, as shown for instance in the excerpt from the narratives of speakers MCM1 and MCM6, could also account for some variability of consonantal duration intervals (ΔC) in these speakers’ speech. Furthermore, the trends for ΔV and ΔC (dotted lines overlaid on the columns in Figure 1) were quite uniform. Their slight monotonous decrease across all four speaker groups indicated that, despite some between-group differences, patterns of variations in these two correlates of prosodic rhythm were widely shared. Taken together with the small effect of cultural background on speakers’ nPVI, these results provide a strong indication that the prosodic rhythms of these 24 speakers are essentially syllable-timed, with more or less tendency for individual speakers to slide towards a more marked stress-timed rhythm.
These results corroborate similar findings in the literature. Non-Anglo speakers in London with a high articulation rate were also more syllable-timed than Anglo-speakers (Torgersen and Szakay, Reference Torgersen and Szakay2012) and younger participants exhibited a slightly faster articulation rate than speakers over 45 years of age in both French minority and majority contexts in Ontario (Kaminskaïa et al., Reference Kaminskaïa, Tennant and Russell2016). As in the present study, in these two studies rate effects proved to be important – although not always statistically significant – despite tight controls of rate. Furthermore, in Fagyal's (Reference Fagyal2010a, Reference Fagyal, Preston and Niedzielskib) studies of rhythm in a Parisian multiethnic contact setting, none of the canonical measures of rhythm metrics (%V, ΔC, and ΔV, see infra) yielded significant differences between bilingual and monolingual adolescents, which might indicate that both groups’ speech had predominantly syllable-timed rhythm and differed only in allophonic complexity. However, in Fagyal's (2010: 131-162) study the sheer number of innovative consonantal allophones in some of the bilingual speakers’ speech, including glottal stops that can signal emphasis in some contexts in French, suggested that in some cases rhythm-type distinctions might stem from allophonic variations rather than the leveling of phonemic contrasts. Allophonic variations can be speaker-specific and tied to articulatory rate as well as the propensity to talk. In other multiethnic urban vernaculars, speaker stance, image, and the needs of face-to-face interactions were some of the leading motivations for individual speaker differences. Lengthened allophones of /z/ in the Dutch of Moroccan origin in Hinskens’ (Reference Hinskens, Kern and Selting2011) study, for instance, were tied to shared ethnic and social identities and affiliation with interlocutors. Similarly, greater allophonic variations in the composite vowel systems of 11 adolescent London Jamaicans have been shown to depend on style-shifting triggered by context and the race/ethnicity of the interlocutors (Kerswill and Sebba, Reference Kerswill and Sebba2011). Thus, with respect to the findings of the present study, there are reasons to propose that speaker-specific phonetic factors, including the tendency to ‘tailor’ speech to the expectations of a particular audience could have also played a role. Phrasing and rate, in particular, could be relevant in rhythm-type studies of spontaneous speech corpora despite some reservations about such macro-level rhythmic characteristics in other speech contexts (see Arvaniti, Reference Arvaniti2009 and Prieto et al., Reference Prieto, del Mar Vanrell, Astruc, Payne and Post2012 for further discussion). In youth vernaculars recorded in naturalistic settings, the indexical values of innovative linguistic forms and practices have to be contextualised. Rate accelerations, shorter or longer prosodic phrases, among other correlates, could convey a host of social and indexical meanings from greater speaker-involvement to shared affiliation and supportive or oppositional stance. Similar to rhetorical interrogatives in Dekhissi's (Reference Dekhissi2016) study of banlieue movie excerpts and the marked declarative intonation contours in Fagyal and Stewart's (2011: 95) case study of a peer-group interaction, variable realisations of syllable-timed rhythm in Parisian urban youth vernaculars could also be “communicative tools of primary importance” (Dekhissi's Reference Dekhissi2016: 279) encoding interactional meanings that merit further investigation.
APPENDIX
Formula for canonical rhythm metric explained in section 2.3:
 $$\begin{equation*}
\left( {\sum\limits_{{\rm{n}} = 1}^{{\rm{m}} - 1} {\left| {\frac{{{{\rm{d}}_{\rm{n}}} - {{\rm{d}}_{\rm{n}}} + 1}}{{({d_{\rm{n}}} + {d_{{\rm{n}} + 1}}/2)}}} \right|/({\rm{m}} - 1)} } \right) \times 100
\end{equation*}$$
Translation of the conversational excerpt analysed in section 3.3:
MCM1: ah that must be the subway in London because in Paris you get trapped like that (.) because a guy was trapped like that (.) he was running (.) we heard a 'beep' he jumped (.) he got stuck
[rire]
He got trapped like this you see on the eight train, see (.) we were there we were pulling him inside that thing it was hilarious
[= interjections]
MCM6: even in that bus in the three hundred three (.) I was [. . .] there is this guy he did the same thing he ran he jumped his legs got caught (.) and one arm (.) he was like that it was his head it was hurting and and we were inside pushing his head (.) to let him out of the bus (.) he was a real mess (..) eh it was hilarious