Introduction
Research on fertility and family planning has focused almost exclusively on the responses of women; men have been neglected. In the early 1990s, researchers and family planning workers started realizing the important role of men in decisions about the number of children to have and use of family planning and some studies relating to couples have appeared. However, most of these studies have focused on the African subcontinent (Ezeh, Reference Ezeh1993; Dodoo & Landewijk, Reference Dodoo and Landewijk1996; Lasee & Becker, Reference Lasee and Becker1997; Bankole & Singh, Reference Bankole and Singh1998; Dodoo, Reference Dodoo1998). A few studies have examined the joint responses of spouses in Asia, e.g. studies from Malaysia, Pakistan and Bangladesh (Razzaque, Reference Razzaque1999; Hossain et al., Reference Hossain, Phillips and Mozumder2007; DaVanzo et al., Reference DaVanzo, Peterson and Jones2003). Only three studies have dealt with couple data in India (Mason & Smith, Reference Mason and Smith2000; Jejeebhoy, Reference Jejeebhoy2002; Singh et al., Reference Singh, Ram and Ranjan2007). Two of these included a few communities from the states of Tamil Nadu and Uttar Pradesh (Mason & Smith, Reference Mason and Smith2000; Jejeebhoy, Reference Jejeebhoy2002). The study by Jejeebhoy found weak concordance between spouses concerning the levels of women's autonomy within the household. The study by Singh et al. (Reference Singh, Ram and Ranjan2007) compared couples' fertility intentions in two north-eastern states of India: one had a patriarchal system and the other a matriarchal system. They found that husbands, in general, desire more children than wives irrespective of the family structure.
Decision-making on fertility and family planning typically involves a complex process of discussion and negotiation between marital partners and decisions are affected by the attitudes and perceptions of both spouses. Indeed, in developing societies, the husband may sometimes be the primary decision-maker on matters of family size and family planning. For example, a study in Egypt found that husbands are the primary decision-makers regarding spacing of pregnancies (SPAAC, 2004). Therefore, a woman may choose not to space in order to satisfy her husband's desire for children. Studies in sub-Saharan Africa have shown that many women desire to have longer birth intervals than their husbands (Blanc et al., Reference Blanc, Wolff, Gage, Ezeh, Neema and Ssekamatte-Ssebioba1996; Rafalimanana & Westoff, Reference Rafalimanana and Westoff2000). Given that longer intervals are better for the health of both the mother and children (Rafalimanana & Westoff, Reference Rafalimanana and Westoff2000; Rutstein, Reference Rutstein2000; Setty-Venugopal & Upadhyay, Reference Setty-Venugopal and Upadhyay2002; DaVanzo, Reference DaVanzo2004) and that both spouses' attitudes and perceptions affect birth spacing preferences (Ezeh, Reference Ezeh1993; Bankole, Reference Bankole1995), it is important to examine the responses of both on desired waiting time (DWT) to birth and factors that affect spousal concordance on this.
Three studies have explored spousal reports of DWT to next birth. Gebreselassie & Mishra (Reference Gebreselassie and Mishra2007) found that in sub-Saharan Africa spousal concordance on DWT is associated with wanting the next child sooner. In case of discordance, in eight of fourteen countries more wives wanted to wait longer than their husbands, and in six it was the reverse. Studies have also examined the association of socioeconomic and demographic factors with DWT to next birth for women (Rafalimanana & Westoff, Reference Rafalimanana and Westoff2000), but only one study examined the predictors of spousal concordance on DWT. Demographic factors were more important than socioeconomic factors as determinants of spousal concordance on DWT in sub-Saharan Africa (Gebreselassie & Mishra, Reference Gebreselassie and Mishra2007). The evidence on predictors of spousal concordance on DWT to next birth is thus very limited.
The DWT to birth among newlywed couples has not, to the authors' knowledge, previously been studied. In South Asia and many other developing countries there is a social expectation for couples to have their first child soon after marriage. In many cases couples are expected to have at least two children before they consider delaying or preventing future births. In India, mothers-in-law reportedly play a major role in deciding the timing of first birth (Setty-Venugopal & Upadhyay, Reference Setty-Venugopal and Upadhyay2002). Studies from India and Bangladesh have also documented the influence of mothers-in-law on family planning decisions of daughters-in-law (Arundhati et al., Reference Arundhati, Saavala and Kulmala2010) and suggest that the gap between knowledge and adoption of modern contraceptive methods among women is at least in part due to opposition of mothers-in-law (Qurub, Reference Qurub1995). However, the influence of mothers-in-law is waning with the increase of nuclear families and urban living.
Newlyweds are a special group among all couples in India where the society is predominantly patriarchal. Newlywed wives have little decision-making and negotiating power in their households. Discussion and negotiation on DWT to first birth is also likely to be less among newlyweds (IIPS & Population Council, 2009). The analysis of responses of newlyweds on DWTs to birth may provide important insights into their spacing needs.
This paper examines the concordance between newlywed partners on DWT to first birth. It also examines who wants to wait longer in case of discordance. Finally, it explores how various socioeconomic and demographic factors influence spousal concordance on the DWT.
Data and Methods
Couples' data from the Indian National Family Health Survey of 2005–06 (NFHS-III) were used to test the following hypotheses: that concordance on DWT will be greater among couples in which: (1) the couple resides in an urban area compared with their rural counterparts; and (2) spouses are more homogeneous on certain characteristics (education, exposure to mass media, work status, and age) compared with less homogeneous couples.
In the NFHS-III information was collected from a nationally representative sample of 109,041 households including 124,385 women aged 15–49, and 74,369 men aged 15–54. It covered 99% of the India population living in 29 states (IIPS & ORCMacro, 2007). In each state, the rural sample was selected in two stages, with the selection of primary sampling units (PSUs), which are villages, with probability proportional to population size (PPS) at the first stage, followed by the random selection of households within each PSU in the second stage. In urban areas, a three-stage procedure was followed. In the first stage, wards were selected with PPS sampling. In the next stage, one census enumeration block (CEB) was randomly selected from each sample ward. In the final stage, households were randomly selected within each selected CEB (IIPS & ORCMacro, 2007). Since the NFHS follows a multistage sampling design, the results are representative only after applying appropriate weights.
The survey interviewed adult women aged 15–49 in all the households and adult men aged 15–54 in a subset of households. Men aged 15–54 were eligible for an interview in all sampled households in seven states, namely Andhra Pradesh, Karnataka, Maharashtra, Manipur, Nagaland, Tamil Nadu and Uttar Pradesh. In the remaining 22 states, all men aged 15–54 were eligible for interview in a 38% sub-sample of households. The men's questionnaire contained a subset of questions in parallel to those in the women's questionnaire. The individual response rate, i.e. the number of completed interviews per 100 eligible women identified in the households, was 95% for the country as a whole (93% in urban areas and 96% in rural areas). The response rate for eligible men was 87% for the country as a whole (85% in urban areas and 90% in rural areas). Matching of information from the male and female interviews yielded 39,257 couples.
Men and women were asked about their background characteristics, reproductive behaviour and intentions, knowledge and use of contraception, involvement in health care, health and nutrition, attitudes towards gender roles, sexual behaviour and knowledge of HIV/AIDS and other sexually transmitted infections. The sections on reproduction, fertility behaviour and intentions included detailed questions on number of children born, number of surviving children, fertility preferences and future intentions to have children. The specific questions on fertility preferences were:
• For non-pregnant women: ‘Would you like to have (a/another) child, or would you prefer not to have any (more) children at all?’ and ‘How long would you like to wait from now before the birth of a/another child?’
• For husbands of non-pregnant women: ‘Would you like to have (a/another) child, or would you prefer not to have any (more) children at all?’ and ‘How long would you like to wait from now before the birth of (a/another) child?’
The present analysis is restricted to newlywed couples. For these analyses a newlywed couple is defined as one with both partners married for the first time and the marital duration is less than or equal to 12 months. Further, only those couples wherein the wife is self-reported fecund, neither spouse is sterilized and the wife is not pregnant are considered. These restrictions yielded 884 matched couples.
A statistical issue in the analysis of couples' data is the choice of appropriate sampling weights. In general, neither the men's weights nor the women's weights are appropriate for carrying out a couple-level analysis. The approach suggested by Becker & Sayer (2009) was followed to generate ‘couple’ weights for use in the present analysis. To construct couple weights, the household data were used to first identify the households having at least one couple. To accomplish this information had to be used on ‘relationship of member to the head of the household’, ‘marital status of the member’, ‘age of the member’ and ‘usual resident status of the member’ since the line number of spouse was not recorded for couples in the NFHS. After identifying the households having at least one eligible couple the number of couples in these households was counted. Then two probabilities were estimated: the probability of at least one eligible couple among completed households in the men's sample, and the probability of a completed couple interview in households with at least one eligible couple. The two probabilities can be represented by:
P 1=Probability (at least one eligible couple in household/household completed and selected for husband sample)=(households with eligible couple/households selected for male interview)
P 2=Probability (couple completed/eligible couple)=(number of couples completed/number of couples eligible)
The two probabilities were estimated separately for urban and rural areas in the 29 states. The household weights available in the NFHS-III dataset were inverted and multiplied by these two probabilities. This product was then inverted to get the non-normalized couple weights. Then these were normalized to sum to the number of couples. The 58 estimated probabilities are available from the authors on request.
The states of India are at different stages of socioeconomic and demographic development. The different geographic regions also differ considerably on various indicators of social and economic development, with southern India being much more economically and demographically developed than northern India (Dyson & Moore, Reference Dyson and Moore1983; Bose, Reference Bose1991; Bhat & Zavier, Reference Bhat and Zavier1999; Kurian, Reference Kurian2000). So providing estimates at the regional level may help us better understand the patterns. In order to facilitate the regional-level analyses, India is divided into six broad geographical regions, namely north, central, east, north-east, west and south. The north region consists of states like Jammu and Kashmir, Himachal Pradesh, Punjab, Uttaranchal, Haryana, Delhi and Rajasthan; the central region comprises of the states of Chhattisgarh, Madhya Pradesh and Uttar Pradesh; the east region includes the states of Bihar, Jharkhand, Orissa and West Bengal; the seven states of Arunachal Pradesh, Nagaland, Manipur, Mizoram, Tripura, Assam and Meghalaya come under the north-east region; the west region consists of states like Goa, Gujarat and Maharashtra; the south region includes the states of Andhra Pradesh, Karnataka, Kerala and Tamil Nadu.
Spousal concordance on DWT to birth was measured using matched information from each spouse's response to the questions listed above; these questions were only asked to men and women who reported that they desire a(nother) child. The response categories were: waiting time in months/years, soon/now, other, do not know. None of the partners among the newlywed couples reported ‘other’ or ‘do not know’. For women and men who responded ‘soon/now’, a value of 9 months was assigned. The differences in the responses of husbands and wives on DWT to birth were grouped into three categories: (1) spouses have concordant reports (concordance is defined as any difference in the range of −6 to +6 months); (2) the husband had a longer DWT (the difference was larger than +6 months); (3) the wife had a longer DWT (the difference was smaller than −6 months).
Binary logistic regression was used to examine the effects of various socioeconomic and demographic characteristics on spousal concordance on DWT. The binary model can be represented as
ln(P/(1−P)) = b 0 + b 1X 1 + b 2X 2 + . . . . . . . . . . . . . . + bkXk,
where P is the probability of spousal concordance, b 0, b 1, b 2, . . . . .,bk are the regression coefficients and X 1, X 2, . . . . .Xk are the set of covariates at the levels of husbands, wives, couples and households.
To test the first hypothesis the dependent variable is the spousal concordance on DWT (concordance=1 and 0 otherwise). Among the discordant couples, logistic regression was also used to predict the odds that the wife wants to wait longer. The choice of factors for analysing the concordance between partners is based on the framework on ‘couples and reproductive health’ developed by Becker (Reference Becker1996). The covariates in the model are: urban–rural residence, wealth quintile, religion (Hindu, Muslim, other), caste (scheduled castes/scheduled tribes, other backward classes, other castes), type of household (nuclear, non-nuclear) and pregnancy status of the wife (pregnant, not pregnant). The wealth quintile available in the NFHS data is an index of economic status of households. This index was constructed using household asset data and housing characteristics. Each household asset was assigned a weight generated through principal components analysis (Filmer & Pritchett, Reference Filmer and Pritchett2001). Each household was then assigned a score for each asset, and the scores were summed; individuals were assigned the total score of the household in which they reside. The sample was then divided into quintiles (IIPS & ORCMacro, 2007).
Five couple-level variables having two categories each were also created: (1) couple's schooling (husband and wife had dissimilar levels of schooling; both had similar levels of schooling); (2) couple's work (both husband and wife work; other); (3) couple's frequency of reading the newspaper (both partners had similar frequency of reading; spouses had dissimilar frequency); (4) the couple's frequency of watching television (both partners had similar frequency of watching; both had dissimilar frequency); (5) the difference between the ages of husband and wife (wife older or husband less than 5 years older; husband 5 or more years older).
The predictor variables were tested for collinearity before including them in the logistic model. Adjusted Wald statistics were used to test the significance of the predictor variables in the regressions. A test that is commonly used to assess goodness-of-fit of a logistic model is the Hosmer–Lemeshaw test (Hosmer & Lemeshow, Reference Hosmer and Lemeshow1989) but this test does not give good results in the case of complex sample survey data. Therefore, goodness-of-fit was assessed using the F-adjusted mean residual test for complex sample survey data (Archer & Lemeshow, Reference Archer and Lemeshow2006).
The analysis was carried out using ‘SVY’ commands in STATA (StataCorp, 2005), which corrects the standard errors associated with estimates by taking into account the complex sampling design.
Results
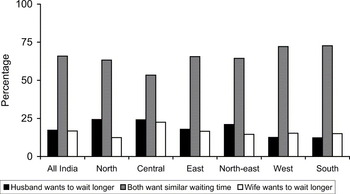
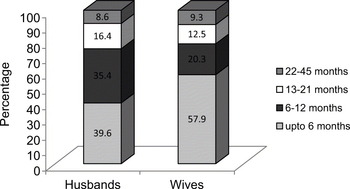
Figure 1 gives the spousal reports on DWT among newlywed couples by region. Overall, 65% of the couples had concordant desires. The correlation coefficient between the DWTs of husbands and wives was 0.50 (p<0.001). Concordance was highest among couples from the western and southern parts of India (72–73%) and lowest among couples from the central region (5%). In four of the six regions, the proportion of husbands who desired a longer waiting time exceeds the corresponding proportion for wives, but in the western and southern regions a higher proportion of wives desired a longer time to birth compared with their husbands. The proportion of husbands desiring a longer waiting time compared with their wives was highest in the northern region. Figure 2 gives DWTs for newlywed husbands and wives in India. The findings suggest that husbands were more likely to desire longer waiting times than their wives; 25% of husbands and 22% of wives desired to wait for more than 21 months to have a(nother) child.
Spousal concordance on desired waiting time to birth among newlyweds by region of India.

Desired waiting times to birth for newlywed husbands and wives in India, 2005–06.

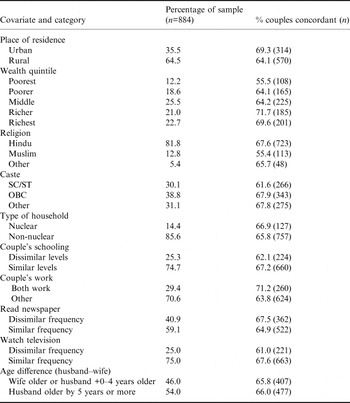
For selected covariates, Table 1 gives the percentage distribution by category and then the percentage of spouses in each category who have concordant DWTs. The majority of the couples lived in rural areas (64%) and were Hindus (82%). Thirteen per cent were Muslim and the rest belonged to other religious groups. Thirty per cent of the couples belonged to scheduled castes and scheduled tribes (SC/ST), 39% belonged to ‘other backward classes’ (OBC) and the rest belonged to other castes. A majority of the couples lived in non-nuclear households (86%) and in 75% of couples both partners had similar levels of schooling. Both spouses were working in 29% of the couples. In 54% of couples the husband was 5 or more years older than his wife and in the rest of the couples the husband was older by 4 years or less or the wife was older. Both partners reported similar frequency of reading a newspaper in 59% of couples and a majority of couples reported similar frequency of watching television.
Percentage distribution and proportion of newlywed couples in which spouses have concordant desired waiting time to birth by covariates, NFHS 2005–06, India

Concordance on DWT was slightly higher in urban (69%) compared with rural areas (64%), the top wealth quintile (70%) compared with the lowest wealth quintile (55%), Hindu couples (68%) compared with Muslim couples (55%), couples where both spouses had similar levels of schooling (67%) compared with couples where the partners had different levels of schooling (62%), and couples where both spouses work (71%) compared with all other couples (64%).
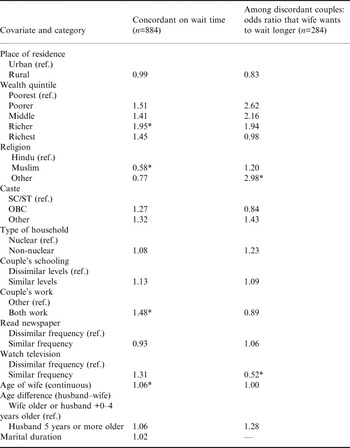
Logistic regressions for testing the first and second hypotheses are presented in Table 2. Place of residence had no significant association with DWT after adjustment for other factors. Wealth quintile was significant in predicting spousal concordance: couples in the richer quintile had twice the odds as couples in the poorest quintile to have concordant DWTs. The relative odds that a Muslim couple had concordant DWTs were only 42% of the odds that a Hindu couple had concordant desires. However, other religious groups did not differ significantly from Hindu couples on concordance. One of the important predictors of spousal concordance was the age of the wife: an increase in age of 1 year increased the odds of spousal concordance by 1.06. But age difference had no significant association with concordance. Marital duration was also insignificant.
Odds ratios from binary logistic regression predicting spousal concordance on desired waiting time to birth and odds ratios among the discordant couples that wife wants to wait longer, NFHS 2005–06, India

* p<0.10.
Couples with partners having similar levels of schooling did not differ significantly from couples with partners having dissimilar levels. Couples with both partners working were significantly more likely to report concordant desires compared with couples with only one or no partner working (odds ratio 1.48). The F-adjusted mean residual test showed that the models were a good fit.
Among the subset of discordant couples the odds that the wife wanted to wait longer as opposed to the husband wanting to wait longer were examined. Wives belonging to ‘other’ religious groups were 2.9 times more likely than wives belonging to the Hindu religion to have a longer DWT than their husbands. Other covariates did not have significant associations with the odds that the wife was the one who wanted to wait longer.
Discussion
The present analysis has a number of strengths and limitations. This is the first study that has considered the desired waiting time to birth reported among newlywed spouses and the covariates predicting spousal concordance in these desires. It is also the first study to use couple weights for generating the results. Earlier studies hardly mention the weights that need to be used with couple-level data. Couple-level studies have used men's or women's weight instead of deriving couple's weight. Use of men's or women's weights is likely to yield biased results since the response rates for men and women differ and are usually quite different from those for couples because single women and men are included in the former in the DHS weighting schema (Becker & Sayer, 2009).
A difference of up to 6 months between the spouses' reported DWT to birth was taken as concordant in the analysis. The difference of 6 months is somewhat arbitrary. The common use of ‘half’ in day-to-day life in Indian society guided the use of ‘up to 6 months’ as ‘no difference’. To check if the results were robust to this choice the analyses were carried out with a difference of 3 months, then 9 months, as concordance. The results were very similar to the results presented here. Thus, these findings are robust to the choice of cut-off for defining concordant DWTs.
In India spousal concordance on DWT among newlyweds is associated with wanting it sooner but one-third of the newlyweds have discordant desires. Concordance varies by geographical regions, with the central region having the lowest percentage of couples concordant. This region includes the states having the highest fertility levels in the country: the total fertility rates in Uttar Pradesh, Madhya Pradesh and Chhattisgarh are 3.82, 3.12 and 2.62, respectively (IIPS & ORC Macro, 2007). Among discordant couples, a higher proportion of husbands want to wait longer than their wives in all geographical regions except the western and southern ones. That the concordance was lowest in the central region has important policy implications for fertility control programmes there. Given that patriarchy is the predominant family structure in this region and the large majority of newlywed wives (a little more than 83% for all India and more than 91% in the central region) reside in joint households, newlywed wives are less likely to translate their desire for longer waiting time to birth into practice. Under such circumstances, newlywed wives are more likely to adhere to the decisions of others, including husbands and mothers-in-law, in the household. Studies based on all women have established household type as an important factor in determining utilization of maternal health services in India, even after adjusting for other socioeconomic factors (Saikia & Singh, Reference Saikia and Singh2009). Hence, the lower concordance on DWT is likely to stall the process of fertility decline in the central region. Data from NFHS-II and NFHS-III clearly show slower fertility declines in the states belonging to that region (IIPS & ORC Macro, 2000, 2007).
Socioeconomic factors play an important role in explaining spousal concordance on DWT. Couples belonging to the richer wealth quintile were more likely to have the same DWT compared with couples from the poorer wealth quintiles. Muslim couples were less likely than Hindu couples to have concordant desires. Contrary to the study's first hypothesis, urban–rural residence was not significantly associated with concordant desires. This could be because a majority of the newlyweds live in a joint family where the spouses have less opportunity to privately discuss issues related to fertility and family planning irrespective of their urban–rural residence. In fact, NFHS-II data (collected in 1998–99) clearly show a significant association between household type and discussion on family planning issues between spouses; couples in non-nuclear households having lower odds of discussion compared with couples in nuclear households (IIPS & ORC Macro, 2000). It is not possible to test this proposition with NFHS-III data as information on couple communication was not collected.
There was a mixed finding for the study's second hypothesis. After adjusting for other background characteristics, couples in which husbands and wives had similar levels of schooling and exposure to mass media (like newspaper and television) were no more likely to have concordant DWT than couples in which the husband and wife were dissimilar. On the other hand, couples in which both husband and wives were working were more likely to have concordant DWT than couples in which the husband and wife had different working status. Couples in which both spouses work would want to discuss delaying birth more often compared with couples in which either partner works. This could be one of the plausible reasons for higher concordance in couples in which both partners work.
Age difference between spouses is frequently cited as a factor determining the status of women, an indicator of the degree of inequality within the couple (Ware, Reference Ware1981; Safilios-Rotschild, Reference Safilios-Rotschild, Anker, Buvinic and Youssef1982; Cain, Reference Cain1984; Casterline et al., Reference Casterline, Williams and McDonald1986; Cain, Reference Cain and Federici1993; Mason, Reference Mason1984, Reference Mason and Jones1997). This age difference can also be considered an indicator of the nature of the marital bond, and thereby influences the couple's fertility expectations (Barbieri & Hertrich, Reference Barbieri and Hertrich2005). Difference in age has been shown to affect reproductive preferences and behaviours (Wolff et al., Reference Wolff, Blanc and Gage2000; Beegle et al., Reference Beegle, Frankenberg and Thomas2001; Barbieri & Hertrich, Reference Barbieri and Hertrich2005). However, no significant association was found between age difference and concordance in DWT. The effect of age difference between the spouses on spousal concordance in DWT was also not significant in the study conducted by Gebreselassie & Mishra (Reference Gebreselassie and Mishra2007) in sub-Saharan Africa.
Limitations of the present analysis need to be considered. First is the selectivity of couples studied. A comparison of the characteristics of the households in which couples were interviewed and households in which couples resided but interviews were not completed shows significant differences. Households without complete interviews for both spouses were more likely to be urban, belong to the highest two wealth quintiles, belong to Muslim religion or belong to socioeconomically advanced caste groups. Clearly better-off households were more likely to have incomplete couple interviews. Although it is difficult to make conclusions about the possible effect of such selection on the findings, it is possible to find some clues. The findings suggest a positive association between wealth quintile and overall percentage concordant. If such association were accounted for, the estimates of overall concordance presented in the paper would be lower than the true concordance. This would also be the case if such associations with other covariates were accounted for. So, the estimates of concordance presented in the paper can be considered as a lower bound to the true value. Despite the knowledge of this selection bias in the sample, it was impossible to adjust the results for such selection. The use of Heckman selection models was not possible because variables needed for the adjustment were not available for the couples who were not interviewed. Use of couple weights adjusts for non-response but assumes non-responders are like those in the same strata (state/urban–rural residence) who did respond so do not account for differences in response rates by socioeconomic status. Second, couples in which spouses disagree on wanting any more children were excluded from the analysis. This restricted sample could lead to bias but it is trivially small because the sample consisted of newlyweds and 99% of these couples desire a(nother) child. Another limitation of the study is the non-inclusion of marital duration in the computation of DWTs. There is a possibility that the DWTs in general will depend on marital duration. Since this analysis is based on only those couples who had a marital duration of 12 months or less than 12 months, the chances of such biases are limited. This can be verified from the fact that marital duration was insignificant in Table 2.
The results have important policy implications for the Indian Family Planning Programme, which has historically focused on female sterilization. Twenty-five per cent of husbands and 22% of wives wanted to wait longer than 12 months. Moreover, over 10% of couples had concordant desires to wait longer than 21 months. Of those couples, more than half were not using any contraceptive method (results not presented). While female sterilization is the most commonly used family planning method in India (IIPS & ORC Macro, 2007), the present analysis clearly shows a need for spacing methods among a proportion of newlyweds. These couples have largely been ignored in the family planning programme. The results contradict the general notion that newlyweds do not need contraception as they want to have children soon after marriage (Setty-Venugopal & Upadhyay, Reference Setty-Venugopal and Upadhyay2002). Many do require family planning methods to have longer intervals to first birth or to space a second birth. A recent study conducted among young men aged 15–29 and young women aged 15–24 in Maharashtra called for the need to develop appropriate strategies to reach young newlyweds (IIPS & Population Council, 2009). Further, among this study's discordant couples, husbands were more likely to want to wait longer than wives to have a birth, inconsistent with the findings of Gebreselassie & Mishra (Reference Gebreselassie and Mishra2007) from fourteen recent Demographic and Health Surveys (DHS) in sub-Saharan Africa, conducted during 1999 to 2004. Programmes could benefit by including newlywed husbands, which may help in promoting the use of spacing methods. Male involvement in family planning decisions and practice has been shown to be considerable (Drennan, Reference Drennan1998; Terefe & Larson, Reference Terefe and Larson1993; Wang et al., Reference Wang1998; Soliman, Reference Soliman1999; Varkey et al., Reference Varkey2004). Studies have also shown that providing men with information and involving them in counselling sessions can help them to be more supportive of contraceptive use (Wells, Reference Wells1997). Since childbearing occurs within couples in India, including both partners may be more appropriate than a focus on wives or husbands alone.
The ‘Satara Honeymoon Package’ Scheme launched by the Government of Maharashtra in ‘Satara’ district in 2008 to encourage newlywed couples to delay their first birth is very much in line with the findings of this study. The scheme aimed to locate newlywed couples and introduce them to a family planning scheme with a cash incentive; couples who delay their first child for 2 years are rewarded with approximately US$110 (Rs 5000.00) in cash. If they wait 3 years they receive US$167 (Rs 7500.00). A large number of couples have enrolled in this scheme. In the inception phase, it was the money that attracted newlyweds. But now, many have become aware of the associated health benefits for mother and child and thus are defying family pressures and are joining this scheme. Another benefit is that the newlywed couples get to know each other better during the ‘waiting period’ (http://www.ndtv.com/article/india/delay-having-baby-get-honeymoon-package). The Government of Maharashtra is considering extension of this scheme to other districts. The implementation of similar schemes in other parts of the country is likely to help this group in need of spacing methods for delaying first birth.