1. Introduction
Cleaner cooking has gained increased attention as a strategy for sustainable development in developing countries. The use of cleaner cooking fuels plays an important role in reducing adverse health and environmental consequences associated with traditional biomass use. Indoor air pollution from the use of biomass fuels is estimated to cause more than three million premature deaths annually (World Health Organization, 2018). A large number of studies also report negative health effects of using such fuels and have advocated for cleaner cooking as alternatives (Bede-Ojimadu and Orisakwe, Reference Bede-Ojimadu and Orisakwe2020). In response, several countries, such as Ecuador, Peru, Ghana, South Africa and India, among others, have taken measures to shift households' reliance on traditional cooking fuels to the use of cleaner fuels. Over the past decade and a half, countries have implemented various programs to encourage the use of cleaner fuels, such as liquified petroleum gas (LPG) for cooking.
Despite the policy interventions to promote cleaner cooking fuel usage, traditional fuels that cause indoor air pollution are widely used in many countries. For instance, in Ghana, the latest national survey, Ghana Living Standards Survey VII, shows that about three-quarters (74.64 per cent) of households still use biomass cooking fuels as their primary choice. Recent research further points out that the policy to promote LPG usage in rural areas has no suggestive effect in shiftingFootnote 1 from biomass fuels to LPG use in some areas (Asante et al., Reference Asante, Afari-Asiedu, Abdulai, Dalaba, Carrion, Dickinson, Abeka, Sarpong and Jack2018; Adjei-Mantey and Takeuchi, Reference Adjei-Mantey and Takeuchi2019). Empirical studies in India also suggest that the use of biomass cooking fuels persists despite the program to subsidize cleaner cooking fuel use (Malakar et al., Reference Malakar, Greig and Van de Fliert2018; Gupta et al., Reference Gupta, Vyas, Hathi, Khalid, Srivastav, Spears and Coffey2019). Further investigation is required to provide relevant insights to shape policy and intervention strategies for promoting cleaner cooking fuels across developing and emerging economies.
The existing literature has investigated the drivers for adopting cleaner cooking fuels in developing countries. According to a review by Lewis and Pattanayak (Reference Lewis and Pattanayak2012), there are three categories of drivers: the price of cleaner and biomass fuels; socioeconomic status (e.g., income, education and location); and demographic variables (e.g., age and household size). However, much of the related quantitative research examines only a few factors, such as income, education and family size, which are proxies for the complex process of technology adoption. Moreover, less attention has been paid to sociopsychological factors that can play a substantial role in the adoption of energy-efficient technologies (Qiu et al., Reference Qiu, Colson and Grebitus2014).
This study fills the gaps in the research by exploring the role of behavioral factors in determining cooking fuel choices. Specifically, we examine whether individual preferences for risk and time affect the choice of the primary cooking fuel between traditional and modern fuels. According to the behavioral economics literature, psychological factors influence a broad range of human decision-making scenarios. Bounded rationality, loss aversion and bias toward the status quo are psychological reasons why individuals and households make seemingly unreasonable choices (Angner and Loewenstein, Reference Angner, Loewenstein and Uskali2012). Psychological factors affect decision-making with regards to consumption and saving (Dioikitopoulos et al., Reference Dioikitopoulos, Ghosh, Karydas and Vella2020), agriculture (Asravor, Reference Asravor2019), finance (Van Raaij, Reference Van Raaij2016), and adoption of information technology (Sriyabhand and John, Reference Sriyabhand and John2014).
Regarding the adoption of energy-efficient technology, behavioral factors, such as inertia and aversion to loss or risk, could act as barriers (Hesselink and Chappin, Reference Hesselink and Chappin2019). The shift from traditional cooking fuel, such as firewood, to LPG involves some level of risk that may invoke inertia or a resistance to adopt new technology for risk-averse households. First, there is a risk of unavailability of LPG when a household needs it. It poses a substantial risk, particularly in low- and medium-income countries, where the supply chain of fuel is unstable. If there is a gas shortage at the nearest refill station, it means that this household cannot have fuel for cooking. The second risk factor for households is price volatility. The price of LPG is heavily influenced by the exchange rate and crude oil prices. Owing to the high volatility of these factors, the price inevitably fluctuates. Price volatility is not a concern if the household uses firewood, since it is often available free of charge to many households although with a substantial time cost. Third, the safety of using LPG is a matter of concern, which has been fueled by historical and recent cases of gas explosions at both residences and refill stations. To avoid potential explosions associated with LPG use, risk-averse individuals avoid choosing LPG. For the abovementioned reasons, we hypothesize that risk-averse individuals are less likely to choose LPG as their cooking fuel.
The contribution of this study is two-fold. First, we empirically examine the role of behavioral factors in the choice of household cooking fuel. Studies on the determinants of household cooking fuel in developing countries mostly focus on socioeconomic factors, such as income or poverty levels, education or literacy, rural or urban location of household, access to infrastructure, and supply of the fuels (see Karimu, Reference Karimu2015; Mensah and Adu, Reference Mensah and Adu2015; Karimu et al., Reference Karimu, Mensah and Adu2016). To the best of our knowledge, only a few studies (such as Yu, Reference Yu2011; Brooks et al., Reference Brooks, Bhojvaid, Jeuland, Lewis, Patange and Pattanayak2016) explore the role of behavioral factors in choosing cooking fuel. By accounting for risk preferences, this study reveals important behavioral factors that should be considered in any cleaner fuel promotion policy. Second, we investigate whether the impact of risk aversion can be mitigated by improving supply reliability. Although several studies point out the importance of fuel availability in the promotion of LPG, the underlying mechanism of psychological factors has not been well-examined in the extant literature. By exploring the effect of improving fuel availability on risk-averse individuals, our study provides significant implications for understanding how policy intervention works among heterogeneous households.
The remainder of this paper is organized as follows. Section 2 explains the risk associated with LPG use in Ghana. Section 3 reviews previous studies related to the topic. Section 4 describes the data and the empirical methodology. Section 5 presents the estimation results and discusses their interpretations. Section 6 provides additional analyses to check the validity of the risk and time preference measures. Section 7 concludes and provides policy implications.
2. Risks associated with LPG use in Ghana
In this section, we provide an overview of the three kinds of risks of choosing LPG in the context of households in Ghana: unstable supply, volatile prices and explosive accidents.
First, LPG is supplied to a household at refill stations located in different parts of the country. A household must find a refill station convenient to them and refill their cylinders when they run out of the fuel. These refill stations are mostly privately owned and managed on a purely commercial basis. Thus, the specific location of a refill station tends to be more influenced by commercial and profit-making motives than by equity concerns. The refill stations operate under the regulation of the National Petroleum Authority (NPA), the regulatory body for the downstream petroleum sector in Ghana. The NPA issues licenses for the setting up and operation of LPG refill stations. The total number of refill stations in the country increased from 310 in 2011 to 653 by the end of 2018. While an increase of 110 per cent over the period appears impressive, the number is hardly sufficient.
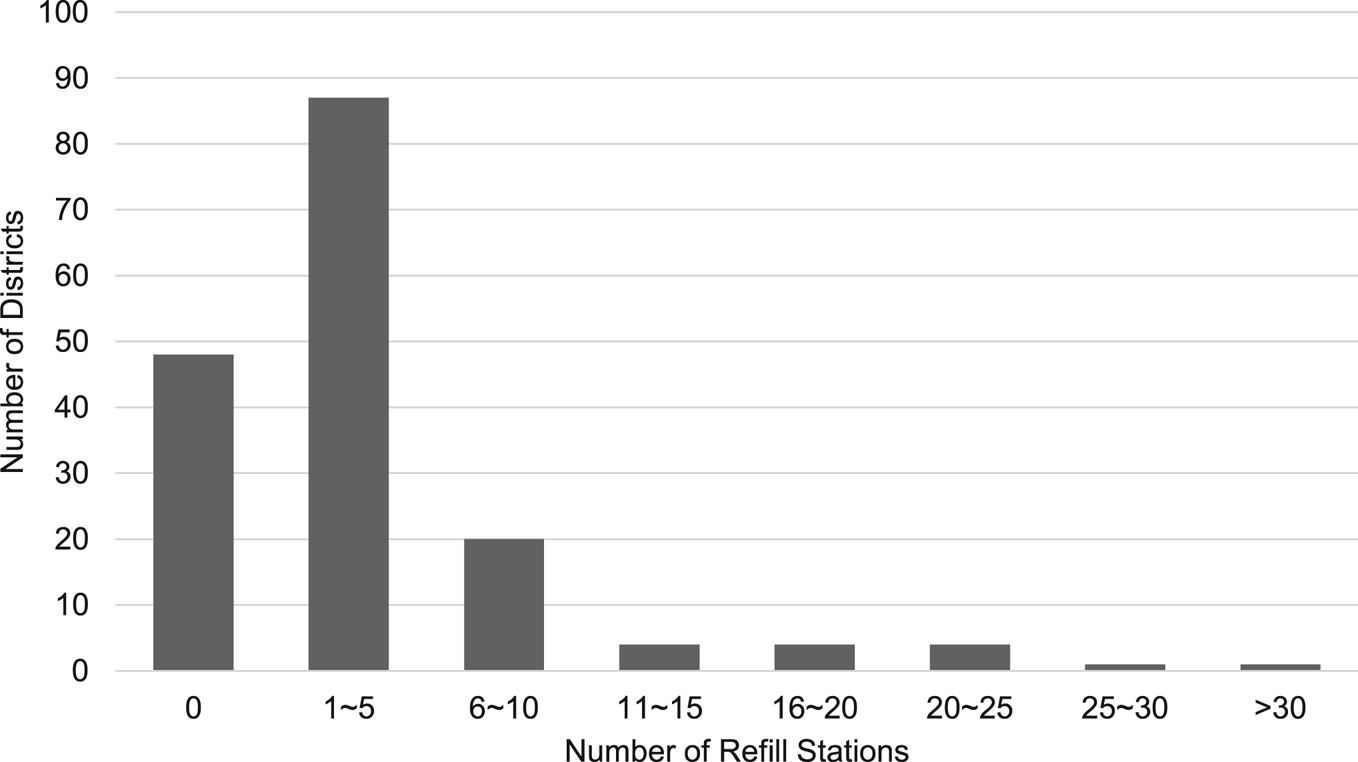
Figure 1 shows the distribution of refill stations among districts. Out of 170 districts in Ghana, 48 districts have no LPG refill stations at all as of 2018. Any household that adopts LPG in these districts must travel to the nearest district with a refill station. Even a person who lives in a district where there is a refill station could be living quite far from the location, and commuting to refill may be inconvenient. In 88 districts, there are up to five refill stations but 30 out of these districts had only one refill station. Thus, while the number of refill stations may have increased significantly over time, households in districts with fewer number of stations would consider that it is risky to switch their primary fuel from traditional ones to LPG. Furthermore, there is historical evidence of households facing LPG shortages. Asamoah et al. (Reference Asamoah, Amoakohene and Adiwokor2012) report that many consumers revealed that they have experienced shortages between four and eight times a year.
Distribution of LPG refill stations by number of districts.
Notes: The figure covers 170 districts. This is the total number of districts that existed in Ghana before a recent re-demarcation and creation of new districts increased the number of districts to the current 254. In some cases, the data from the NPA did not reflect the newly created districts and, hence, this study maintains the count of refill stations to cover the 170 districts that existed at the time.
Source: Authors' computation using NPA data for 2019.

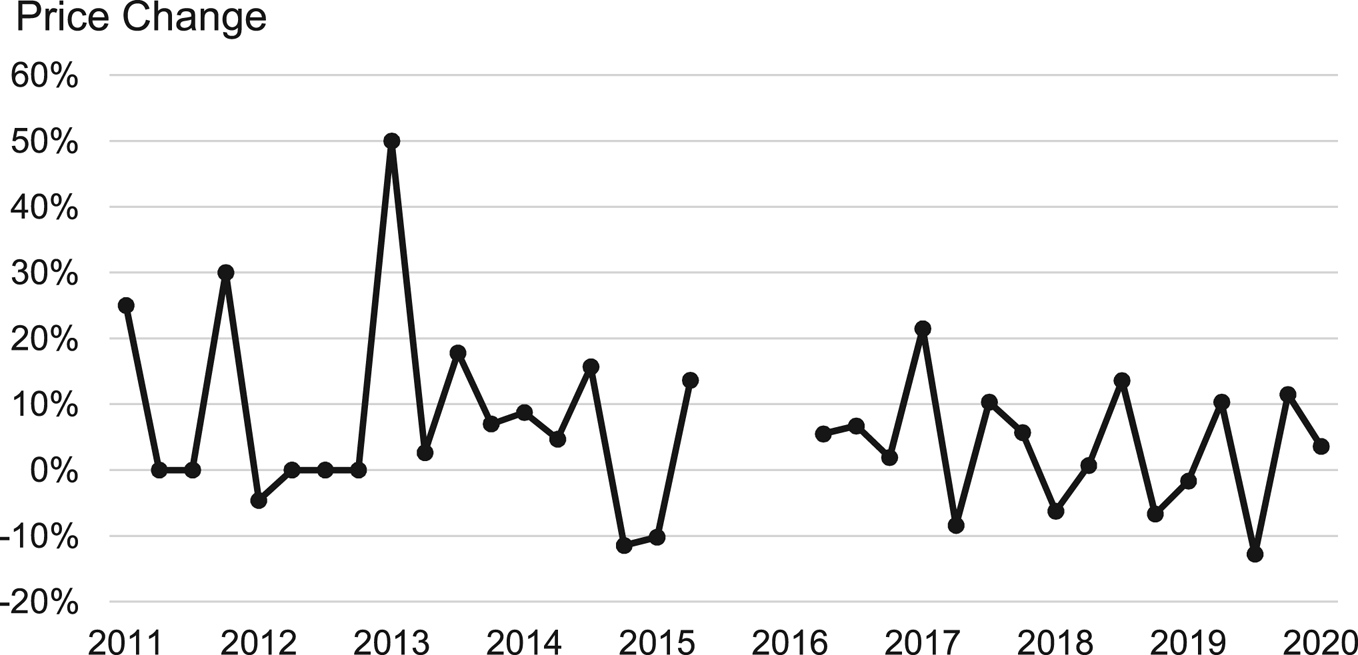
Second, LPG prices have exhibited volatility even though they have historically been determined through government policy. The government used to set the end user price of LPG per kilogram (kg), as was the case with other petroleum products. These prices were then reviewed occasionally. The government-determined prices of LPG were subsequently subsidized to cushion users and to encourage their use. In July 2015, the government of Ghana deregulated the downstream petroleum sector and withdrew from direct price setting, and abolished subsidies on LPG and other petroleum products as a fiscal stability measure. Since then, the prices of LPG have been determined by suppliers based on such factors as the price of crude oil, exchange rate, and taxes and special levies. Irrespective of the body that sets the prices, price volatility remains. This is mostly due to the volatility in the input factors for price determination, particularly exchange rates and crude oil prices. Figure 2 depicts quarterly changes in LPG prices from 2011 to the first quarter of 2020.Footnote 2 For risk-averse households, price volatility could be a disincentive to adopt LPG as their primary cooking fuel.
Quarterly change in LPG price, 2011–2020.
Note: Data for 2015 Q3, Q4, and 2016 Q1 are unavailable.
Source: Authors' computation from NPA data, 2020.

Third, the risk of an LPG explosion is well known in Ghana. There were 10 major reported explosions between 2014 and 2018, leading to 33 fatalities (Meteku et al., Reference Meteku, Ankudey and Ocran2019). According to the risk assessment conducted by the NPA, 77.4 per cent of LPG stations in the country do not meet safety standards (NPA, 2019; Reportingoilandgas, 2019). The safety issue is recognized by households as a serious risk in the adoption of LPG. Dalaba et al. (Reference Dalaba, Alirigia, Mesenbring, Coffey, Brown, Hannigan, Wiedinmyer, Oduro and Dickinson2018) interviewed households in the Kassena-Nankana districts in northern Ghana. They found that most households expressed concerns about the safety of LPG: 85 per cent of rural households and 80 per cent of urban households agreed that cooking with LPG was dangerous. On the other hand, firewood and charcoal are less likely to lead to explosions in the home. If fire from wood fuels gets out of control, households find it easier to douse the flames than those from an LPG fire that gets out of control due to the chemical composition.
3. Literature review
Although the literature on the determinants of cooking fuel choice in developing countries is vast, only a small number of studies have dealt with the role of risk aversion.Footnote 3 For example, Brooks et al. (Reference Brooks, Bhojvaid, Jeuland, Lewis, Patange and Pattanayak2016) investigate the impact of cleaner cookstoves on biomass fuel use, time spent collecting biomass fuel, and cooking time in two Northern Indian states. Their analysis uses a measure of risk aversion that consists of an indicator for whether the household owns a toilet or not. They find that risk aversion was positively correlated with the adoption of cleaner cookstoves both during the period of data collection and the week prior, while most risk-taking households were less likely to have used cleaner cookstoves in the week prior to the study period but had no significant effect in the study period. However, the authors acknowledge that their measure of risk aversion is crude, calling for further investigation into the role of risk preferences in adopting cleaner stoves. Toilet ownership might be loosely associated with risk preferences. It might be influenced by a host of other factors, especially in rural settings in low-income countries, and hence, might not appropriately represent risk preferences. This argument notwithstanding, the findings point to the potential influence of the risk preferences of households on cooking fuel choices. Heutel (Reference Heutel2019) explores how prospect theory explains people's decision to invest in energy efficiency, a decision associated with considerable uncertainty. Using choice experiments with a sample from the US population, the study finds that loss/risk-averse individuals are less likely to invest in energy efficiency, such as buying energy-efficient light bulbs or vehicles. Heutel (Reference Heutel2019) asks a set of lottery questions to measure risk aversion following Tanaka et al. (Reference Tanaka, Camerer and Nguyen2010). The two studies discussed above differ significantly in their contexts. Brooks et al. (Reference Brooks, Bhojvaid, Jeuland, Lewis, Patange and Pattanayak2016) focus on India, a country where cooking fuel is a key component in household energy decision-making. Heutel's (Reference Heutel2019) study is based in the US, a high-income country, and focuses on household appliances and vehicles rather than on cooking fuel. Nevertheless, both studies show that risk/loss aversion is important in household energy choices.
Atmadja et al. (Reference Atmadja, Sills, Pattanayak, Yang and Patil2017) examine how personal discount rates affect the environmental health behaviors of households in rural India. The personal discount rate is a measure of time preference or impatience that explains how households view current costs in relation to future benefits. A high discount rate implies that the individual significantly discounts future benefits of an investment, thereby rendering the present value of benefits low. This leads to low uptake of such investment, as the costs of investing in the activity would often be higher than the present value of the benefits. The study finds a significant and negative relationship between discount rates and environmental health behaviors, such as using mosquito bed nets, using latrines, adopting cleaner cooking fuels, treating drinking water, and even hand washing before eating and after using the toilet, which comes at a lower cost to the household. Simply put, people with high discount rates are less likely to invest in environmental health behavior, including cooking fuel choice.
The importance of psychological factors in the context of fuel choice is also confirmed by studies using field experiments. Yu (Reference Yu2011) investigates how stove and behavioral interventions impacted acute respiratory infections (ARIs) in children aged under 5 years in China. Behavioral interventions employed in this field experiment included providing education on the health risks associated with indoor air pollution and how to minimize exposure through alternative behavior. Specifically, education was provided on the sources of exposure, including sources attributed to behavior, health hazards of exposure, how stove and ventilation improvements reduced exposure, alternative behavior for stove use, and maintenance and stove use practices, including ways to handle fuel. The study finds a significant reduction in ARI among the treatment groups. Notably, the significant effect was more likely attributable to improved practices associated with stove use and better behavior to avert exposure than to improved cookstoves. Results from Atmadja et al. (Reference Atmadja, Sills, Pattanayak, Yang and Patil2017) and Yu (Reference Yu2011) suggest that a policy intervention to promote cleaner cooking would have a greater effect if it paid attention to how psychological factors work among heterogeneous households.
Our study is also related to the strand of literature on the availability of cleaner cooking fuel. For example, Karimu et al. (Reference Karimu, Mensah and Adu2016) investigate the socioeconomic factors that affect the adoption of LPG as the main cooking fuel in Ghana. Along with the strong effect of price and income, they find that a reliable supply of LPG significantly affects the probability of adoption. Sankhyayan and Dasgupta (Reference Sankhyayan and Dasgupta2019) focus on the role of affordability and availability in the transition to modern fuel in India. Their results suggest that affordability is more dominant than availability: states with higher per capita incomes and literacy rates had greater access to LPG, while availability of the fuel was not an important driver of its adoption. However, their indicator of availability might not adequately capture the supply reliability. They measure availability with two variables: the number of LPG distributors per 1,000 square kilometer (km2) and road density. These measures of availability could be quite different from the experiences of households in their bid to use LPG. For example, if a 1,000-km2 area has a specified number of distributors, albeit concentrated in a particular place and quite far from places of residence, the real experiences of households would likely vary with their locations. This could partly explain why LPG availability does not appear as an important variable in their study.
By contrast, Dendup and Arimura (Reference Dendup and Arimura2019) conduct a study in Bhutan and find that distance to the nearest market negatively affects the choice of LPG. They interpret the distance to the market as the access to cleaner energy, because households typically refill their empty LPG cylinder at the distribution depot located in the nearest market. Dalaba et al. (Reference Dalaba, Alirigia, Mesenbring, Coffey, Brown, Hannigan, Wiedinmyer, Oduro and Dickinson2018), meanwhile, find that distance to the refill station is not a significant predictor of LPG ownership. Jagger and Jumbe (Reference Jagger and Jumbe2016), in a study on the adoption of improved cookstoves in Malawi, find that households that had crop residue constituting a high share of cooking fuel tended to adopt improved cookstoves. Households with this feature typically belonged to the lowest income group. A large share of crop residue in household cooking fuel implied the scarcity of fuelwood or the lack of access to it and, consequently, higher odds of adopting improved cookstoves. However, household forest ownership increased the adoption of improved cookstoves, signaling a desire to conserve its own forest resources. This implies that availability of wood for fuel had different impacts on the adoption of improved cookstoves depending on the household's resource ownership.
While the abovementioned studies incorporate the subjective or objective measure of availability in their model in explaining the adoption of cleaner cooking fuel, they do not address how availability matters to households with different risk preferences. This study fills the gap in the literature by examining how risk preference interacts with the availability of cleaner cooking fuel.
4. Data and methodology
4.1 Data
The data for this study mainly come from the seventh round of the Ghana Living Standards Survey (GLSS VII). The GLSS comprises nationwide individual- and household-level surveys that collect data on demographics, and economic and social variables. It is conducted through face-to-face interviews and remains the most comprehensive source of household-level data in Ghana in terms of coverage and scope. The Ghana Statistical Service (GSS), a public agency with the necessary autonomy, conducts these surveys and provides official data on Ghana's economy. Enumeration areas (EAs) are defined by the GSS as the primary sampling unit and stratified among the administrative regions of the country to reflect the regional populations. From these EAs, households are selected as the secondary sampling unit. The survey for GLSS VII ended in October 2017, covering over 14,000 households and more than 55,000 individuals. Because our main interest is in the cooking fuel choice of the household, this study uses responses from household heads and their spouses as the major decision-makers in a household. This study sources data for all but two variables from GLSS VII. Data on the ease of availability of LPG in the recent past within the district a household resides come from GLSS VI (2012/2013), while data on the number of LPG refill stations in each district are from the NPA (2019).
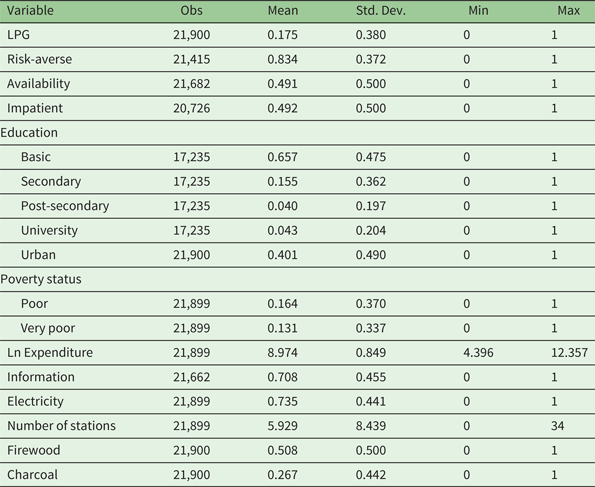
Table 1 reports the summary statistics. Risk preference is a binary variable, with 1 being risk-averse, and 0 otherwise. Individuals are considered risk-averse if they choose to (1) invest in a business where no loss of money is assured but would make low profits, over (2) investing in a business where there is a small chance of losing money but potentially brings high profits. The majority of the sample (83 per cent) are risk-averse. Largely, the respondents showed consistency in risk preferences in their responses to other risk-related questions. About half of the respondents in the sample (49 per cent) are impatient. They prefer current benefits to future benefits all the time. A household is impatient if its members exhibit no preference for receiving a benefit in the future compared to the present. LPG is used by less than one-fifth (17 per cent) of the respondents and was perceived by respondents to be easily available for purchase in the districts of residence of about half (49 per cent) of the sample. Besides LPG, other major cooking fuels used by households as primary fuels are firewood and charcoal, representing 51 per cent and 27 per cent of the respondents, respectively.
Summary statistics

Information access, measured by ownership of a functional television or radio set, and electricity are available to a considerable proportion (71 and 74 per cent, respectively). Ability to pay of household is measured by the poverty status classified by ‘non-poor’, ‘poor’ and ‘very poor’. ‘Poor’ and ‘very poor’ households make up 16.4 and 13.1 per cent of the sample, respectively, and about two-thirds of the sample is ‘non-poor.’ It is measured as a categorical variable based on daily subsistence. ‘Very poor’ households are those below the lower poverty line of Ghȼ982 per adult equivalent per year, while ‘poor’ households live above the lower poverty line but below the upper poverty line of Ghȼ1,760 per adult equivalent per yearFootnote 4 (Ghana Statistical Service, 2018). ‘Non-poor’ households, used as the reference category in the empirical analysis, are households that live above the upper poverty line. The lower poverty line represents the minimum amount needed to meet the nutritional requirements of a household member. Living below that amount suggests that even if the entire household budget were allocated to food, it would not be enough to meet the minimum nutritional requirement. The upper poverty line captures what is needed for both essential food and non-food consumption. Thus, households whose members can live above the upper poverty line are considered non-poor, since they can meet their basic nutritional and non-food needs. In-between the very poor and non-poor are poor households, whose members have enough to satisfy their minimum nutritional requirements but not enough to meet all basic non-food consumption needs. As an alternative measure of ability to pay, we replace poverty status with the natural log of annual household expenditure, used as a proxy for income in our main analysis.
In Ghana, LPG users go to a refill station to refill a cylinder when out of gas. Therefore, one of the factors that would be key to potential users would be whether it would be easy to purchase LPG to refill their cylinders. These refill stations are mostly privately owned, commercially run businesses and hence, the decision on where to site them is influenced by economic reasons. A household inevitably considers the availability of LPG within their locality of dwelling, and the possibility of fuel shortage in the future will affect their decision to switch to LPG. To capture this effect, we used two variables. The first is the number of LPG refill stations located in the district where the household lives at the time of the survey. This data was obtained from the NPA and contains only the total numbers of stations in each district without further geographical information of the stations within the district. The second measure, used as a secondary analysis, is the self-reported estimation of the availability of LPG within the district of residence in the recent past from GLSS VI.Footnote 5 The availability variable captures responses to the question on whether households found LPG available whenever they tried to purchase it in the past 12 months. Since the question is premised on households actually trying to purchase the fuel, responses capture their actual experiences rather than simply their perceptions about availability. Thus, the self-reported measure of LPG availability within a district is measured by the average response of only persons who did try to purchase LPG over the period. By using the number of refill stations located in their district, in addition to households' experiences of availability of LPG when they attempted to purchase it, we capture how easily available LPG is to the average household in the dataset.
A potential limitation of this study is the absence of LPG price in the estimation model. While there is limited data availability, the prices of petroleum products in Ghana are largely the same across different suppliers. In other words, all households face similar prices from suppliers. Karimu et al. (Reference Karimu, Mensah and Adu2016) demonstrate that omitting the variable does not significantly change the results of their research. In Ghana, the distance to a refill station is likely to represent a more relevant differential cost of LPG to households. Hence, it is potentially of greater importance for their decision-making about primary cooking fuel. Sankhyayan and Dasgupta (Reference Sankhyayan and Dasgupta2019) also find that price was not a significant determinant in the uptake of LPG as cooking fuel. Thus, the evidence suggests that exclusion of LPG price from the model might not decrease the validity of the analysis. Furthermore, by the nature of the question asked in the survey, this study is constrained to measure risk aversion as a dichotomous variable rather than an ordinal measure of the degree of risk aversion. Lastly, the inability to include a measure of variability in LPG availability in our analysis is a potential limitation, the inclusion of which may be a useful addition for future work.
4.2 Conceptual model and empirical methodology
The theoretical underpinning of this study is the random utility theory, which assumes that the utility derived from the consumption of any commodity (cooking fuel) depends on observable and unobservable factors. A household, i, chooses from j cooking fuels where the bundle j includes cleaner fuel – in this case, LPG – and biomass fuels. Thus, with j options of cooking fuel available to the household, the household chooses LPG if the utility derived from using LPG (ULPG) exceeds the utility from dirty fuels (Ubiomass), as follows:

Therefore, we specify a model for explaining LPG choice as follows:

where R is risk aversion, S is the availability of fuel, X denotes the other factors that might affect the choice, such as poverty status, level of education, and access to information, and $\varepsilon$ is the idiosyncratic error term. We interact risk aversion with the availability of LPG to understand how the effect of an individual's risk preference can be managed practically by a policy to promote a choice for LPG.
Haushofer and Fehr (Reference Haushofer and Fehr2014) suggest a potential association between poverty and risk aversion. They argue that poorer households tend to be less willing to take risks and more likely discount future benefits. However, a correlation test of our explanatory variables shows that while a positive association is observed between poverty and risk aversion, the association is weak (coefficient: 0.006); see table A1 in the online appendix. Concerning education, a coefficient of −0.066 suggests that more educated people tend to be less risk-averse, but the association is not strong either. Thus, our empirical model assumes that the risk preference is unrelated to socioeconomic status. As previously mentioned, this is useful for the formulation of cleaner cooking policies.
The empirical model incorporates various factors that may influence the adoption of cleaner cooking fuels. Time preference is another behavioral trait that captures individuals' levels of patience or preference for current over delayed benefits. Since reduced firewood use brings delayed benefits of future health improvement, households with lower time discount are more likely to choose cleaner fuels. Regarding socioeconomic variables, LPG availability represents the ease of obtaining the fuel and is expected to influence its use positively. Affordability plays a substantial role in household fuel choice decisions. Because of the initial cost for switching to clean cooking fuels, poverty can be a strong constraint on adopting LPG as the primary cooking fuel. Thus, poorer households are less likely to choose LPG. More educated people are expected to know the benefits of using modern fuels and are more likely to choose LPG.
Having access to information gives households the opportunity to learn about the dangers of using traditional fuels. In addition, through media campaigns on radio and TV, households learn about safe ways to handle and use LPG. As a result, the fears associated with LPG use are mitigated through their access to information. At the time of this study, the NPA in Ghana was sponsoring campaigns on radio and TV to educate the population on how to use LPG safely. Therefore, owners of a radio or TV can benefit from these informational campaigns. Living in an urban area is expected to positively impact the choice of LPG compared to a rural location. Urban centers tend to have less supply of wood fuel. In addition, urban locations have better LPG supply infrastructure, including access roads, thereby making the distribution of LPG easier in such areas. Similarly, having access to modern infrastructure, such as electricity, is expected to influence the choice of LPG positively. The probit estimation technique is employed to estimate equation (1). We perform a correlation test of the variables, and it shows no strong correlation among any of the explanatory variables.
5. Results and discussion
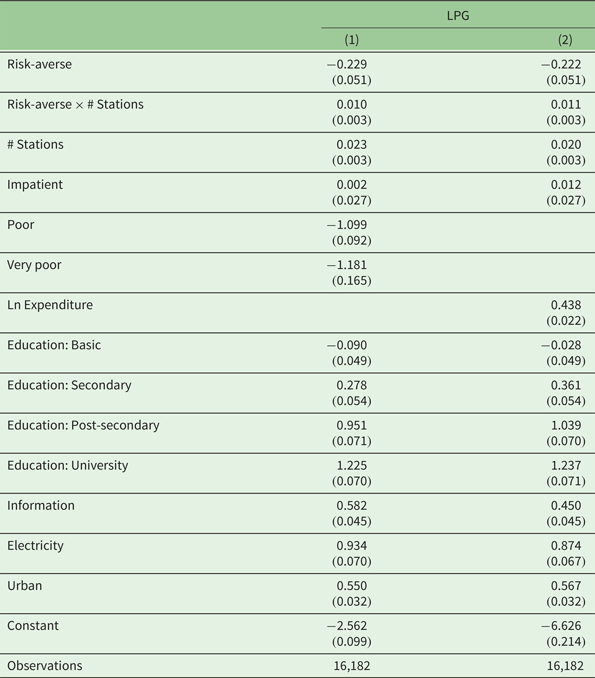
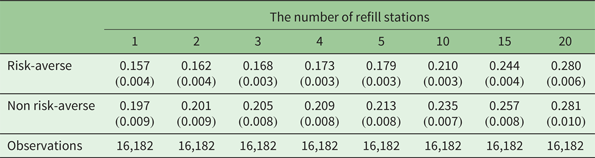
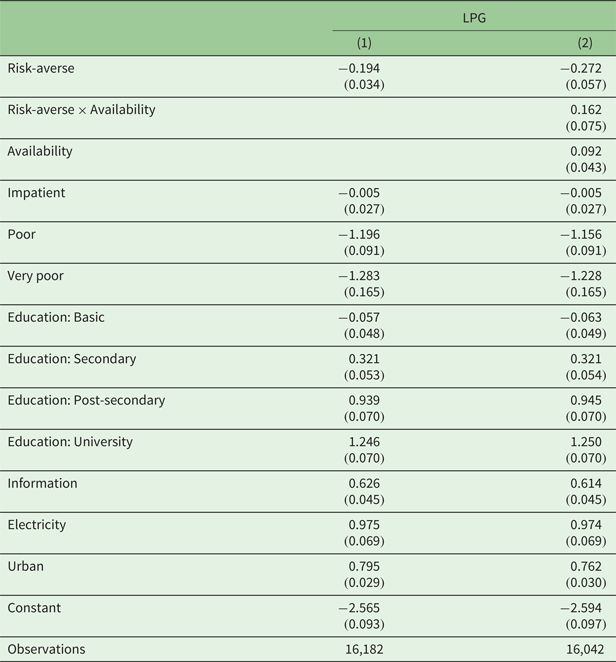
Table 2 shows the results from the probit estimation of equation (1). The results are robust whether poverty (column 1) or expenditure (column 2) is used to measure households' ability to pay for LPG.Footnote 6 Table 3 shows the probabilities of choosing LPG as the primary fuel for risk-averse and non-risk-averse households evaluated at a range of refill stations in the district. The predicted probabilities have been calculated from model (2) of table 2, which is the model that uses expenditure as a proxy for income. Table 3 reveals that risk-averse households have a lower probability of choosing LPG as primary cooking fuel compared to non-risk-averse households. Furthermore, table 3 shows that, as the number of refill stations in the district increases, the probability of choosing LPG as the primary cooking fuel also increases both for risk averse and non-risk-averse households but increases at a faster rate for risk-averse households. With one refill station in the district, risk-averse households have a probability of 15.7 per cent of choosing LPG as their primary fuel. The probability rises to 21 per cent if there are 10 refill stations and to 28 per cent with 20 refill stations. For non-risk-averse households, the corresponding probabilities are 19.7, 23.5 and 28.1 per cent, respectively.
Probit estimates of choice of LPG as a primary cooking fuel

Notes: This table shows the results of probit estimation, with standard errors in parentheses.
Predicted probabilities of choosing LPG for risk averse and non-risk averse households

Note: Standard errors in parentheses.
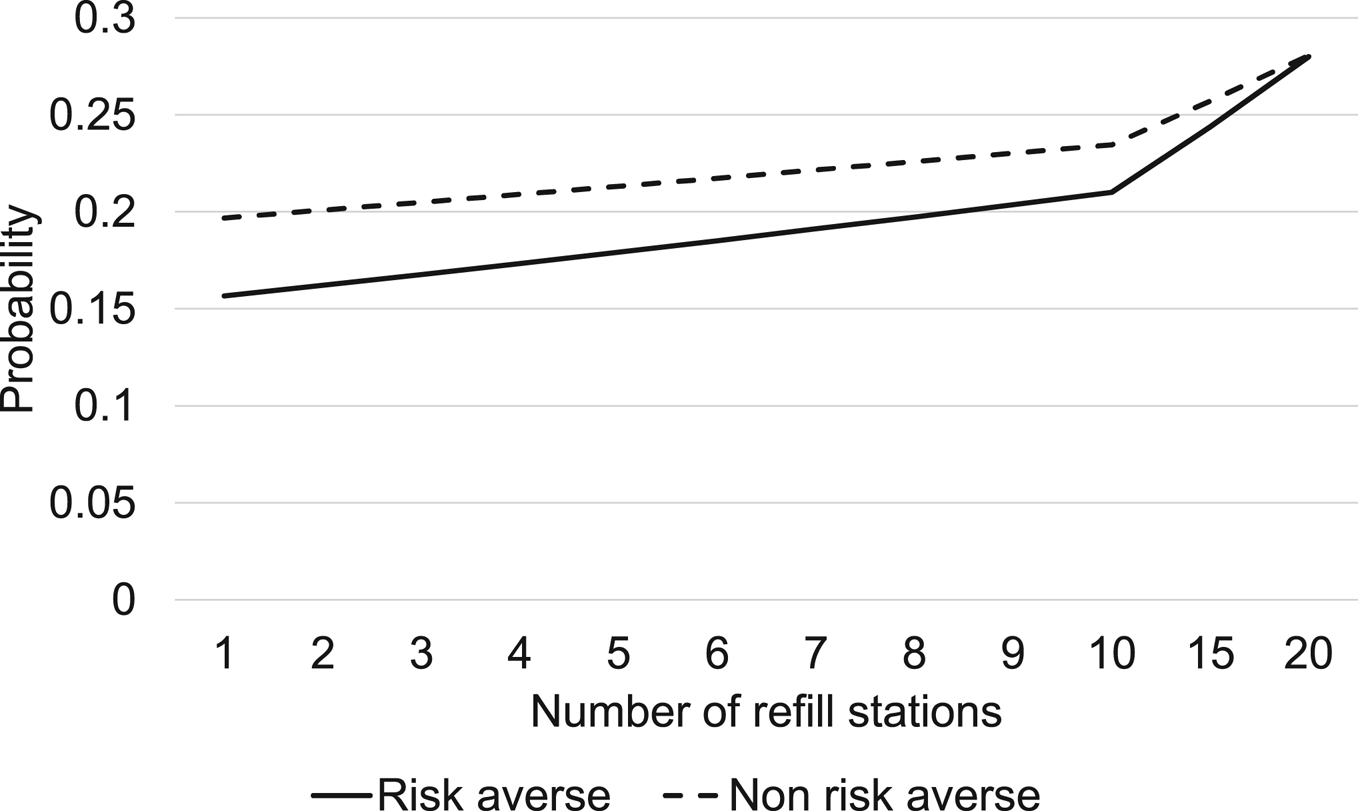
Figure 3 shows the probabilities of LPG for a wider range of number of refill stations. The implication for policy is quite clear: building an additional refill station in a district increases the probability of LPG adoption as the primary fuel by at least 0.5 percentage points. This affirms the findings of Adjei-Mantey et al. (Reference Adjei-Mantey, Takeuchi and Quartey2021) on how shorter distances to LPG refill stations promote LPG use. Given that the majority of Ghanaians (83 per cent of the sample) are risk averse, this could yield substantial impacts at the national level. The result is consistent with our expectations that risk aversion hampers LPG usage. In contrast to the robust relationship between risk aversion and LPG usage among model specifications, time preference does not have any significant effect on the probability of choosing LPG.
Probability of LPG adoption at a range of refill stations.

From table 2, LPG availability has a positive effect on the likelihood of choosing LPG, in line with previous findings (Mensah and Adu, Reference Mensah and Adu2015; Karimu et al., Reference Karimu, Mensah and Adu2016). For the interaction between availability and risk aversion, the estimated coefficient suggests that the effect of availability becomes even higher for risk-averse households. The availability of LPG in their locality can increase their chances of choosing LPG. Thus, even though risk aversion prevails as a behavioral or natural trait, its negative impact on LPG usage can be partially offset by ensuring a stable supply. The result agrees with the general observation by Godoe and Johansen (Reference Godoe and Johansen2012) that personality dimensions and system-specific dimensions are important in adopting new technology. Our results differ from those of Sankhyayan and Dasgupta (Reference Sankhyayan and Dasgupta2019), who find that availability is insignificant in determining the uptake of LPG. Their study measured availability using two variables: the number of LPG distributors per 1,000 km2 and road density. Our measure of availability is based on the number of refill stations within each district and might reflect each household's access to LPG more precisely. This could partly explain why the effect of LPG availability is different.
Access to electricity and the ownership of a functioning radio or TV set enhances LPG usage. The coefficients are 0.87 and 0.45 which translate into marginal effect estimates representing increases in probability of LPG adoption by 12.4 and 7.5 per cent, respectively. Radio and TV programs provide an opportunity for households to know about the benefits of cleaner cooking fuel. Access to information can lead them to choose LPG. Additionally, anxiety about the safety of LPG use can be alleviated through the information obtained from these media. Kumar et al. (Reference Kumar, Rao and Reddy2016) and Dendup and Arimura (Reference Dendup and Arimura2019) also find information and awareness to be crucial in the adoption of LPG, while Sehjpal et al. (Reference Sehjpal, Ramji, Soni and Kumar2014) notes that household access to electricity could have an indirect positive effect on the choice of cleaner cooking fuels. Poverty, education, and urban location influence the choice of cleaner cooking fuel. Compared to the non-poor households, the poor and very poor households are less likely to choose LPG. A similar result is obtained when income is proxied by expenditure. Higher household expenditure is positively linked to the likelihood of adopting LPG with a marginal effect of 0.084. As opposed to no formal education, a higher level of education is associated with a greater likelihood of choosing LPG. Households in urban areas tend to choose LPG. These findings are consistent with those of previous studies, such as those by Karimu (Reference Karimu2015) and Pope et al. (Reference Pope, Bruce, Higgerson, Hyseni, Stanistreet, MBatchou and Puzzolo2018).
In summary, our results suggest that appropriate measures can reduce the negative impact of risk aversion on the probability of choosing LPG as the primary cooking fuel. First, making LPG easily and readily available can increase LPG usage, particularly for those who are risk averse. Second, policy actions, such as information provision through radio or TV notices, and nudges could be an effective way to give households a better impression of LPG use and ultimately help them to adopt it.
Finally, a development strategy that simultaneously provides modern infrastructure, modern fuels, and information and communication media will increase the household's chances of choosing LPG and reduce the impact of risk aversion. We further examine several analyses to confirm the robustness of our results. We replace the number of refill stations with the subjective assessment of LPG availability in each district. Table 4 reports the probit estimation results when the self-reported measure of LPG availability in each district is used. The results are in line with the main results. The effect of risk aversion on choosing LPG is negative and significant while increasing availability has a positive relationship with LPG choice even for risk-averse households.
Probit results: LPG choice

Notes: This table shows the results of probit estimation, using the subjective estimation of availability. Standard errors in parentheses.
6. Additional analyses
We carried out analyses to check whether the variables for risk and time preferences play a role in the decision-making of other activities that contain some degree of risk. The rationale for these additional analyses is to confirm the validity of our measures for risk and time preferences. In other words, we investigate whether these behavioral indicators help explain other household decision-making that entails considerable risk and uncertainty. If these variables are significant determinants for other household choices, it would provide supportive evidence for our choice of preference indicators. The results are summarized in table 5.
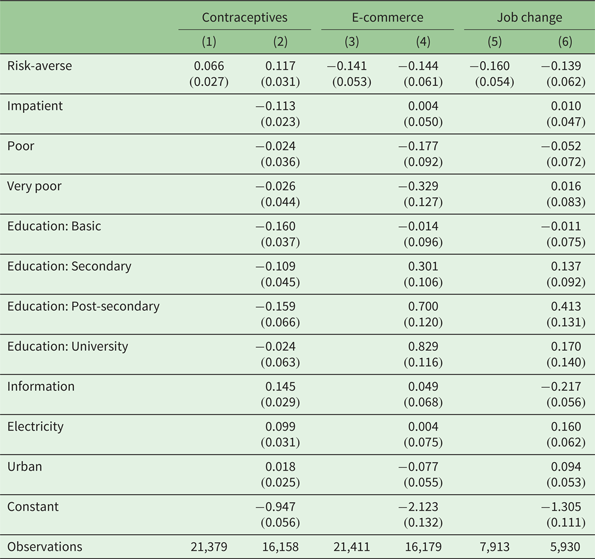
Other potentially risky events

Note: This table shows the results of probit estimation, with standard errors in parentheses.
We examined three household behaviors: contraceptive use, e-commerce adoption and job change. Risk-averse individuals are likely to use contraceptives to delay or prevent pregnancy, while impatient people are likely not to use them. Risk-averse people are less likely to use e-commerce, probably due to their apprehensions regarding online security and system reliability. Online shopping is very different from traditional face-to-face business. Risk-averse people are also less likely to change jobs. Once people are accustomed to their jobs, they become less willing to seek to change jobs, all things being equal. The question on job change was asked only of people who had indicated that they wished to have a job change, and hence, had fewer observations than those of the other models. The results in table 5 show that risk aversion affects these three areas of decision-making in the way expected above. Risk-averse individuals tend to use contraceptives and to avoid e-commerce, and do not tend to change their jobs. The results suggest that individuals' decision-making depends on their risk preferences. This finding provides evidence that supports the validity of the risk-aversion variable used in the main analysis.
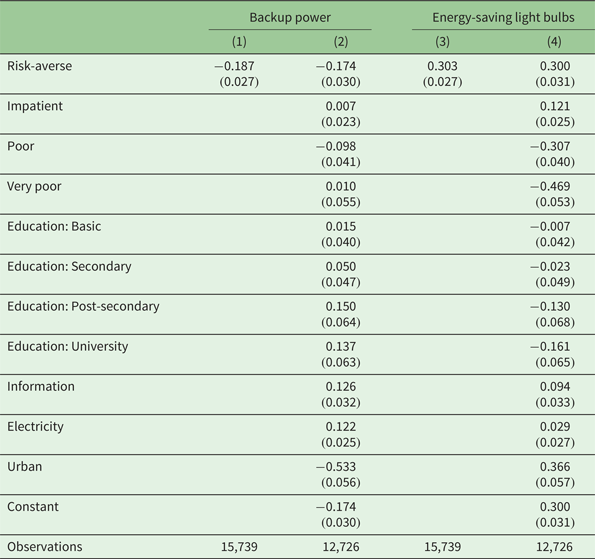
We also examined whether risk aversion matters for decisions related to electricity usage. First, risk aversion can affect the use of backup electricity sources in two ways. On the one hand, risk-averse households might demand an alternative electricity source as a backup for disruption in their primary source (usually the national grid). On the other hand, risk-averse households might be less likely to have an alternative source, since the purchase of a backup generator, a solar panel, or a local mini-grid involves some risks, being unfamiliar technology for those who rely on the national grid. The results from columns (1) and (2) of table 6 appear to favor the latter way and suggest that risk-averse people are less likely to have additional electricity sources. Second, we explored whether risk-averse and impatient individuals are more likely to use energy-saving light bulbs exclusively for lighting. In this instance, the result regarding the adoption of energy saving light bulbs was not consistent with our expectations that impatient people usually do not invest in new technology that requires higher initial cost but provides higher future benefits.
Electricity-related outcomes

Notes: This table shows the results of probit estimation, with standard errors in parentheses.
7. Conclusion and policy recommendations
This study focused on risk and time preference as factors explaining household cooking fuel choices. The results suggest that risk preferences play a significant role in the choice of LPG as the primary cooking fuel, while time preferences do not have a significant impact. Risk-averse individuals were found to be less likely to choose LPG as their primary cooking fuel. However, if households find LPG easily available upon demand such as through an increased number of refill stations, then even risk-averse individuals would be more inclined to choose LPG. We also found that the influence of access to and adoption of modern infrastructure in the form of electricity is a significant factor in influencing the probability of choosing LPG. Meanwhile, access to information was shown to play an important role in deciding to choose LPG as cooking fuel.
Based on the above findings, we recommend that the government and policymakers should pay attention to the fact that many households in Ghana are risk-averse and are less likely to shift to LPG as their primary cooking fuel. Policies that make LPG easily available might help mitigate the reluctance of risk-averse households to make cleaner cooking fuel choices. Furthermore, refill stations should not only be increased, but should also be more evenly spread within a district to ensure easier access by households. This could be made possible by a policy to provide economic incentives, including tax rebates or other non-fiscal incentives, to LPG marketing companies to set up refill outlets in districts that have no or inadequate refill stations. An LPG supply system that delivers fuels to households on their premises promptly and reliably would reduce households having to travel to refill stations. Such a system would be particularly useful in promoting LPG use. The findings further suggest the importance of public awareness of the adverse health implications of continued use of heavy polluting fuels given that households tend to choose fuels with less risk. This could contribute significantly to a shift toward LPG use. There are implications for future research emanating from this study. While we find a significant relationship between risk aversion and LPG choice, this study does not disentangle the various pathways of this relationship. A future study that investigates the effect of price volatility and/or fear of potential gas explosions on LPG choice will be a useful complement to the findings of this study.
The evidence presented in this paper also suggests that development planning should be more comprehensive rather than disaggregated into individual components that are isolated from one another. Households that are electrified and have access to information are likely to choose LPG. This suggests that the response to LPG promotion policy would be less effective if households remained without access to electricity. The simultaneous provision of LPG infrastructure, provision of electricity, and information access would yield better results, thereby promoting the clean cooking agenda.
Supplementary material
The supplementary material for this article can be found at https://doi.org/10.1017/S1355770X22000122
Acknowledgments
This research was supported by the Grant for Environmental Research Projects from the Sumitomo Foundation (Grant Number 193278) and Kobe University Center for Social Systems Innovation. An earlier version of this manuscript was presented at the 25th Annual Conference of the Society for Environmental Economics and Policy Studies. The authors acknowledge helpful comments from Ngawang Dendup, Hide-fumi Yokoo, an anonymous referee, and the editor of this journal.
Conflict of interest
The authors declare none.