

1. Introduction
Extreme surface heating still poses a substantial challenge to the design of vehicles for sustained hypersonic flight. It is well known that turbulent flows can greatly increase surface heating compared with a laminar flow (Hollis Reference Hollis2012). If laminar-to-turbulent transition locations can be predicted, then the use of potentially heavy or costly thermal protection systems can be reduced or even eliminated entirely in areas where the boundary layer remains laminar, thus improving the feasibility of the vehicle in terms of cost and aerodynamic performance.
In a boundary layer, transition to turbulence occurs when a disturbance in an initially laminar flow reaches some critical amplitude. If environmental disturbances (such as free-stream disturbances or surface roughness) are small, then transition occurs through a specific path. First, the environmental disturbances excite the boundary-layer disturbance modes through the so-called receptivity process. Next, one or more of these boundary-layer disturbance modes are destabilised through some linear instability mechanism, after which they grow exponentially. For two-dimensional (2-D) or axisymmetric hypersonic boundary layers, the dominant instability mechanism is Mack’s second mode (Mack Reference Mack1984). If the disturbance mode becomes large enough in amplitude, it becomes nonlinear and shortly thereafter break down to turbulence begins. Naturally, transition locations depend not only on the nature of the instability mechanism, but also on the initial amplitude of the disturbance mode when it first becomes unstable, which is determined by the receptivity process.
The most commonly used transition prediction method is the
 $e^N$
method of van Ingen (Reference van Ingen1956), which postulates that transition occurs when a single unstable frequency or spanwise mode within the overall boundary-layer disturbance attains some critical amplitude. While the
 $e^N$
method has proven to be useful, its main drawback is that it neglects the contribution of the broadband spectrum of frequencies and spanwise wavenumbers within the boundary-layer disturbance towards transition. In light of these issues, Mack (Reference Mack1977) proposed a more sophisticated transition prediction method that takes into account this spectrum. Recently, Marineau (Reference Marineau2017) was able to use the amplitude method to predict transition locations fairly accurately for straight-cone geometries in wind tunnel conditions. To be used effectively, however, both of these transition prediction methods require knowledge of the initial amplitude of the unstable mode, which must be obtained from receptivity studies.
In many cases, transition locations are influenced primarily by the presence of free-stream disturbances. In ground-based facilities, free-stream disturbances are predominantly acoustic in nature, originating from the turbulent boundary layer on the walls of the wind tunnel (Laufer Reference Laufer1961). In flight tests, the free-stream disturbances are more likely to be vorticity or entropy disturbances, with the former being associated with turbulence. Receptivity to free-stream disturbances in a hypersonic flow is characterised by the presence of the bow shock, and the interaction of the free-stream wave with the bow shock fundamentally changes the nature of the wave. According to the linear disturbance–shock interaction theory of McKenzie & Westphal (Reference McKenzie and Westphal1968), a free-stream wave, upon interacting with a shock, will transmit or generate waves of all four types (fast and slow acoustic, entropy, vorticity) behind the shock. These waves evolve as they interact with the geometry and excite the boundary-layer modes through a synchronisation process (Fedorov & Khokhlov Reference Fedorov and Khokhlov2001).
The problem of receptivity to free-stream disturbances has been studied for a wide range of free-stream conditions and geometries but has mostly been limited to low-enthalpy flows, where flow-field temperatures are low enough that a calorically perfect gas (CPG) assumption is valid. Some notable examples of low-enthalpy receptivity studies are Kara, Balakumar & Kandil (Reference Kara, Balakumar and Kandil2011), Balakumar & Kegerise (Reference Balakumar and Kegerise2011), Huang & Zhong (Reference Huang and Zhong2014), Cerminara & Sandham (Reference Cerminara and Sandham2017), Balakumar & Chou (Reference Balakumar and Chou2018) and He & Zhong (Reference He and Zhong2022). High-enthalpy flows, on the other hand, are characterised by high flow-field temperatures which lead to real-gas effects such as chemical reactions and the excitation of vibrational or electronic internal energy modes. These types of flows are commonly encountered in flight conditions, for example in the Re-entry F experiment (Johnson et al. Reference Johnson, Stainback, Wicker and Boney1972), and in a number of ground-based facilities, such as the T5 reflected shock tunnel at Caltech or the High Enthalpy Shock Tunnel at Göttingen.
A real-gas flow can be further classified as an equilibrium, frozen or non-equilibrium flow based on a Damköhler number, representing the ratio of the characteristic flow time scale to the characteristic time scale of a real-gas process. A vibrational Damköhler number can be defined as
 $Da_{v}$
=
 $\tau _{f}/\tau _{v}$
, where
 $\tau _{f}$
is the characteristic flow time and
 $\tau _{v}$
is the characteristic vibrational relaxation time scale. Similarly, a chemical Damköhler number can be defined as
 $Da_{c}$
=
 $\tau _{f}/\tau _{c}$
, where
 $\tau _c$
is the characteristic chemical reaction time scale. If
 $Da_{v} \rightarrow \infty$
or
 $Da_{c} \rightarrow \infty$
, the vibrational relaxation or chemical reactions occur so quickly that the flow is in thermal or chemical equilibrium. If
 $Da_{v} \rightarrow$
0 or
 $Da_{c} \rightarrow$
0, vibrational relaxation or chemical reactions occur so slowly that the vibration temperature and chemical composition remain ‘frozen’ at their initial values, at least in the inviscid limit. Realistic flows are usually somewhere between these two extremes, and are considered to be in thermal or chemical non-equilibrium. At even higher temperatures, it is necessary to also consider ionisation and its characteristic time scale, although a similar discussion applies.
Real-gas effects influence boundary-layer stability through two routes. The first route is an indirect one; that is, real-gas effects modify the underlying mean flow, which then influences the disturbance. Generally, real-gas effects lead to an overall cooling of the mean flow (i.e. a reduction in translation–rotation temperature), which in turn tends to destabilise the second mode. This cooling occurs as a result of thermal energy being directed towards vibrational modes through vibrational relaxation (Bitter & Shepherd Reference Bitter and Shepherd2015; Knisely & Zhong Reference Knisely and Zhong2020), or towards endothermic dissociation reactions (Stuckert & Reed Reference Stuckert and Reed1994; Chang, Vinh & Malik Reference Chang, Vinh and Malik1997; Hudson, Chokani & Candler Reference Hudson, Chokani and Candler1997; Marxen et al. Reference Marxen, Magin, Shaqfeh and Iaccarino2013; Miró Miró et al. Reference Miró Miró, Beyak, Pinna and Reed2020; Zanus et al. Reference Zanus, Knisely, Miró Miró and Pinna2020b ). Stuckert & Reed (Reference Stuckert and Reed1994) and Chang et al. (Reference Chang, Vinh and Malik1997) showed that this cooling can lead to the appearance of unstable supersonic modes. In the second route, real-gas effects influence the disturbance directly. Within this route, Kline, Chang & Li (Reference Kline, Chang and Li2018) found that, for a Mach 11 straight-cone flow, vibrational relaxation had a stabilising influence on the second mode, with the degree of stabilisation depending on the vibrational relaxation time scale. Johnson, Seipp & Candler (Reference Johnson, Seipp and Candler1998) found that, for a Mach 5.1 straight-cone flow, endothermic reactions (like dissociation) were stabilising to the second mode, while exothermic reactions (like recombination) were destabilising. Mortensen (Reference Mortensen2018) found a similar result for a Mach 20 straight-cone flow.
Very few studies have considered receptivity to free-stream disturbances for high-enthalpy flows. Some notable studies include Ma & Zhong (Reference Ma and Zhong2004), Prakash & Zhong (Reference Prakash and Zhong2012), Wagnild (Reference Wagnild2012) and Wang (Reference Wang2017). Only a small subset of these high-enthalpy studies (e.g. Varma & Zhong (Reference Varma and Zhong2022)) have attempted to obtain receptivity coefficients (i.e. the ratio of the initial amplitude of the unstable mode to the amplitude of the free-stream disturbance) or the real-gas effect on said receptivity coefficients. As a result, the existing knowledge base of receptivity for high-enthalpy flows is limited in terms of the free-stream conditions and geometries considered and in scope. The preliminary findings of the authors (Varma & Zhong Reference Varma and Zhong2022) suggest that, for a Mach 5 flow over a straight cone, thermochemical non-equilibrium (TCNE) effects decrease receptivity coefficients for free-stream acoustic pulses compared with a thermochemically frozen gas.
This study aims to expand on the understanding of receptivity in high-enthalpy flows by (i) investigating receptivity to free-stream acoustic waves for a Mach 5 high-enthalpy flow and by (ii) investigating the TCNE effect on receptivity for this flow. Much of this study is based on the preliminary work of Varma & Zhong (Reference Varma and Zhong2022). The paper is organised as follows. The simulation conditions are described in § 2 while the governing equations and numerical methods are described in §§ 3 and 4, respectively. The results are presented in
 $\S\S$
5–7. Finally, § 8 concludes the paper.
2. Simulation conditions
2.1. Free-stream conditions and geometry
The free-stream conditions used here are the same as Knisely & Zhong (Reference Knisely and Zhong2019b
,
Reference Knisely and Zhongc
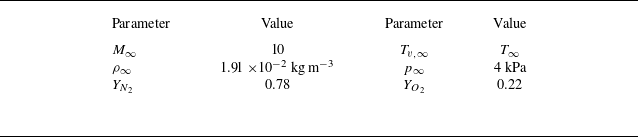
, Reference Knisely and Zhong2020) and are summarised in table 1. The free-stream stagnation enthalpy is
 $h_{0,\infty } \approx$
9.17 MJ kg–1 and the unit Reynolds number is
 $Re_1 \approx$
1.72
 $\times$
10
 $^{6}$
m
 $^{-1}$
. These conditions are similar to those found in high-enthalpy shock tunnels. The geometry is a circular cone with a nose radius of 1 mm and a half-angle of 5
 $^{\circ }$
at zero angle of attack.
Free-stream conditions for present study. The temperatures are not specified a priori, but are computed from the remaining quantities.

2.2. Cases
For the above flow configuration, direct numerical simulation (DNS) is performed for two cases using different gas models. The first case (hereafter referred to as the TCNE case) uses a TCNE gas model that includes finite-rate chemistry based on a five-species air model, as well as a two-temperature model for the translation–rotation and vibration temperatures. The governing equations are given in § 3. The wall is assumed to be isothermal and in thermal equilibrium with
 $T_w$
=
 $T_{v}$
= 600 K and non-catalytic for the species mass fractions.
The second case (hereafter referred to as the frozen case) considers a thermochemically frozen gas in which the species mass fractions and vibration temperature remain at their free-stream values everywhere in the flow field. This was implemented in the DNS by neglecting the chemical production/depletion term (
 $\omega _s$
) and the translation–vibration energy transfer term (
 $Q_{T-V,s}$
), and by setting the species mass fractions and vibration temperature at the wall to their free-stream values. The wall is assumed to be isothermal for the translation–rotation temperature at
 $T_w$
= 600 K.
Note that, because
 $\omega _s$
and
 $Q_{T-V,s}$
are neglected in the frozen case, the vibration energy equation can be subtracted out from the total energy equation such that the vibration temperature no longer appears as a variable in the equation set. Hence, the vibration temperature becomes a passive variable and is ultimately irrelevant to the results. Because of this, and because the species mass fractions are also uniform in this case, we would obtain functionally the same results if we instead considered a CPG model, where the vibrational energy is neglected entirely and species mass fractions are fixed.
2.3. Wall temperature considerations
It should be noted that the wall temperature used in this study is higher than what is typically observed in high-enthalpy wind tunnels. In reality, because of short test durations, the wall temperature remains close to the ambient temperature (usually around 300 K) for the entire test. Such a cold wall is difficult to simulate numerically because of the high temperature (and density) gradients. However, even with the present wall temperature of 600 K, the wall is considered to be cold, with a nominal wall-to-edge temperature ratio of
 $T_w/T_e \approx$
0.24 on the frustum. As such, the results of the present study are expected to at least be qualitatively consistent with experimental results in terms of boundary-layer receptivity.
2.4. Direct numerical simulation grid and grid convergence
The DNS is performed up to
 $s$
= 1.25 m, where
 $s$
is the arclength measured along the surface starting from the stagnation point. The wall-normal grid uses 513 grid points. The streamwise grid uses at least 10 grid points per millimetre up to
 $s \approx$
0.6 m and approximately 5 grid points per millimetre between
 $s \approx$
0.6 and
 $s$
= 1.25 m. Since the flow field is axisymmetric, the azimuthal direction uses only 4 grid points.
The grid convergence is assessed using the grid convergence index (GCI) described by Roache (Reference Roache2009), which is essentially a measure of the uncertainty arising from the discretisation error. The GCI is evaluated in terms of the amplitude of mode
 $F_1$
(the unstable mode) at the branch I and II neutral points (the point at which the unstable mode goes becomes unstable and stable again, respectively). Errors beyond the branch II neutral point are not relevant to this study. The branch I and II neutral points are taken to be those predicted by the linear parabolised stability equations (LPSE) except for the wall-normal grid convergence analysis, where the linear stability theory (LST) ones are used instead. The neutral points do not vary substantially between the two stability frameworks. The grid convergence analysis is performed for the TCNE case only, although the results should apply for the frozen case as well because of the similarities in the flow fields and grid stretching parameters used. For this analysis, we consider a fixed frequency of
 $f$
= 600 kHz.
The GCI for the wall-normal discretisation is estimated by performing an LST analysis using the mean flow profiles from the present DNS (using 513 points in the wall-normal direction), and comparing the results with those obtained using the mean flow profiles from two separate DNSs using 385 and 769 points in the wall-normal direction. The resulting comparison is shown in figure 1(a). The error from the LST discretisation itself is least two orders of magnitude smaller than the error from the underlying DNS base flow and does not affect the GCI estimate. The LST computations follow the streamwise evolution of the amplitude of mode
 $F_1$
relative to a starting location of
 $s$
= 0.01 m. This amplitude is computed by integrating the growth rate. The accumulated error upstream of the starting location is assumed to be negligible. Following Roache (Reference Roache2009), the GCI is estimated by computing an empirical order of accuracy
 $p_{emp}$
(which in this case is less than
 $p$
= 5, the theoretical order of accuracy), performing Richardson extrapolation using
 $p_{emp}$
, then multiplying the resulting error by a factor of safety of 1.25. In doing so, the wall-normal GCI in terms of the branch I and II amplitudes are 1.79
 $\,\%$
and 3.29
 $\,\%$
, respectively.
(a) Comparison of LST-derived second-mode amplification ratio relative to
 $s$
= 0.01 m between the present DNS grid (with 513 points) and finer and coarser DNS grids (with 769 and 385 points, respectively) in the wall-normal direction. (b) Comparison of wall pressure perturbation amplitude with free-stream slow acoustic waves between the present DNS grid and a coarser DNS grid with half the number of points in the streamwise direction, starting from
 $s$
= 0.01 m.

The GCI for the streamwise discretisation is computed by comparing unsteady DNS results (with imposed free-stream slow acoustic waves) with another DNS with a coarser grid, with roughly half the number of streamwise points between
 $s \approx$
0.01 and
 $s$
= 1.25 m. Figure 1(b) compares the wall pressure amplitude between the two grids. Errors accumulated upstream of
 $s \approx$
0.01 m are assumed to be negligible. Note that the boundary-layer disturbance is nominally multimodal, containing not only mode
 $F_1$
, but other types of waves as well. However, the boundary-layer disturbance at the branch II neutral point is dominated by mode
 $F_1$
. Hence, the disturbance amplitude at this point is essentially the amplitude of mode
 $F_1$
. The amplitude of mode
 $F_1$
at the branch I neutral point is estimated through a backtracking method described later in this paper. The GCI is estimated here by performing Richardson extrapolation with
 $p$
= 5 (the theoretical order of accuracy) and multiplying the resulting error by a factor of safety of 3. This more conservative factor of safety is recommended by Roache (Reference Roache2009) since the empirical order of accuracy is not known in this case (only two grids are considered). The streamwise GCI in terms of both the branch I and II amplitudes is approximately 0.72
 $\,\%$
. The streamwise GCI is the same between the two locations due to the nature of the backtracking method mentioned earlier.
The GCI for the temporal discretisation is estimated by running a 1-D inviscid perfect gas simulation with a slightly larger time step but the same Runge–Kutta method as the last subdomain in the full DNS (spanning from
 $s \approx$
0.6 to
 $s$
= 1.25 m). The mean flow conditions roughly approximate those at the boundary-layer edge at
 $s$
= 1 m. The simulation is initiated with slow acoustic waves at the inlet. The dissipation rate per wavelength associated with the temporal discretisation (which is primarily dissipative) is estimated. Extrapolating these results to the distance of the branch I and II neutral points, the temporal GCIs in terms of the branch I and II neutral points are 0.045
 $\,\%$
and 0.069
 $\,\%$
, respectively.
The combined GCIs in terms of the amplitude at the branch I and II neutral points are approximately 2.56
 $\,\%$
and 4.08
 $\,\%$
, respectively. The GCI for the branch I amplitude in particular may appear to be excessive when considering the branch I receptivity coefficients (see figure 22), where the differences between the TCNE and frozen cases are of the same order of magnitude as the GCI. However, because the two cases have similar overall flow fields, they have similar grid resolution requirements, and similar discretisation errors. This means the comparisons of results between the TCNE and frozen cases will essentially be unchanged regardless of the number of points used in the grid, as long as the same grid stretching parameters are used. This was verified by comparing low-resolution steady DNS results between the two gas models. With this understanding, the present grid resolution is sufficient.
3. Governing equations and gas model
The governing equations are the Navier–Stokes equations extended to a TCNE gas model. The formulation is that of Mortensen & Zhong (Reference Mortensen and Zhong2014) but is summarised here for the convenience of the reader. Chemical non-equilibrium is included through a five species air model (N
 $_2$
, O
 $_2$
, NO, N and O) with finite-rate chemistry, whereas thermal non-equilibrium is included through a two-temperature model with separate translation–rotation and vibration temperatures. The governing equations in Cartesian coordinates and in vector form are
 \begin{equation} \frac {\partial U}{\partial t} + \frac {\partial F_j}{\partial x_j} + \frac {\partial G_j}{\partial x_j} = W, \end{equation}
where
 $U$
is the vector of conserved quantities and
 $W$
is the vector of source terms defined by
 \begin{equation} U = \begin{bmatrix} \rho _1 \\ \vdots \\ \rho _{ns} \\ \rho u_1 \\ \rho u_2 \\ \rho u_3 \\ \rho e \\ \rho e_v \\ \end{bmatrix}, \quad W = \begin{bmatrix} \omega _1 \\ \vdots \\ \omega _{ns} \\ 0 \\ 0 \\ 0 \\ 0 \\ \sum _{s=1}^{nms} \left (Q_{T-V,s} +\omega _s e_{v,s} \right ) \\ \end{bmatrix}. \end{equation}
The inviscid and viscous flux vectors,
 $F_j$
and
 $G_j$
, respectively, are defined by
 \begin{equation} F_j = \begin{bmatrix} \rho _1 u_j \\ \vdots \\ \rho _{ns} u_j \\ \rho u_1 u_j + p \delta _{1j}\\ \rho u_2 u_j + p \delta _{2j}\\ \rho u_3 u_j + p \delta _{3j}\\ \left (p+\rho e\right ) u_j \\ \rho e_v u_j\\ \end{bmatrix}, \quad G_j = \begin{bmatrix} \rho _1 v_{1j} \\ \vdots \\ \rho _{ns} v_{nsj} \\ \tau _{1j} \\ \tau _{2j} \\ \tau _{3j} \\ -u_i \tau _{ij} + q_j + q_{v,j} + \sum _{s=1}^{ns} \rho _s h_s v_{sj} \\ q_{v,j} + \sum _{s=1}^{nms} \rho _s e_{v,s} v_{sj} \\ \end{bmatrix}. \end{equation}
Here,
 $ns$
is the number of species,
 $nms$
is the number of molecular species,
 $\rho _s$
is the density of species
 $s$
,
 $\rho$
is the mixture density,
 $u_j$
is the component of velocity in the
 $j$
-direction,
 $T$
is the translation-rotation temperature,
 $T_v$
is the vibration temperature,
 $e$
is the mixture specific total energy,
 $e_v$
is the mixture specific vibration energy,
 $e_{v,s}$
is the species specific vibration energy,
 $\omega _s$
is the species chemical production term and
 $Q_{T-V,s}$
is the term representing the exchange of energy between the translation–rotation and vibration modes for species
 $s$
. The pressure
 $p$
is given by the equation of state
 \begin{equation} p = \sum _{s=1}^{ns} \rho _s R_s T, \end{equation}
where
 $R_s = R/M_s$
is the specific gas constant,
 $R$
is the universal gas constant and
 $M_s$
is the molar mass. In addition
 \begin{equation} \tau _{ij} = \mu \left (\frac {\partial u_i}{\partial x_j}+\frac {\partial u_j}{\partial x_i} \right )-\frac {2}{3}\mu \frac {\partial u_k}{\partial x_k} \delta _{ij} ,\end{equation}
is the viscous stress tensor, where
 $\mu$
is the mixture viscosity, while
 $q_j$
and
 $q_{v,j}$
are the translation–rotation and vibration heat fluxes, respectively, given by
 \begin{equation} q_j = -k \frac {\partial T}{\partial x_j}, \quad q_{v,j} = -k_v \frac {\partial T_v}{\partial x_j}, \end{equation}
where
 $k$
is the mixture translation–rotation conductivity and
 $k_v$
is the mixture vibration conductivity. The mixture total energy per unit volume,
 $\rho e$
, is defined by
 \begin{equation} \rho e = \sum _{s=1}^{ns} \rho _s c_{v,s} T + \rho e_v + \frac {1}{2} \rho u_k u_k +\sum _{s=1}^{ns} \rho _s h_s^o, \end{equation}
where
 $h_s^o$
is the species specific heat of formation, and
 $c_{v,s}$
is the species translation–rotation specific heat at constant volume, defined by
 \begin{equation} c_{v,s} = c_{v,tr,s} + c_{v,rot,s}, \end{equation}
where
 $c_{v,tr,s}$
is the translation specific heat at constant volume, defined by
 \begin{equation} c_{v,tr,s} = \frac {3}{2} R_s, \end{equation}
and
 $c_{v,rot,s}$
is the rotation specific heat at constant volume, defined by
 \begin{equation} c_{v,rot,s} = \begin{cases} R_s & \text{for molecular species,} \\ 0 & \text{for atomic species.} \\ \end{cases} \end{equation}
The mixture vibration energy per unit volume,
 $\rho e_v$
, is defined by
 \begin{equation} \rho e_v = \sum _{s=1}^{ns}\rho _s e_{v,s} , \end{equation}
where
 \begin{equation} e_{v,s} = \begin{cases} \frac { R_s\theta _{v,s}}{\exp \left (\theta _{v,s}/T_v\right )-1} & \text{for diatomic species,} \\ 0 & \text{for atomic species,} \\ \end{cases} \end{equation}
and
 $\theta _{v,s}$
is the characteristic vibrational temperature of each species as tabulated by Park (Reference Park1990). Furthermore,
 $h_s$
is the species specific enthalpy defined by
 \begin{equation} h_s = \left ( c_{v,s} + R_s \right ) T + e_{v,s} + h_s^o. \end{equation}
The reaction rates are computed from
 \begin{align}& k_f = C_f T_a^\eta \exp \left (-\theta _d/T_a\right ), \end{align}
 \begin{align}&\qquad\quad k_b = k_f/K_{eq}, \end{align}
where
 $k_f$
is the forward reaction rate and
 $k_b$
is the backward reaction rate, with constants from Park (Reference Park1985). All reaction rates are computed using
 $T_a = T$
except for the forward reaction rates for the dissociation reactions, which are computed using
 $T_a = \sqrt {T T_v}$
. The equilibrium coefficient,
 $K_{eq}$
, is computed directly from the curve fits of Park (Reference Park1990) or through the Gibbs free energy curve fits of McBride et al. (Reference McBride, Heimel, Ehlers and Gordon1963).
The source term
 $Q_{T-V,s}$
is computed from the Landau–Teller model (Vincenti & Kruger Reference Vincenti and Kruger1967)
 \begin{equation} Q_{T-V,s} = \rho _s \frac {e_{v,s}(T) -e_{v,s}(T_v)}{{\langle }\tau _s{\rangle } +\tau _{cs}}, \end{equation}
where
 ${\langle }\tau _s{\rangle }$
is the Landau–Teller relaxation time given by Lee (Reference Lee and Nelson1985) and
 $\tau _{cs}$
is the high-temperature correction term from Park (Reference Park1990).
The species viscosities are computed using a Blottner curve fit with coefficients from Blottner, Johnson & Ellis (Reference Blottner, Johnson and Ellis1971). The species thermal conductivities are computed using Eucken’s relation (Eucken Reference Eucken1913). The mixture viscosity and thermal conductivities are computed using Wilke’s mixing rule (Wilke Reference Wilke1950). For improved computational efficiency, the diffusion velocity is computed using Fick’s law with a constant Schmidt number of Sc = 0.5.
4. Numerical methods
4.1. Direct numerical simulation
This study uses the TCNE shock-fitting DNS solver of Mortensen & Zhong (Reference Mortensen and Zhong2014). In the shock-fitting framework, the computational domain evolves in time following the movement of the shock. The domain is discretised using a body-fitted curvilinear grid. This grid is then mapped onto a rectilinear computational grid through a coordinate transformation. The governing equations (3.1)–(3.3) are transformed to the computational coordinate system and discretised on the computational grid using a finite difference scheme. In the streamwise and wall-normal directions, derivatives are computed using the fifth-order accurate explicit finite difference scheme of Zhong (Reference Zhong1998). In the transverse direction, derivatives are computed using Fourier collocation. To reduce computational overhead, the overall domain is divided into several subdomains, which are computed sequentially moving downstream.
The upper boundary of each subdomain is the bow shock. The conditions at the upper boundary are thus computed from the free-stream conditions via the Rankine–Hugoniot relations, where the species mass fractions and vibration temperature are assumed to remain fixed across the shock. The wall boundary conditions have already been mentioned in § 2. The inflow boundary conditions are treated differently depending on the streamwise location of the subdomain. In the first subdomain, which includes the nose tip, there is no inflow boundary. For downstream subdomains, the inflow boundary conditions are specified from the outflow conditions of the previous subdomain. The outflow boundary conditions are specified through extrapolation.
Note that the first subdomain contains a grid line that is coincident with the axis of the cone and a singularity in the coordinate system mentioned above. The conditions along this line are interpolated from the surrounding points.
Both steady and unsteady solutions are obtained via time stepping using the forward Euler method, the three-stage third-order strong stability preserving Runge–Kutta (SSP-RK) method of Shu & Osher (Reference Shu and Osher1988) or the four-stage third-order SSP-RK method of Spiteri & Ruuth (Reference Spiteri and Ruuth2002). A complete description of the DNS code and a derivation of the TCNE shock-fitting procedure can be found in the work of Mortensen (Reference Mortensen2015).
4.2. Linear parabolised stability equations
To account for non-parallel effects in the stability analysis, a new TCNE LPSE solver was developed based on the existing LST solver of Mortensen & Zhong (Reference Mortensen and Zhong2016) and Knisely & Zhong (Reference Knisely and Zhong2017). Here, the LST formulation is modified slightly such that streamwise derivatives of the grid metrics (the scale factors) associated with the curvilinear coordinate system are neglected.
The derivation of the LPSE equations takes inspiration from the LST derivation of Mortensen & Zhong (Reference Mortensen and Zhong2016) and the LPSE derivation of Beyak (Reference Beyak2022). A verification of the LPSE solver is provided in Appendix. The LPSE equations are derived from the TCNE Navier–Stokes equations in curvilinear coordinates by a perturbation expansion of the form
 $q(x,y,z,t) = \overline {q}(x,y,z) + q'(x,y,z,t)$
, where
 $q$
is an arbitrary flow quantity,
 $\overline {q}$
is the mean flow quantity,
 $q'$
is the perturbation quantity and
 $x$
,
 $y$
and
 $z$
are the coordinates in the streamwise, wall-normal and spanwise directions, respectively. Note that these coordinates are different from the global coordinates used in the DNS solver. Terms that contain only mean flow quantities are subtracted out, since they satisfy the governing equations themselves. Terms that contain nonlinearities in
 $q'$
are neglected under the assumption of small (linear) perturbations. The flow is assumed to evolve slowly in the streamwise direction so that the substitution
 $\tilde {x}$
=
 $\epsilon x$
can be made, where
 $\epsilon = O(Re^{-1})$
is a small parameter with
 $Re$
being the Reynolds number. The perturbations are then assumed to take the form
 \begin{equation} q'(x,y,z,t) = \hat {q}(\tilde {x},y) \exp \left [i \left ( \int _{\tilde {x}_0}^{\tilde {x}} \alpha (\bar {x}) \,{\textrm d}\bar {x} + \beta z - \omega t\right ) \right ], \end{equation}
where
 $\hat {q}(\tilde {x},y)$
is the shape function,
 $\omega$
is the angular frequency of the disturbance and
 $\alpha$
and
 $\beta$
are the wavenumbers in the streamwise and spanwise directions, respectively. The streamwise wavenumber
 $\alpha$
is complex and can be written as
 $\alpha = \alpha _r + i \alpha _i$
. The spanwise wavenumber
 $\beta$
is real and is specified a priori. For the cases considered in this study, only axisymmetric waves are considered so that
 $\beta$
= 0. Substituting the above expression into the governing equations and neglecting terms that contain nonlinearities in
 $\epsilon$
, we arrive at a set of
 $ns+5$
partial differential equations of the form
 \begin{equation} \left (\textbf {A} \frac {\partial ^2}{\partial y^2}+ \textbf {B} \frac {\partial }{\partial y} + \textbf {C} + \textbf {D} \frac {\partial }{\partial x} + \textbf {E} \frac {\partial ^2}{\partial x \partial y} \right ) \boldsymbol{\phi } = \boldsymbol{0}, \end{equation}
where
 $\boldsymbol{\phi } = [ \hat {\rho }_1, \hat {\rho }_2, \dotsc , \hat {\rho }_{ns}, \hat {u}, \hat {v}, \hat {w}, \hat {T} ,\hat {T}_V ]^T$
, and A, B, C, D and E are complex square matrices of size
 $ns+5$
, with
 $ns$
being the number of species in the gas model.
It is well known that there is an ambiguity in the LPSE formulation, since the streamwise variation of the disturbance could be contained in both the shape function and in the streamwise wavenumber. To resolve this ambiguity, an additional constraint, in the form of a normalisation condition, must be applied. Typically, the normalisation condition is chosen so that the shape function varies slowly in the streamwise direction. As a result, most of the streamwise variation of the disturbance should be contained in the variation of the streamwise wavenumber. This normalisation condition is implemented as a convergence criterion for the streamwise wavenumber
 $\alpha$
. Using the kinetic energy normalisation condition described by Chang & Malik (Reference Chang and Malik1994),
 $\alpha$
is updated iteratively until convergence at each streamwise step as
 \begin{align}& \alpha ^{(k+1)} = \alpha ^{(k)} - i \frac {1}{E} \int _{0}^{y_{max}} \overline {\rho } \left ( \hat {u}^{*} \frac {\partial \hat {u}}{\partial x} + \hat {v}^{*} \frac {\partial \hat {v}}{\partial x} + \hat {w}^{*} \frac {\partial \hat {w}}{\partial x} \right ) \text{d}y, \end{align}
 \begin{align}&\qquad\qquad E = \int _{0}^{y_{max}} \overline {\rho } \left ( \hat {u}^{*} \hat {u} + \hat {v}^{*} \hat {v} + \hat {w}^{*} \hat {w} \right ) \text{d}y, \end{align}
where
 $k$
is the iteration index, ‘
 $^*$
’ denotes the complex conjugate and
 $y_{max}$
is the height of the computational domain.
Solutions are obtained by marching downstream given the shape function profile at some initial streamwise location (the inlet). In this study, the initial shape function profile is specified as the eigenfunction from a converged LST solution. It should be noted that the marching procedure is numerically unstable if the streamwise grid spacing is smaller than some value, which can sometimes prevent proper grid convergence. It is common to alleviate this restriction by artificially suppressing the shape function pressure gradient (
 $\partial \hat {p} / \partial x$
) in the manner of Vigneron, Rakich & Tannehill (Reference Vigneron, Rakich and Tannehill1978). This modification was found to be unnecessary for the cases considered in this study, although the option is still available should the user require it.
For the wall-normal grid, the grid stretching scheme of Malik (Reference Malik1990) is used to cluster points near the wall. In his formula, half of the points are placed below a user-specified wall-normal distance
 $y_i$
, while the other half are located above it. Here, we set
 $y_i$
=
 $\delta$
, where
 $\delta$
is the local boundary-layer thickness. Here,
 $\delta$
is taken to be the wall-normal position at which the total enthalpy first reaches 99.5
 $\,\%$
of the free-stream total enthalpy starting from the wall. In addition,
 $y_{max}$
is the height of the domain. For LPSE we set
 $y_{max} = 8\delta$
, but for LST we set
 $y_{max} = 0.99y_{shk}$
.
We now consider the numerical treatment of the partial derivatives in (4.2). Let us first consider the partial derivatives in the streamwise direction,
 $x$
. These derivatives are computed using a grid transformation because there are no grid lines parallel to this direction (except for the grid line located at the wall itself). This in turn is due to the fact that the wall-normal grid distribution varies in the streamwise direction according to the local boundary-layer height (see previous discussion). We consider a local grid that consists of the current streamwise station and the one or two stations upstream of it. This local grid with coordinates
 $(x,y)$
is then transformed into a local rectilinear computational grid with coordinates
 $(\xi ,\eta )$
. The transformation can be written as
 $x = \xi$
and
 $y = y(\xi ,\eta )$
. The derivatives in
 $x$
are then computed by first computing the derivatives in
 $\xi$
and
 $\eta$
and then making use of the chain rule. The derivatives in
 $\xi$
are computed using second-order backward differences except for the first step, where they are instead computed using a first-order backwards difference. The derivatives in
 $\eta$
are computed using an explicit five-point finite difference scheme for a uniform grid. The scheme is fourth- and third-order accurate for the first and second derivatives, respectively.
Now we consider the numerical treatment of the partial derivatives in the wall-normal direction,
 $y$
. Although it is possible to use the grid transformation procedure mentioned earlier to compute these derivatives, doing so is neither necessary nor preferable. That is, the wall-normal derivatives do not require any grid transformation, since the original grid is orthogonal to the wall. Also, because discretisation errors tend to increase on a uniform grid due to Runge’s phenomenon, we prefer to instead compute the wall-normal derivatives directly on the original grid, which is non-uniform. Like the LST formulation of Mortensen & Zhong (Reference Mortensen and Zhong2016), we generate finite difference stencils for the non-uniform grid using Lagrange polynomials. Here, a five-point stencil is used, which yields finite difference stencils that are fourth- and third-order accurate for the first and second derivatives, respectively.
At the wall (
 $y$
= 0), the boundary conditions are chosen to match the underlying mean flow. In the TCNE case, the non-catalytic boundary conditions of Mortensen & Zhong (Reference Mortensen and Zhong2013) are used. In the frozen case, the perturbations in mass fractions are set to zero. At the free-stream boundary (
 $y = y_{max}$
), homogeneous Dirichlet conditions are used for all quantities except for the wall-normal velocity, which is computed from the continuity equation. The free-stream boundary conditions can be written as
 \begin{align}&\quad \hat {\rho }_s = \hat {u} = \hat {w} = \hat {T} = \hat {T}_v = 0, \end{align}
 \begin{align}& \overline {\rho } \frac {\partial \hat {v}}{\partial y} + \frac {\partial \overline {\rho }}{\partial y} \hat {v} + \overline {v} \sum _{s=1}^{ns} \frac {\partial \hat {\rho }_s}{\partial y} = 0. \end{align}
Lastly, note that the wavenumber
 $\alpha$
, as obtained directly from the LPSE solution, does not correspond to the physical wavenumber and growth rate of the disturbance. In fact, these quantities vary based on the disturbance quantity and the wall-normal position. Assuming no streamwise curvature in the LPSE coordinate system, the physical wavenumber (denoted by
 $\gamma$
) and growth rate (denoted by
 $\sigma$
) are computed as
 \begin{align}&\,\, \gamma = \alpha _r + \text{Im}{ \left (\frac {1}{q} \frac {\partial q}{\partial x} \right ) }, \end{align}
 \begin{align}& \sigma = -\alpha _i + \text{Re}{ \left (\frac {1}{q} \frac {\partial q}{\partial x} \right ) }, \end{align}
where
 $q$
is some disturbance quantity, which in general is complex valued. The streamwise phase speed is
 $c_r$
=
 $\omega /\gamma$
. Note that, if
 $\alpha$
were obtained from LST, the second term on the right-hand side of each of the above equations would be neglected, since streamwise derivatives of the eigenfunctions are assumed to be zero in the LST framework.
Transition prediction is often done through the
 $e^N$
transition criterion of van Ingen (Reference van Ingen1956)
 \begin{equation} e^{N(s)} = \frac {A(s)}{A_0} = \exp \left (\int _{s_0}^s \sigma (s) \def\lumina\hspace {0.1cm} \text{d}s \right ), \end{equation}
where for a fixed frequency
 $f$
and spanwise wavenumber
 $\beta$
,
 $A$
is the disturbance amplitude,
 $A_0$
is the amplitude at the branch I neutral point (the point at which an unstable mode first becomes unstable) and
 $s_0$
is the location of the branch I neutral point. The exponent
 $N$
is referred to as the
 $N$
-factor and is the parameter most commonly used to correlate transition locations. The
 $N$
-factor at which transition occurs, however, is not universal. In actual flight conditions or in quiet wind tunnels, transition
 $N$
-factors are usually greater than 9 since free-stream noise levels are relatively low. In traditional wind tunnels, transition
 $N$
-factors of 5–6 are common due to much higher free-stream noise levels (Schneider Reference Schneider2001).
Schematic of a planar wave in the free stream impinging on a cone at zero incident angle.

4.3. Free-stream disturbance model
The free-stream disturbances in this study are modelled as planar acoustic waves whose wavenumber vectors are aligned with the axis of the cone (zero incident angle). A schematic of this configuration is provided in figure 2. The disturbance is assumed to be thermochemically frozen, which means there are no perturbations in mass fractions or vibration temperature. The disturbance quantities can then be specified as
 \begin{equation} \begin{bmatrix} u^{\prime}_\infty \\ v^{\prime}_\infty \\ w^{\prime}_\infty \\ p'_\infty \\ \rho '_\infty \\ \end{bmatrix} = \epsilon \begin{bmatrix} \pm u_\infty \\ 0 \\ 0 \\ \gamma _{tr} M_{\infty } p_\infty \\ M_{\infty } \rho _\infty \\ \end{bmatrix} \cos {\left (k_x x - \omega t + \psi \right )}, \end{equation}
where
 $(\quad )'$
denotes a perturbation quantity,
 $u$
is the axial velocity,
 $v$
is the vertical velocity,
 $w$
is the horizontal velocity,
 $p$
is the pressure,
 $\rho$
is the density,
 $\gamma _{tr}$
is the translation–rotation specific heat ratio and
 $M$
is the Mach number. In addition,
 $k_x$
is the axial wavenumber,
 $\omega$
is the angular frequency,
 $\psi$
is the phase angle and
 $\epsilon$
is a non-dimensional scaling parameter. The
 $+$
and
 $-$
signs correspond to fast and slow acoustic waves, respectively. The dispersion relation for linear acoustic waves at zero incident angle can be written as
 \begin{equation} \frac {\omega }{k_x} = u_\infty \pm a_\infty , \end{equation}
where
 $a$
is the frozen speed of sound.
In this study, we set
 $\epsilon$
= 1
 $\times$
10
 $^{-7}$
for the slow acoustic waves and
 $\epsilon$
= 5
 $\times$
10
 $^{-8}$
for the fast acoustic waves. These values were chosen such that the disturbance amplitude is small enough to be linear while also being large enough to avoid contamination by numerical noise. The slow acoustic wave was given a larger amplitude in anticipation of a weaker boundary-layer response, although this was unnecessary in hindsight. A number of these waves, at varying frequencies, are imposed simultaneously on the steady free stream. A set of seven frequencies is considered, ranging from
 $f$
= 400 to 1000 kHz, with a spacing of
 $\Delta f$
= 100 kHz between each frequency. The phase angle of each wave is chosen randomly from a uniform distribution in [0, 2
 $\pi$
] to minimise any unintended nonlinear effects that may arise due to constructive interference.
4.4. Fast Fourier transform
Since the free-stream disturbance model involves waves of multiple frequencies imposed simultaneously, unsteady DNS results are analysed using a temporal fast Fourier transform (FFT). The unsteady perturbation of an arbitrary quantity
 $q$
corresponding to a single Fourier mode at frequency
 $f$
can be written as
 \begin{equation} q'(x,y,z,t) = |q'(x,y,z)| \exp \left [ i\left (-2\pi f t + \psi (x,y,z) \right ) \right ], \end{equation}
where
 $q'$
is the perturbation,
 $|q'|$
is the amplitude and
 $\psi$
is the phase angle. Both the amplitude and phase angle are obtained directly from the FFT output. For a given frequency the growth rate, streamwise wavenumber and phase speed, respectively, are computed as
 \begin{align}& \sigma = \frac {1}{|q'|} \frac {\partial |q'|}{\partial s}, \end{align}
 \begin{align}&\quad \gamma = \frac {\partial \psi }{\partial s}, \end{align}
 \begin{align}&\,\,\,\, c_r = \frac {2 \pi f}{\gamma }, \end{align}
where
 $s$
is the streamwise coordinate.
5. Steady DNS results
5.1. The TCNE case
To get an overall picture of the steady flow field, the Mach number contours for a large portion of the cone are shown in figure 3. Note that, due to the relatively low free-stream Mach number, the shock height is large compared with the boundary-layer thickness.
Steady DNS Mach number contours in the TCNE case.

Figure 4(a) shows the contours of temperatures in the nose region. At the stagnation line, the translation–rotation temperature (denoted by
 $T$
) starts at a maximum of approximately 8700 K immediately behind the shock and decreases to 600 K at the wall. The vibration temperature (denoted by
 $T_v$
) is at its free-stream value (about 1491.3 K) behind the shock but slowly increases moving towards the stagnation point, reaching a maximum of approximately 5600 K a small distance away from the stagnation point. The vibration temperature also decreases to 600 K at the wall, since thermal equilibrium is assumed there. Both temperatures generally decrease moving downstream from the stagnation line. At the same time, a vibrational boundary layer starts to appear near the wall in which
 $T_v \gt T$
. The appearance of this vibrational boundary layer is likely related to the expansion of the flow where the spherical nose meets the frustum. The translation–rotation temperature is able to react quickly to the expansion. However, vibrational relaxation occurs too slowly to allow the vibration temperature to do the same. This is consistent with the fact that vibrational modes require many more molecular collisions to reach equilibrium than the translation and rotation modes (Anderson Reference Anderson2006). Moving downstream, this vibrational boundary becomes increasingly thin and eventually disappears. As a result,
 $T_v \lt T$
for the vast majority of the flow field. In any case, the differences between
 $T$
and
 $T_v$
demonstrate that the flow is not in thermal equilibrium.
(a) Steady DNS contours of translation–rotation temperature and vibration temperature, and (b) O
 $_2$
and O mass fractions in the nose region in the TCNE case. Areas where
 $T_v \gt T$
are bounded within white lines on the bottom half of (a).

Figure 4(b) shows the contours of O
 $_2$
and O mass fractions in the nose region. The largest mass fractions aside from N
 $_2$
and O
 $_2$
correspond to atomic oxygen O. As such, the primary chemical reaction is the dissociation of O
 $_2$
into O, with the O mass fraction indicating the extent to which this dissociation occurs. The largest O mass fractions are on the stagnation line itself, reaching a peak value of approximately 7
 $\,\%$
. However, as temperatures decrease moving downstream, O begins to recombine into O
 $_2$
. By the end of the region shown in the figure, the peak O mass fraction is only approximately 2.5
 $\,\%$
.
The second-mode instability occurs far downstream of the nose, and is thus more affected by the nature of the boundary layer on the cone frustum. Figure 5 shows the wall-normal profiles of various quantities at
 $s$
= 0.5 m. Note that both gas models are included in this figure. However, only the TCNE case is considered in the present discussion. Looking at the temperature profiles (figure 5
a), it is apparent that the temperatures are much lower than at the leading edge. Nevertheless, there are still noticeable discrepancies between
 $T$
and
 $T_v$
. In particular, the peak in
 $T$
is approximately 2500 K while the peak in
 $T_v$
is only approximately 1800 K. These discrepancies indicate that the flow has still not reached thermal equilibrium. Looking at figure 5(b), the peak O mass fraction is only approximately 0.014
 $\,\%$
. Even at
 $s$
= 0.1 m, where the second-mode instability first begins, the peak O mass fraction is still only approximately 0.1
 $\,\%$
. In fact, for most of the cone frustum,
 $Y_{N_2} \approx$
0.78 and
 $Y_{O_2} \approx$
0.22.
(a) Mean flow profiles of translation–rotation temperature, vibration temperature and streamwise velocity at
 $s$
= 0.5 m for both gas models. (b) Mean flow profiles of O
 $_2$
and O mass fractions at
 $s$
= 0.5 m in the TCNE case.

5.2. Frozen case
In figure 6 it can be seen that, at several points near the leading edge, the translation–rotation temperature is almost everywhere lower in the TCNE case compared with the frozen case. In other words, TCNE effects result in a cooling of the flow. Moving downstream, the cooling effect tends to weaken, as evidenced by the weaker discrepancies in translation–rotation temperature between the TCNE and frozen cases. This cooling is due to the fact that, in the TCNE case, a portion of the energy contained in the translation–rotation mode is diverted to the vibration mode through vibrational relaxation while another portion is diverted to endothermic dissociation reactions. The cooling also indirectly leads to a decrease in shock height due to an associated increase in density.
Mean flow profiles of translation–rotation and vibration temperature at (a) the stagnation line (
 $s$
= 0 mm), (b)
 $s$
= 8.58 mm and (c)
 $s$
= 21.9 mm in both the TCNE and frozen cases.

Referring back to the mean flow profiles at
 $s$
= 0.5 m (figure 5), the translation–rotation temperature in the TCNE case is again almost everywhere lower than in the frozen case, with the peak translation–rotation temperature being approximately 80 K lower. This indicates that the TCNE case has a cooler mean flow on the frustum as well. This cooling is associated with an increase in density and a decrease in mixture viscosity, leading to a slightly thinner boundary layer in the TCNE case. At this location, the boundary-layer thickness,
 $\delta$
, as measured through the 99.5
 $\,\%$
total enthalpy criterion, is approximately 1.77 mm in the TCNE case, and approximately 1.80 mm in the frozen case.
6. The LST and LPSE results
6.1. The TCNE case
To establish the instability mechanism, LST and LPSE computations were performed using the profiles from steady DNS as input. Figure 7 shows the streamwise variation of the phase speed and growth rate of the relevant discrete modes at
 $f$
= 600 kHz. The LPSE solution is based on the wall pressure perturbation and is initialised using the LST mode
 $F_1$
eigenfunction slightly downstream of where mode
 $F_1$
is synchronised with the entropy/vorticity spectrum. Both gas models are included in the figure, but the TCNE case is considered first. Note that
 $u_{ps}$
= 3857.2 m s−1 and
 $M_{ps}$
= 4.875 are the post-shock streamwise velocity and Mach number, respectively, at
 $s$
= 1 m. For simplicity, these post-shock conditions are used as an approximation to the actual boundary-layer edge conditions, which vary slowly in the streamwise direction. From the phase speed plot, mode
 $F_1$
emerges from the fast acoustic spectrum at
 $c_r/u_{ps} \approx 1+1/M_{ps}$
near the leading edge and then decreases in phase speed moving downstream. It then crosses the entropy/vorticity spectrum at
 $c_r/u_{ps} \approx 1$
. The curve labelled mode
 $F_1$
actually corresponds to two distinct modes with different eigenfunctions on either side of the entropy/vorticity spectrum (Fedorov & Tumin Reference Fedorov and Tumin2011). However, this distinction is not particularly relevant to this study, so the entire curve will be simply be referred to as mode
 $F_1$
, as is common in the literature. Mode
 $S$
emerges from the slow acoustic spectrum at
 $c_r/u_{ps} \approx 1-1/M_{ps}$
near the leading edge and increases in phase speed moving downstream. Downstream of the entropy/vorticity/mode
 $F_1$
synchronisation point, mode
 $F_1$
is synchronised with mode
 $S$
. Even further downstream, mode
 $F_1$
becomes destabilised. This destabilisation is characteristic of Mack’s second-mode instability (Mack Reference Mack1984). The fact that mode
 $F_1$
is unstable, rather than mode
 $S$
, is consistent with the cold-wall conditions considered here. Note that it is common to refer to the mode that becomes unstable through the second-mode instability as the second mode. We adopt this nomenclature here, so the term second mode will refer to mode
 $F_1$
for the present flow conditions.
The LST and LPSE (a) phase speed and (b) growth rate for relevant discrete modes at
 $f$
= 600 kHz. The same plots are zoomed-in to the unstable region in (c) and (d), respectively. The LPSE computations are based on the wall pressure perturbation.

To gain a more complete view of the stability behaviour, the streamwise marching process for mode
 $F_1$
(the second mode) is repeated for a wide range of frequencies. This results in a 2-D stability map, showing the streamwise distances and frequencies at which the second mode is stable and unstable. Figure 8 depicts the second-mode stability map computed from LST. The branch I neutral stability curve (where the second mode first becomes unstable) and the branch II neutral stability curve (where the second mode becomes stable again) are also shown. Interestingly, there is no evidence of a supersonic mode here. The supersonic mode refers to an unstable second mode that propagates upstream supersonically relative to the mean flow at the boundary-layer edge, i.e.
 $c_r/u_{ps} \lt 1-1/M_{ps}$
, and is usually signified by a ‘kink’ in the growth rate curve and an extension of the branch II neutral curve further downstream and towards higher frequencies (Bitter & Shepherd Reference Bitter and Shepherd2015; Knisely & Zhong Reference Knisely and Zhong2019b
). The studies of Knisely & Zhong (Reference Knisely and Zhong2019
Reference Knisely and Zhong
b
,
Reference Knisely and Zhongc
), however, have observed supersonic modes for the same free-stream conditions and geometry. The lack of a supersonic mode here is due to the warmer wall that is used here, with
 $T_w$
= 600 K, as compared with their study, where
 $T_w$
= 300 K is used instead. This is consistent with the finding of Bitter & Shepherd (Reference Bitter and Shepherd2015) that increasing the wall temperature tends to suppress the supersonic mode. In any case, since supersonic modes generally occur far downstream of the branch I neutral point, they are not expected to affect receptivity coefficients.
The LST stability map for the TCNE case. Contoured areas correspond to regions where mode
 $F_1$
is unstable.

We now consider how non-parallel effects impact the second mode by referring back to figure 7. The LPSE phase speed agrees well with LST, except for a small region in the vicinity of the mode
 $F_1$
/
 $S$
synchronisation point. The growth rates on the other hand show more noticeable discrepancies, and the LPSE predicts a higher peak growth rate and a downstream-shifted unstable region compared with LST. Note that the LPSE results presented in the figure are based on the wall pressure perturbation. Although not shown here, we can make similar growth rate comparisons for several other disturbance quantities, namely the peak mass flux
 $|(\rho u)' + (\rho v)'|_{max}$
, kinetic energy (given by 4.4) and the peak amplitudes of the primitive variables in (4.2). Between these quantities, the increase in peak growth rate relative to LST is strongest for the wall pressure perturbation and weakest for the streamwise velocity
 $|u'|_{max}$
. Figure 9 compares the
 $N$
-factor curves and envelopes obtained using the two stability frameworks. The LPSE
 $N$
-factors shown are based on the wall pressure perturbation and the streamwise velocity. The
 $N$
-factor curves and envelopes for the other mentioned disturbance quantities lie between these two quantities. It is evident that the LPSE predicts smaller peak
 $N$
-factors and
 $N$
-factor envelopes compared with LST. By the end of the domain, the LPSE
 $N$
-factor envelope based on the wall pressure perturbation and streamwise velocity is approximately 0.1 and 0.3 lower, respectively, compared with the LST
 $N$
-factor envelope. It is interesting to note that the
 $N$
-factor envelope is smaller when using LPSE, although the LPSE shows higher peak growth rates than LST. This is because when using LPSE, the unstable region is shifted further downstream. In any case, the lower peak
 $N$
-factors and
 $N$
-factor envelope when using LPSE indicate that non-parallel effects are slightly stabilising to the second mode here. Similar findings with respect to the non-parallel effect on the second mode were made by Zanus et al. (Reference Zanus, Knisely, Miró Miró and Pinna2020a
), although their case featured an unstable supersonic mode due to a colder wall at
 $T_w$
= 300 K.
The LPSE and LST
 $N$
-factor curves for TCNE case. Each curve is spaced
 $\Delta f$
= 100 kHz from the next.

The weak overall discrepancy between LPSE and LST is due to the fact that non-parallel effects tend to weaken with decreasing free-stream Mach numbers. Nevertheless, even small variations in
 $N$
-factors can lead to significant discrepancies in amplification ratios (
 $e^N$
). For example, if
 $N$
and
 $e^N$
are evaluated at
 $s$
= 0.8 m for
 $f$
= 600 kHz, LST predicts
 $N \approx$
3.12 and
 $e^N \approx$
22.6. On the other hand, the LPSE, based on the wall pressure perturbation, predicts
 $N \approx$
2.82 and
 $e^N \approx$
16.8. Here, LST overpredicts the
 $N$
-factor only by approximately 10
 $\,\%$
but overpredicts
 $e^N$
by approximately 35
 $\,\%$
. This is a significant discrepancy, and is important to keep in mind, since the method that will be used to estimate receptivity coefficients later on requires
 $e^N$
values as input. Given the potential for significant discrepancies in
 $e^N$
due to non-parallel effects, using LPSE is necessary to obtain reliably accurate estimates of receptivity coefficients.
6.2. Frozen case
Returning to figure 7, the difference in phase speed between the TCNE and frozen cases is practically negligible. On the other hand, the second-mode growth rate shows noticeable discrepancies. Both LPSE and LST results show that the TCNE peak growth rate is approximately 8
 $\,\%$
higher than the frozen peak growth rate. In addition, both branch I and II neutral points are shifted downstream compared with the frozen case. Because the branch II neutral point is shifted downstream further than the branch I neutral point, the instability region is actually longer in the TCNE case. Lastly, figure 10 shows that, in the TCNE case, the unstable frequency range is shifted towards higher frequencies, while the peak growth rate at a fixed streamwise location is increased.
Comparison of LST second-mode growth rates between the TCNE, frozen and hybrid (TCNE mean flow, frozen disturbance) cases.

As mentioned in the introduction, real-gas effects (or more specifically, TCNE effects) enter the linear stability problem via two routes. The first route indirectly affects stability by modifying the mean flow. The second route directly affects stability by acting on the disturbance itself. To identify the relevant route, figure 10 also includes a hybrid case using the TCNE mean flow but with a frozen disturbance model. The frozen disturbance model is defined as one where perturbations in the chemical production terms (
 $\omega^{\prime} _s$
) and translation–vibration energy transfer terms (
 $Q^{\prime}_{T-V,s}$
) are neglected. Evidently, there is very little difference between the TCNE and hybrid cases, where the mean flow is the same (TCNE) but the disturbance models are different. However, there are significant discrepancies between the hybrid and frozen cases, where the disturbance model is the same (frozen), but the mean flows are different. This result implies that, for this flow configuration, TCNE effects influence stability primarily by modifying the mean flow. This modification was shown earlier to result in an overall cooling of the boundary layer with reduced translation–rotation temperatures. Similar results were found by Bitter & Shepherd (Reference Bitter and Shepherd2015) and Knisely & Zhong (Reference Knisely and Zhong2020).
Note that the shift of the unstable region further downstream and towards higher frequencies, as well as the higher peak growth rates in the TCNE case, are characteristic of wall cooling as well (see e.g. Kara, Balakumar & Kandil Reference Kara, Balakumar and Kandil2008). Hence, TCNE effects on stability are analogous to that of wall cooling for this flow.
Also note that the result shown in figure 10 differs from that of Johnson et al. (Reference Johnson, Seipp and Candler1998), who found that TCNE effects shifted the unstable frequency range towards higher frequencies (as is the case here) but also noticeably reduced the peak growth rate at a fixed streamwise location, unlike the present case. The discrepancy between the present result and that of Johnson et al. (Reference Johnson, Seipp and Candler1998) can be explained by the fact that TCNE effects are comparatively weak in the present case. That is, in their case, TCNE effects had significant impacts not only on the mean flow but also on the disturbance itself, with the TCNE effect on the disturbance itself tending to reduce growth rates.
The TCNE effect on the second-mode
 $N$
-factors is shown in figure 11, which compares the LPSE
 $N$
-factors based on the wall pressure perturbations between the two gas models. For a fixed frequency, the discrepancies between the two gas models are relatively small for a sizable portion of the unstable region. However, the TCNE
 $N$
-factors overtake the frozen
 $N$
-factors by a significant margin closer to the branch II neutral point (that is, the point corresponding to the peak
 $N$
-factor for each frequency). Additionally, by the end of the domain (
 $s$
= 1.25 m) the TCNE
 $N$
-factor envelope is approximately 0.9 higher than the frozen
 $N$
-factor envelope. Similar results are found for the other disturbance quantities mentioned in the previous subsection. These results indicate that TCNE effects are destabilising to the second mode here.
Comparison of LPSE
 $N$
-factor curves and envelopes between the TCNE and frozen cases. Each curve is spaced
 $\Delta f$
= 50 kHz from the next. The
 $N$
-factors are based on the wall pressure perturbation.

7. Unsteady DNS results
To investigate the receptivity process, we perform unsteady DNS in which both slow and fast acoustic planar waves (with the parameters discussed in § 4) are imposed onto the previously converged steady-state solution. In each subdomain, the unsteady simulations are run until the initial transients exit the subdomain and the flow field becomes temporally periodic. The unsteady data are then stored over one additional period for FFT analysis.
Before discussing the results, it is helpful to recall the relevant receptivity mechanisms. According to Fedorov & Khokhlov (Reference Fedorov and Khokhlov2001), receptivity to free-stream disturbances in a hypersonic boundary layer occurs primarily through the synchronisation (the matching of phase speeds) of the discrete modes (mode
 $F_1$
, mode
 $S$
, etc.) with waves from the continuous spectra (slow and fast acoustic waves, entropy waves and vorticity waves). When two waves are sufficiently synchronised, they can excite each other. Toward the leading edge, slow (fast) acoustic waves can excite mode
 $S$
(mode
 $F_1$
) owing to their synchronisation. Downstream, entropy and vorticity waves can excite mode
 $F_1$
owing to their synchronisation (Fedorov & Tumin Reference Fedorov and Tumin2003). Even further downstream, the synchronisation of mode
 $S$
and mode
 $F_1$
allows the two modes to excite one another.
7.1. The TCNE case
7.1.1. Slow acoustic waves
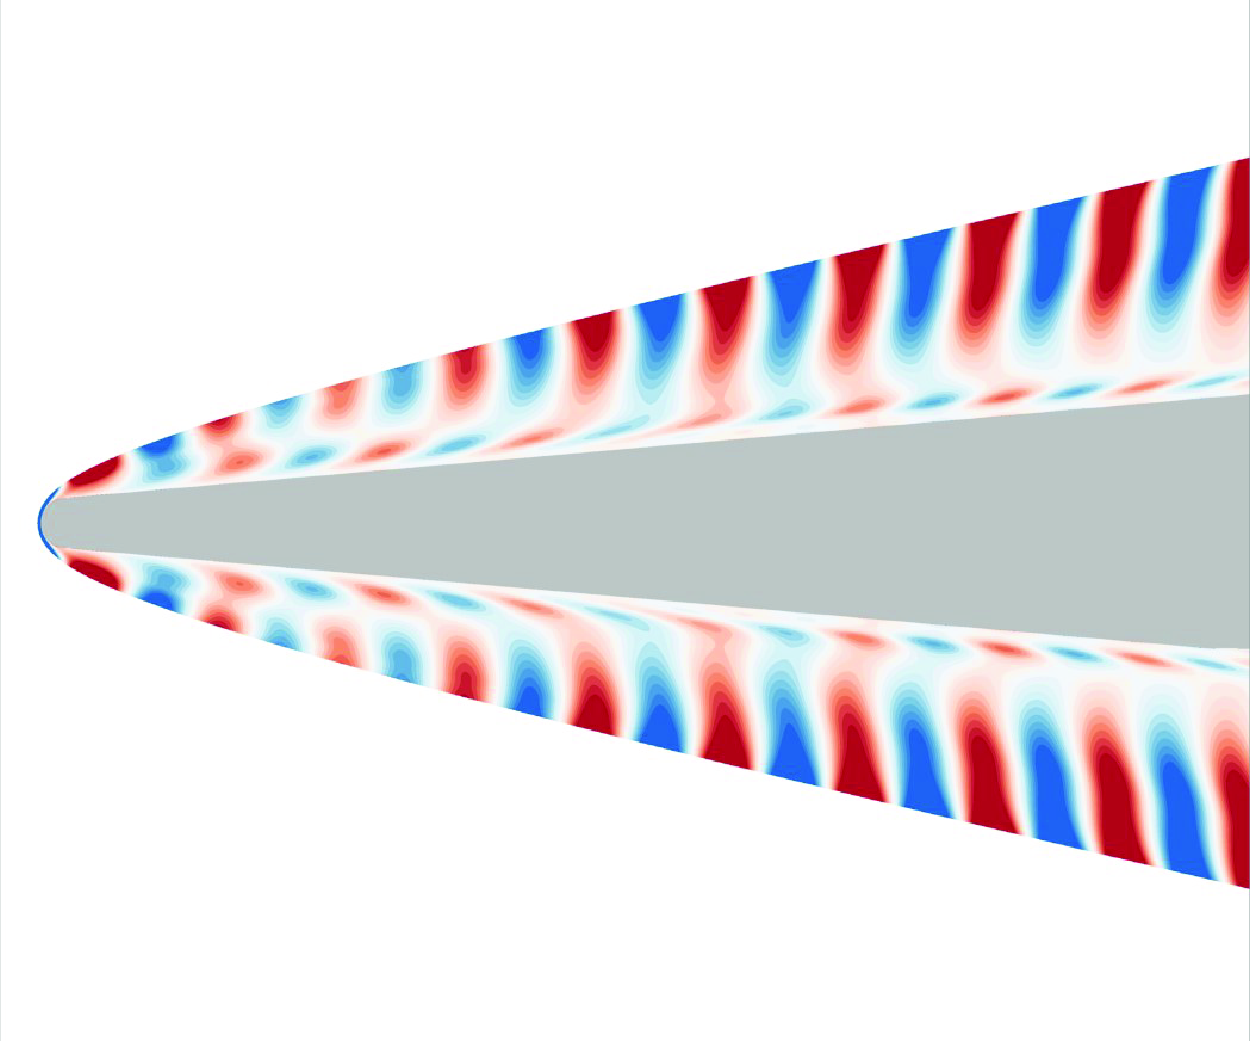
Free-stream slow acoustic waves are considered first. Figure 12 shows the associated density perturbations near the leading edge and behind the shock for
 $f$
= 600 kHz. The boundary-layer thickness,
 $\delta$
, as defined through the 99.5
 $\,\%$
total enthalpy criterion, is also shown. Two regions can be identified within the disturbance field. The first region is the shock layer, which is defined here as the region between the edge of the boundary layer and the shock. The mean flow in the shock layer is mostly inviscid. By measuring the streamwise wavelengths of the disturbances emanating from the shock, it can be shown that the density perturbations in the shock layer are primarily due to slow acoustic waves. The second region is the boundary layer. The disturbance here is more difficult to characterise based on the perturbation contours alone. A more reliable way to identify the different waves present in the boundary layer is to compute streamwise phase speeds.
Snapshot of unsteady DNS density perturbation contours near the leading edge for free-stream slow acoustic waves at
 $f$
= 600 kHz in the TCNE case. The black line represents the boundary-layer thickness defined through the 99.5
 $\,\%$
total enthalpy criterion. The contours are clipped to better show disturbance structure.

Figure 13(a) shows the phase speed of the disturbance at the same frequency. The DNS phase speed is computed using the wall pressure perturbation (
 $p^{\prime}_w$
) and the density perturbation (
 $\rho '$
) at
 $y_n$
= 0.9 mm, which is a position located away from the wall but is close to or within the boundary layer, with the ratio
 $y_n/\delta$
varying from 1.86 at
 $s$
= 0.01 m to 0.45 at
 $s$
= 0.65 m. The phase speed based on the wall pressure perturbation is computed from the FFT output using (4.15). The phase speed based on the density perturbation is estimated from a snapshot of the disturbance field as
 $c_r \approx 2 f \Delta s_z$
, where
 $\Delta s_z$
is the distance between successive zeros in the streamwise direction (Fedorov et al. Reference Fedorov, Ryzhov, Soudakov and Utyuzhnikov2013). The phase speed towards the leading edge oscillates about the slow acoustic spectrum or the entropy/vorticity spectrum, depending on the wall-normal position and the disturbance quantity considered. The former indicates the presence of slow acoustic waves. Since mode
 $S$
is excited by slow acoustic waves near the leading edge owing to their synchronisation, it can be inferred that mode
 $S$
is also present. The latter indicates the presence of entropy/vorticity waves. Because of their similar phase speeds, it is not possible to determine whether these waves are primarily entropy waves or vorticity waves, at least within the scope of the present study. Accordingly, we use the term ‘entropy/vorticity waves’ to be inclusive of both wave types.
Comparison of (a) phase speed and (b) growth rate between unsteady DNS, LST and LPSE for free-stream slow acoustic waves at
 $f$
= 600 kHz in the TCNE case.

Figure 14 shows the density perturbations further downstream, in the vicinity of the entropy/vorticity/mode
 $F_1$
synchronisation point at
 $s$
= 0.5 m. Again, the density perturbations far outside the boundary layer are primarily due to slow acoustic waves, as can be verified by measuring the streamwise wavelengths directly from the contours. Figure 13(a) shows that between
 $s \approx$
0.4 and
 $s \approx$
0.5 m, the phase speed is close to the entropy/vorticity spectrum, indicating the presence of entropy/vorticity waves. In the vicinity of the synchronisation point mentioned above, we expect mode
 $F_1$
to be excited by these entropy/vorticity waves.
Snapshot of unsteady DNS density perturbation contours in the vicinity of the entropy/vorticity/mode
 $F_1$
synchronisation point for free-stream slow acoustic waves at
 $f$
= 600 kHz in the TCNE case. The black line represents the boundary-layer thickness defined through the 99.5
 $\,\%$
total enthalpy criterion. The contours are clipped to better show disturbance structure.

Note that the phase speed towards the leading edge never oscillates about mode
 $F_1$
or the fast acoustic spectrum, regardless of wall-normal position or disturbance quantity. Hence, if mode
 $F_1$
is excited near the leading edge (by fast acoustic waves), it is most likely excited weakly compared with mode
 $S$
.
The oscillations in phase speed (figure 13a) and growth rate (figure 13b) are similar to those found in many receptivity studies, such as those of Zhong & Ma (Reference Zhong and Ma2006) and Cerminara & Sandham (Reference Cerminara and Sandham2017). These oscillations are likely due to interference between waves of different streamwise wavelengths. However, a strict verification of the underlying mechanism will require the use of multimode decomposition (see Gaydos & Tumin Reference Gaydos and Tumin2004; Miselis, Huang & Zhong Reference Miselis, Huang and Zhong2016 or Zou & Zhong Reference Zou and Zhong2023), which allows one to isolate the amplitude of each of the component modes in the boundary layer.
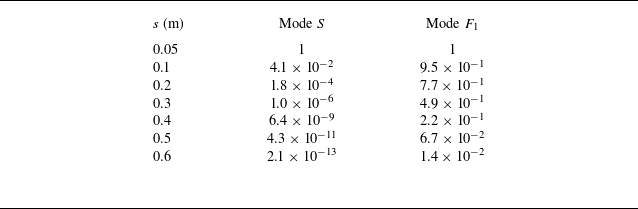
For this flow configuration, mode
 $S$
is exceptionally stable. This stability is demonstrated in table 2, which shows the LST-derived amplification ratios of modes
 $S$
and
 $F_1$
and at various streamwise locations relative to
 $s$
= 0.05 m for
 $f$
= 600 kHz. Now, in the LST framework, mode
 $S$
is always stable. This is not the case in the DNS, where mode
 $S$
amplifies when excited by other waves in the boundary layer (e.g. by slow acoustic waves near the leading edge) and decays otherwise. Nevertheless, because of its high level of inherent stability, mode
 $S$
may be attenuated so strongly that it reaches the mode
 $F_1$
/
 $S$
synchronisation region (in the vicinity of
 $s$
= 0.594 m at this frequency) with a much lower amplitude than mode
 $F_1$
. Now, the relevance of mode
 $S$
in the receptivity process derives from its synchronisation with mode
 $F_1$
. If mode
 $S$
is much weaker than mode
 $F_1$
, we can effectively treat mode
 $S$
as if it were not present to begin with. Hence, the excitation of mode
 $S$
by slow acoustic waves may be secondary, or even irrelevant, in terms of its contribution to the amplitude of mode
 $F_1$
at the branch I neutral point, compared with the direct excitation of mode
 $F_1$
(by entropy/vorticity waves and fast acoustic waves).
The LST-derived amplification ratios at various streamwise locations for mode
 $S$
and mode
 $F_1$
relative to
 $s$
= 0.05 m at
 $f$
= 600 kHz.

The evolution of the boundary-layer disturbance can be understood further by considering the wall pressure perturbation amplitude, as shown in figure 15. At
 $f$
= 400 kHz, the branch I neutral point is downstream of
 $s$
= 1.25 m (the end of the domain), and as such, second-mode amplification is not observed. For the remaining frequencies (including those not shown in the figure), two distinct regions can be identified. The first region is upstream of the branch I neutral point. Here, the amplitude generally decreases in the streamwise direction, but is highly oscillatory. There is a noticeable amplification of the disturbance in the vicinity of the entropy/vorticity/mode
 $F_1$
synchronisation point which is likely due to the interaction between mode
 $F_1$
and the entropy/vorticity waves. A similar amplification was noted by Fedorov et al. (Reference Fedorov, Ryzhov, Soudakov and Utyuzhnikov2013) in the context of receptivity to temperature spots. The second region is downstream of the branch I neutral point. Here, there is a clear increase in amplitude due to the second-mode instability of mode
 $F_1$
. At the same time, the amplitude curve becomes smoother as other waves contribute less and less to the overall disturbance.
Wall pressure perturbation amplitude vs. streamwise distance for free-stream slow acoustic waves at (a)
 $f$
= 400, (b)
 $f$
= 600, (c)
 $f$
= 800 and (d)
 $f$
= 1000 kHz, in the TCNE and frozen cases. The dash-dot lines indicate the branch I and II neutral points in the TCNE case based on LPSE.

In this study, receptivity coefficients are obtained by backtracking the initial amplitude of mode
 $F_1$
at the branch I neutral point from its amplitude downstream. This method is described in greater detail in § 7.1.3. To use this method, it is important to determine where mode
 $F_1$
becomes ‘sufficiently dominant’, a term which we define here to mean that the DNS amplitude approximates the amplitude of mode
 $F_1$
well enough to backtrack receptivity coefficients reliably. One way to do this is to look at the amplitude plot and find the point downstream of the branch I neutral point where the oscillations are sufficiently weak. Using this criterion, we can say that for 500 kHz
 $\leqslant f \leqslant$
900 kHz, mode
 $F_1$
becomes sufficiently dominant at least by the branch II neutral point. However, for
 $f$
= 1000 kHz, there are still noticeable oscillations present at the branch II neutral point, implying that mode
 $F_1$
does not become sufficiently dominant at this frequency. The main drawback with this method is that it is sometimes difficult to determine how strong the oscillations are if the underlying amplitude is increasing, which often limits its applicability to the region in the vicinity of the branch II neutral point.
Because of the difficulty mentioned above, it is sometimes preferable to instead use the phase speed and growth rate plots to estimate the point at which mode
 $F_1$
becomes sufficiently dominant. The oscillations in these quantities are usually easier to identify than the oscillations in amplitude, and can be easily compared with LST or LPSE results. Returning to figure 13, we find that both the phase speed and growth rate eventually begin to track mode
 $F_1$
as it becomes amplified via the second-mode instability. The oscillations in both quantities become negligible around
 $s$
= 0.8 m, which means that mode
 $F_1$
has become sufficiently dominant at least by this point. After this point, there is decent agreement between the DNS results and the LST mode
 $F_1$
and LPSE results. Furthermore, the LPSE growth rate matches much more closely with the DNS, since non-parallel effects are included in the LPSE framework.
Figure 16 shows the pressure perturbation profiles at two locations within the unstable region. The first location considered is
 $s$
= 0.658 m, where there are noticeable discrepancies between the DNS profile and the LST mode
 $F_1$
and LPSE profiles towards the upper portion of the boundary layer. These discrepancies are due to weak second-mode amplification and the presence of slow acoustic and entropy/vorticity waves. On the other hand, at
 $s$
= 0.802 m, the DNS profile matches well with the LST mode
 $F_1$
and LPSE profiles, confirming that mode
 $F_1$
is sufficiently dominant at this point.
Comparison of wall-normal pressure perturbation profiles between unsteady DNS, LST and LPSE for free-stream slow acoustic waves at
 $f$
= 600 kHz in the TCNE case. Panels show (a)
 $s$
= 0.658 m and (b)
 $s$
= 0.802 m.

7.1.2. Fast acoustic waves
We now consider fast acoustic waves imposed in the free stream. Figure 17 shows the density perturbations near the leading edge at
 $f$
= 600 kHz. The density perturbations in the shock layer are primarily due to fast acoustic waves, as confirmed by measuring the streamwise wavelengths of the disturbances emanating from the shock. As before, we compute phase speeds to identify the different types of waves in the boundary layer. Figure 18 shows the estimated phase speed based on the wall pressure perturbation for the same frequency. Other quantities and/or wall-normal positions in the boundary layer show qualitatively similar results. Towards the leading edge, the phase speed oscillates about the phase speed of mode
 $F_1$
. However, since mode
 $F_1$
is excited by fast acoustic waves near the leading edge, we can infer that fast acoustic waves are also present in the boundary layer here.
Snapshot of unsteady DNS density perturbation contours near the leading edge for free-stream fast acoustic waves at
 $f$
= 600 kHz in the TCNE case. The black line represents the boundary-layer thickness defined through the 99.5
 $\,\%$
total enthalpy criterion. The contours are clipped to better show the disturbance structure.

Figure 18 also shows the phase speed of mode
 $F_2$
. This mode belongs to the same family of modes as mode
 $F_1$
. However, mode
 $F_2$
exits the fast acoustic spectrum much further downstream than mode
 $F_1$
. The line labelled ‘mode
 $F_2$
’ corresponds to both a fast acoustic mode and mode
 $F_2$
. Towards the leading edge, the LST solver seems to track a fast acoustic mode, which explains the rapid increase in phase speed past
 $c_r/u_{ps}$
=
 $1 + 1/M_{ps}$
there. It is unclear where the line transitions from a fast acoustic mode to mode
 $F_2$
, i.e. where mode
 $F_2$
emerges from the fast acoustic spectrum as a distinct mode. Therefore, if the DNS phase speed is close to the fast acoustic spectrum, it may indicate the presence of (i) fast acoustic waves only or (ii) a combination of fast acoustic waves and mode
 $F_2$
, depending on the streamwise location.
Comparison of phase speed between unsteady DNS, LST and LPSE for free-stream fast acoustic waves at
 $f$
= 600 kHz in the TCNE case. The DNS and LPSE results are obtained using the wall pressure perturbation.

Moving downstream from the leading edge, the phase speed eventually shifts away from mode
 $F_1$
and towards the fast acoustic spectrum. This behaviour is explained by the fact that mode
 $F_1$
begins to decay at some point downstream owing to its gradual desynchronisation with the fast acoustic waves, and because mode
 $F_1$
is nominally stable upstream of the branch I neutral point. Hence, the amplitude of mode
 $F_1$
becomes lower than the amplitude of the fast acoustic waves or, if mode
 $F_2$
is also present, their combined amplitudes (i.e. the sum of their amplitudes). This causes the phase speed to shift towards the fast acoustic spectrum.
Moving even further downstream towards the entropy/vorticity/mode
 $F_1$
synchronisation point at
 $s \approx$
0.5 m, the phase speeds remain close to the fast acoustic spectrum, indicating that the waves in the boundary layer continue to primarily be fast acoustic waves or a mixture of fast acoustic waves and mode
 $F_2$
.
In this case, the oscillations in phase speed (and amplitude) are consistent with interference between mode
 $F_1$
and fast acoustic waves (or a mixture of fast acoustic waves and mode
 $F_2$
). This will be shown later. For now, it suffices to say that, near the leading edge, the presence of mode
 $S$
should cause secondary oscillations of very short length scales due to the large wavelength difference between mode
 $S$
and the waves mentioned earlier. Such oscillations are not observed here, which indicates that mode
 $S$
, if present, is very weak compared with mode
 $F_1$
. Combined with the fact that mode
 $S$
is highly stable (see discussion in § 7.1.1), the excitation of mode
 $S$
by slow acoustic waves is unlikely to be a relevant receptivity mechanism in this case. On a separate note, the decay of mode
 $F_1$
moving downstream from the leading edge could allow it to interact with weak entropy/vorticity waves as it synchronises with the entropy/vorticity spectrum. Because of the strong oscillations in amplitude due to interference (see figure 19), it is difficult to tell if there is any local amplification that would indicate an interaction between mode
 $F_1$
and the entropy/vorticity waves. Hence, it is unclear whether the excitation of mode
 $F_1$
by entropy/vorticity waves is significant.
Wall pressure perturbation amplitude vs. streamwise distance for free-stream fast acoustic waves at (a)
 $f$
= 400, (b)
 $f$
= 600, (c)
 $f$
= 800 and (d)
 $f$
= 1000 kHz, in the TCNE and frozen cases. The dash-dot lines indicate the branch I and II neutral points in the TCNE case based on LPSE.

The wall pressure perturbation amplitudes for the fast acoustic wave case are presented in figure 19. For
 $f$
= 400 kHz, there is no observed second-mode amplification, since the branch I point is downstream of the end of the domain. For
 $f$
= 500 kHz (not shown) and
 $f$
= 600 kHz, second-mode amplification can be clearly identified, but there are strong oscillations well into the unstable region, unlike what was found in the slow acoustic wave case. These oscillations (which can be found for all considered frequencies) are due to interference between mode
 $F_1$
and fast acoustic waves (or a mixture of fast acoustic waves and mode
 $F_2$
). The persistence of these oscillations up to the branch II neutral point implies that mode
 $F_1$
never becomes sufficiently dominant. However, for these two frequencies (500 and 600 kHz), mode
 $F_1$
does at least surpass the combined amplitude of the other waves through second-mode amplification. This is demonstrated in figure 18, where the phase speed at
 $f$
= 600 kHz shifts towards that of mode
 $F_1$
around
 $s$
= 0.85 m.
Figure 20 compares the DNS pressure perturbation profiles with the LST/LPSE results for several streamwise locations near
 $s$
= 1 m for
 $f$
= 600 kHz. These locations correspond to different points along the oscillations in wall pressure perturbation amplitude, as shown in the inset of the figure. For brevity, the LST and LPSE profiles are shown only for
 $s$
= 1.0021 m, keeping in mind that the LST and LPSE profiles do not change significantly between the locations considered. The effect of interference on the perturbation throughout the boundary layer is seen through the differences in the shapes of the DNS profiles between these locations. The DNS profiles show poor overall agreement with the LST mode
 $F_1$
eigenfunction and the LPSE shape function, confirming that mode
 $F_1$
does not become sufficiently dominant despite second-mode amplification.
Comparison of wall-normal pressure perturbation profiles between unsteady DNS, LST and LPSE near
 $s$
= 1 m for free-stream fast acoustic waves at
 $f$
= 600 kHz in the TCNE case.

For
 $f \geqslant$
700 kHz, second-mode amplification is weak enough that mode
 $F_1$
never surpasses the combined amplitude of the other waves. Accordingly, the phase speed at these frequencies (not shown) does not shift towards that of mode
 $F_1$
even after second-mode amplification. This result, combined with the observation that the location of the apparent peak disagrees with that of the branch II neutral point, suggests that the amplification seen in figure 19 for
 $f$
= 800 and 1000 kHz is unrelated to second-mode amplification. However, Ma & Zhong (Reference Ma and Zhong2003a
,
Reference Ma and Zhongb
) and Zhong & Ma (Reference Zhong and Ma2006) found that there can be a notable downstream amplification due to the excitation of mode
 $F_2$
by fast acoustic waves (owing to their synchronisation). This is likely the case here.
An interesting observation is that for
 $f$
= 1000 kHz, the amplitude curve is fairly smooth past
 $s \approx$
0.2 m. Now, since the oscillations are due to interference between mode
 $F_1$
, fast acoustic waves and mode
 $F_2$
(as will be shown later), it can be concluded that the observed smoothness past
 $s \approx$
0.2 m is due to the fast acoustic waves (or the combination of fast acoustic waves and mode
 $F_2$
) being particularly strong compared with the amplitude of mode
 $F_1$
, which undergoes weak second-mode amplification at this frequency.
It is possible to directly verify that the oscillations in amplitude are due to interference between waves. If a disturbance consists of two waves with different phase speeds, the expression given by De Tullio & Sandham (Reference De Tullio and Sandham2015) can be used to estimate the peak-to-peak distance in the oscillations of the disturbance amplitude owing to their interference. This expression is written as
 \begin{equation} \Delta s = \frac {c_{r,A}c_{r,B}}{f |c_{r,A}-c_{r,B}|}, \end{equation}
where
 $\Delta s$
is the peak-to-peak distance and
 $c_{r,A}$
and
 $c_{r,B}$
are the phase speeds of waves A and B, respectively. Consider wave A to have a phase speed near the fast acoustic spectrum, so that
 $c_{r,A} \approx$
1.205
 $u_{\!ps}$
. Consider wave B to be mode
 $F_1$
, keeping in mind that
 $c_{r,B}$
must be adjusted according to the local phase speed of mode
 $F_1$
. The peak-to-peak distance shown in the inset of figure 19(b) for
 $f$
= 600 kHz is measured to be approximately 16.3 mm. Using the above expression with the phase speed of mode
 $F_1$
evaluated at the midpoint of the two peaks, the peak-to-peak distance is approximately 16.2 mm, showing excellent agreement with the DNS results. The agreement at other locations is not quite as good, but still decent overall. The relative error is approximately 9
 $\,\%$
for the first set of peaks near the leading edge, 5
 $\,\%$
for the second set and so on, continuing to decrease downstream. This indicates that the oscillations are due to interference between mode
 $F_1$
and a wave (or a combination of waves) whose phase speed(s) is (are) close to the fast acoustic spectrum. In other words, the oscillations are due to interference between mode
 $F_1$
and the fast acoustic waves or, if mode
 $F_2$
is present, a combination of both waves. A similar analysis can be performed for the phase speed plots.
The origin of the oscillations is the same for all considered frequencies. However, a notable exception is that there are long-period oscillations that appear some distance downstream of the branch II neutral point at higher frequencies (see the amplitude curves for
 $f$
= 800 and 1000 kHz in figure 19). These oscillations are instead more consistent with interference between mode
 $F_2$
and the fast acoustic waves.
7.1.3. Receptivity coefficients
A key objective in a receptivity study is to obtain receptivity coefficients. Generally, the receptivity coefficient (denoted by
 $C_R$
) is defined as
 $C_R$
=
 $A_0/A_\infty$
, where
 $A_0$
is the amplitude of the unstable mode at the branch I neutral point, and
 $A_\infty$
is the amplitude of the free-stream disturbance. Unfortunately, obtaining
 $A_0$
is not straightforward, since the boundary-layer disturbance in the DNS contains many competing modes at the branch I neutral point. However, it is still possible to estimate the receptivity coefficient by using a backtracking method, as Ma & Zhong (Reference Ma and Zhong2003b
) have done. The premise of this method is that if the amplitude of the unstable mode is known at some point downstream of the branch I neutral point, then dividing that amplitude by the corresponding
 $N$
-factor at the point allows for the branch I amplitude to be estimated. Rearranging (4.9), the branch I amplitude of the unstable mode can be estimated as
 \begin{equation} A_0 = A(s_0) = \frac {A(s)}{\int _{s_0}^{s} \sigma (s) \,ds} = \frac {A(s)}{e^{N(s)}} .\end{equation}
Here, the amplitude
 $A$
is obtained by sampling the unsteady DNS perturbation at some point downstream of the branch I neutral point where the unstable mode is sufficiently dominant. The value of
 $e^N$
at the same point can be obtained from LST or LPSE. As mentioned before, the location at which the unstable mode becomes sufficiently dominant can be found by looking at the amplitude, phase speed or growth rate plots. We expect that mode
 $F_1$
reaches its highest amplitude, and is hence most dominant, near the branch II neutral point. Therefore, the sampling location is taken to be the branch II neutral point (as predicted by the LPSE) except in cases where the branch II neutral point is outside the computational domain, in which case the last point in the domain is used. Here, the receptivity coefficient is evaluated using the wall pressure perturbation amplitude normalised by the free-stream pressure perturbation amplitude, so that
 $C_R$
=
 $|p^{\prime}_w(s_0)|/|p^{\prime}_\infty |$
.
A major limitation to the methodology described above is that, for a given frequency, there must exist a location where the unstable mode is sufficiently dominant in the DNS. An exception to this is that, if the unstable mode is greater than the combined amplitude of the other waves, but not sufficiently dominant, the phase speed and growth rate tend to oscillate about the solution for the unstable mode. This was, for example, seen for
 $f$
= 600 kHz in the fast acoustic wave case (figure 18). In this scenario, it is possible to filter out the oscillations and approximately recover the amplitude of mode
 $F_1$
by using a smoothing algorithm.
The smoothing is performed using the locally estimated scatterplot smoothing method of Cleveland & Devlin (Reference Cleveland and Devlin1986). This method requires the user to specify a window length, denoted by
 $L$
, on which the smoothing is performed. The ratio of
 $L$
to the length scale of the oscillations/variations in amplitude determines the level of smoothing, with large ratios corresponding to more smoothing and vice versa. The relevant oscillation length scale is the peak-to-peak distance (denoted by
 $\Delta s$
), which can be estimated at a given sampling location by using (7.1) or by direct measurement. Figure 21(a) shows the amplitude plotted versus
 $L/\Delta s$
at the branch II neutral point (predicted by LPSE) in the fast acoustic wave case at
 $f$
= 600 kHz. Because the unsmoothed amplitude is near a local minimum in the oscillations, increasing
 $L$
initially leads to a sharp increase in amplitude. Also, since the oscillations have a relatively short length scale, they become damped with small
 $L$
. However, since the underlying amplitude variation of mode
 $F_1$
occurs over much longer length scales,
 $L$
must be increased substantially before mode
 $F_1$
itself is damped. Based on this observation, the optimal
 $L$
presumably lies in the region immediately after the oscillations have been damped. For the case shown in figure 21(a), we chose
 $L/\Delta s$
= 8 (shown as the vertical dashed line) as the window length. The smoothed amplitude curves for this case are shown in figure 21(b) for different values of
 $L/\Delta s$
. Reasonable values of
 $L/\Delta s$
seem to vary between 6 and 8 for the other fast acoustic wave cases. We used
 $L/\Delta s$
= 5 in the slow acoustic wave case for
 $f$
= 1000 kHz. As an additional verification of the smoothing procedure, we applied it to the slow acoustic wave case at
 $f$
= 600 kHz, where oscillations near the branch II neutral point are negligible to begin with. Now, in this study, the largest
 $L$
relative to the underlying variation of mode
 $F_1$
, i.e. the strongest smoothing, corresponds to
 $L/\Delta s$
= 5 in the slow acoustic wave case at
 $f$
= 1000 kHz. For the purposes of this verification we can obtain a roughly equivalent peak-to-peak distance for
 $f$
= 600 kHz by taking the peak-to-peak distance near the branch II neutral point in the slow acoustic wave case at
 $f$
= 1000 kHz and multiplying it by 5/3, the ratio of the two frequencies. Figure 21(c) shows the result. It is evident that even the strongest smoothing has a negligible effect on the amplitude of mode
 $F_1$
itself.
(a) Amplitude versus
 $L/\Delta s$
at the LPSE branch II neutral point (s
 $\approx$
1.04 m) in the TCNE fast acoustic wave case at
 $f$
= 600 kHz. (b) Amplitude curves near the branch II neutral point in the TCNE fast acoustic wave case at
 $f$
= 600 kHz for several values of
 $L/\Delta s$
. (c) Unsmoothed and smoothed (
 $L/\Delta s$
= 8) amplitude curves near the branch II neutral point in the TCNE slow acoustic wave case at
 $f$
= 600 kHz.

Using the backtracking method, receptivity coefficients can be computed without smoothing for 500 kHz
 $\leqslant f \leqslant$
900 kHz in the slow acoustic wave case or with smoothing for
 $f$
= 1000 kHz in the slow acoustic wave case and
 $f$
= 500 and 600 kHz in the fast acoustic wave case. In all other cases, it is not possible to compute receptivity coefficients, at least within the scope of the present study. These cases are
 $f$
= 400 kHz in both the slow and fast acoustic wave cases, where the unstable region is downstream of the end of the domain, and
 $f \geqslant$
700 kHz in the fast acoustic wave case, where mode
 $F_1$
never exceeds the amplitude of the fast acoustic waves, thus preventing the use of smoothing. Obtaining receptivity coefficients in the latter scenario is likely to require multimode decomposition of the DNS results.
The second-mode receptivity coefficients are shown in figure 22. Only the TCNE case is considered in the present discussion. At
 $f$
= 500 and 600 kHz, the receptivity coefficients in the fast acoustic wave case are much larger than the slow acoustic wave case. In other words, the fast acoustic waves excite the second mode more strongly than slow acoustic waves at these frequencies. From this result, it would be fair to assume that transition would occur earlier if purely fast acoustic waves were imposed in the free stream rather than slow acoustic waves. However, this is an unrealistic scenario. Recent studies have shown that in hypersonic wind tunnels, the free-stream acoustic waves are primarily slow acoustic waves (Duan, Choudhari & Wu Reference Duan, Choudhari and Wu2014; Wagner et al. Reference Wagner, Schülein, Petervari, Hannemann, Ali, Cerminara and Sandham2018). Another interesting result is that the fast acoustic receptivity coefficient at
 $f$
= 600 kHz is slightly smaller than at
 $f$
= 500 kHz, contradicting the results for the slow acoustic waves, where the receptivity coefficients increase with frequency. However, due to the lack of additional data points, it is unclear whether this trend would be continued.
Second-mode (mode
 $F_1$
) receptivity coefficients based on the wall pressure perturbation amplitude. Receptivity coefficients are estimated using the backtracking method with
 $N$
-factors from LPSE.

7.2. Frozen case
Comparing the unsteady DNS results between the two gas models, we find that in both the slow acoustic wave case (figure 15) and the fast acoustic wave case (figure 19), the amplitude curves are qualitatively similar, indicating that TCNE effects do not fundamentally change the receptivity mechanism. This can also be further verified by looking at the phase speed and growth rate plots, which for brevity are not shown here. However, for the frequencies at which mode
 $F_1$
surpasses the external waves in amplitude through second-mode amplification (
 $f \geqslant$
500 kHz in the slow acoustic wave case, and
 $f$
= 500 and 600 kHz in the fast acoustic wave case), the peak amplitudes attained through second-mode amplification are much higher in the TCNE case. For example, in both the slow and fast acoustic waves cases at
 $f$
= 600 kHz, the peak amplitude is about two times higher using the TCNE gas model.
Figure 22 shows that the receptivity coefficients in the TCNE case show the same frequency-dependent behaviour as the frozen case. This is unsurprising since the receptivity mechanism is essentially unchanged between the two gas models. However, the receptivity coefficients in the TCNE case are smaller by an average of approximately 9
 $\,\%$
in the slow acoustic wave case and 8
 $\,\%$
in the fast acoustic wave case. Recall, however, that the second mode attains higher peak
 $N$
-factors in the TCNE case. This means that TCNE effects have competing impacts on receptivity versus stability for the frequencies considered here.
The receptivity coefficients shown in figure 22 were obtained using the wall pressure perturbation amplitude. However, the comparison between the two gas models could change if other disturbance quantities are considered. To investigate this, we can use LST to obtain the eigenfunctions of the second mode at the branch I neutral point and then scale those eigenfunctions based on the wall pressure perturbation amplitude (i.e. the receptivity coefficients in figure 22). If we consider the peak amplitudes of density, streamwise velocity, wall-normal velocity and translation–rotation temperature, the reduction in amplitude in the TCNE case is similar or larger in magnitude compared with the wall pressure perturbation.
Although the destabilisation of the second mode in the TCNE case is due to the cooling of the mean flow, the specific mechanisms behind the reduction in receptivity coefficients is still unclear. A number of mechanisms could be relevant here, namely (i) a weakening of the external waves that excite mode
 $F_1$
, (ii) a reduction in the efficiency of the receptivity process, which could be characterised by the ratio of the amplitude of mode
 $F_1$
to the external waves and/or (iii) stronger decay of mode
 $F_1$
outside the regions where mode
 $F_1$
is excited. Unfortunately, the DNS results do not provide sufficient information to confirm these effects. For instance, in the slow acoustic wave case, the boundary-layer disturbance using the TCNE gas model is broadly attenuated for a number of key disturbance quantities for much of the flow field upstream of the branch I neutral point, as demonstrated in figure 23. However, the disturbance consists of slow acoustic waves, entropy/vorticity waves and mode
 $F_1$
, to varying degrees. As such, while it can be concluded that the overall disturbance is weaker in the TCNE case, we cannot make any further conclusions. In the fast acoustic wave case, we have found that the disturbance can either be stronger or weaker in the TCNE case, depending on the disturbance quantity and the streamwise/wall-normal positions. In this case it is unclear whether even the overall disturbance is necessarily stronger or weaker. Further investigation of the mechanisms mentioned above will require the use of multimode decomposition, which is outside of the scope of this study.
Comparison of disturbance amplitudes based on (a) translation–rotation temperature, (b) pressure, (c) streamwise velocity and (d) density at
 $s$
= 0.4 m and
 $f$
= 600 kHz in the slow acoustic wave case.

8. Conclusion
In this study, DNS, LST and LPSE were used to study boundary-layer receptivity to free-stream acoustic waves for a high-enthalpy Mach 5 flow over a cone. A TCNE gas model was used. The flow at the leading edge features moderate dissociation and is out of thermal equilibrium. On the cone frustum, however, the mixture composition returns to its pre-shock composition, but still does not reach thermal equilibrium, with
 $T_v \lt T$
in the boundary layer. The LST results showed that the instability mechanism was Mack’s second mode, with the unstable mode being mode
 $F_1$
. Using a newly developed LPSE code, non-parallel effects were found to be slightly stabilising to the second mode, leading to slightly lower peak
 $N$
-factors for a fixed frequency and a slightly smaller
 $N$
-factor envelope. Unsteady DNS was then performed to investigate the receptivity of the second mode to both fast and slow acoustic planar waves for a number of frequencies between 400 and 1000 kHz. For slow acoustic free-stream waves, second-mode receptivity coefficients were found to increase with frequency. Receptivity coefficients for the fast acoustic free-stream waves were obtained only for 500 and 600 kHz, but were much larger than the corresponding receptivity coefficients for the slow acoustic free-stream waves.
The TCNE effect on receptivity was investigated by comparing results between the TCNE case and a secondary case, using a thermochemically frozen gas model. The TCNE effects were found to have a cooling effect on the boundary layer, reducing overall translation–rotation temperatures. The TCNE effects were also found to be destabilising to the second mode, leading to larger peak
 $N$
-factors for a fixed frequency and a larger
 $N$
-factor envelope. In particular, the
 $N$
-factor envelope based on the wall pressure perturbation was approximately 0.9 higher by the end of the domain in the TCNE case. However, the second-mode receptivity coefficients for the TCNE case were on average approximately 9
 $\,\%$
smaller for the slow acoustic wave case and approximately 8
 $\,\%$
smaller for the fast acoustic wave case. The fact that the TCNE case had larger peak
 $N$
-factors for a fixed frequency, but smaller receptivity coefficients, means that TCNE effects have competing impacts on receptivity versus stability for the considered frequencies in this case.
These results suggest that the TCNE effect on transition is more complex than initially thought. In many cases of engineering interest, stability analyses predict TCNE effects to be destabilising to the second mode, which tends to shift transition locations upstream. However, if TCNE effects lead to a reduction in receptivity coefficients, then transition locations may not be shifted upstream as far as the stability analysis alone might suggest. In more extreme cases, the reduction in receptivity coefficients may be substantial enough to push transition locations downstream, rather than upstream. The results also suggest that, in some cases, it may be possible to purposely make use of the TCNE effect to delay transition through a reduction of receptivity coefficients.
It should be mentioned that this study is by no means a complete characterisation of receptivity for high-enthalpy boundary layers. To achieve this, further studies are necessary. For instance, multimode decomposition could be used to obtain receptivity coefficients for more frequencies in the fast acoustic wave case or to yield further insights into the TCNE effect on receptivity coefficients. Results could also differ in cases with higher stagnation enthalpies, where TCNE effects are expected to be stronger, or for other types of free-stream waves, such as planar waves at non-zero incident angles.
It should also be mentioned that we consider only thermochemically frozen acoustic waves in the free stream. To preface, at the considered free-stream temperatures, finite-rate chemistry effects are so weak that they can be readily neglected. However, 1-D non-equilibrium acoustic wave simulations, following the work of Wagnild (Reference Wagnild2012), show that vibrational relaxation is weak (i.e. frozen), with very small damping rates of at most 2.3
 $\times$
10
 $^{-2}$
m
 $^{-1}$
for the frequencies considered. Even so, a limitation arises in that the present results can be extended only to free-stream acoustic waves where the perturbations in
 $T_v$
are very small compared with the perturbations in
 $T$
. However, such cases are relevant because of the weak (frozen) vibrational relaxation (as shown by Wagnild). Nevertheless, if the above conditions are not fulfilled, results may change. Another limitation is that damping via vibrational relaxation is neglected. Although weak, these damping effects can add up over long propagation distances. To account for this, it is necessary to define a separate receptivity coefficient normalised by the free-stream disturbance amplitude at some fixed location upstream of the cone geometry. We hypothesise that the additional vibrational damping in the free stream would lower these receptivity coefficients relative to the frozen case even more substantially than the receptivity coefficients presented here.
Acknowledgements
This research was partially supported by the Air Force Office of Scientific Research (AFOSR) under Grant No. FA9550-19-1-0206, monitored by Dr S. Popkin and previously by Dr I. Leyva, by the Office of Naval Research (ONR) under Grant No. N00014-17-1-2343 monitored by Dr E. Marineau, and by Lawrence Livermore National Laboratory (LLNL) under subcontracts No. B642550 and B661774. Primary computational resources were provided by the Advanced Cyberinfrastructure Coordination Ecosystem: Services
 $\&$
Support (ACCESS), a continuation of the former Extreme Science and Engineering Discovery Environment (XSEDE), through the Texas Advanced Computing Center (TACC) and San Diego Supercomputer Center (SDSC) under grant No. TG-ASC090076 and through the Pittsburgh Supercomputing Center (PSC) under project No. PHY230094, supported by the National Science Foundation (NSF). Additional computational resources were provided by Livermore Computing under LLNL subcontracts No. B642550 and B661774. Prepared by LLNL under Contract DE-AC52-07NA27344. The views and conclusions contained herein are those of the authors and should not be interpreted as necessarily representing the official policies or endorsements, either expressed or implied, of ACCESS, the AFOSR, the ONR, LLNL or the U.S. Government.
Declaration of interests
The authors report no conflict of interest.
Appendix. Verification of LPSE Solver
The new LPSE code is validated for a high-enthalpy Mach 10 flow over a straight cone with a nose radius of 1 mm and a half-angle of 5
 $^{\circ }$
, first studied by Knisely & Zhong (Reference Knisely and Zhong2019a
). The free-stream conditions for this case are summarised in table 3. The free-stream stagnation enthalpy is 14.78 MJ kg−1. The wall is assumed to be isothermal, with both translation—–rotation and vibration temperatures set to 1000 K. The wall is also assumed to be supercatalytic for the species mass fractions.
Free-stream conditions for ach 10 straight-cone flow studied by Knisely & Zhong (Reference Knisely and Zhong2019 a).

Figure 24 compares the second-mode growth rates at
 $f$
= 700 kHz between the present LPSE solver and those used by Chang, Kline & Li (Reference Chang, Kline and Li2021) and Chen, Wang & Fu (Reference Chen, Wang and Fu2021). The growth rates are computed using the wall pressure perturbation. The data for the other studies wre obtained by digitising the published figures and should be within plotting accuracy of the original data. In our LPSE solution there exists a transient near
 $s$
= 0.2 m where the initial shape function (obtained from LST) adjusts to the non-parallel solution. As a result, there are oscillations in the growth rate that obscure the true location of the branch I neutral point. These oscillations are strongly dependent on the streamwise location at which the solution is initiated. However, for the purposes of this verification study, we did not attempt to search for the initial location that would minimise such oscillations. These oscillations dampen quickly, and as the second mode grows, the results are within the variations seen by the other studies beyond
 $s \approx$
0.28 m. This result gives us confidence that the LPSE solver has been implemented correctly.
Comparison of LPSE results for the Mach 10 case of Knisely & Zhong (Reference Knisely and Zhong2019a
), in terms of second-mode growth rates at
 $f$
= 700 kHz.