Introduction
Chemical weed control remains a widely used component of integrated weed management strategies because of its cost effectiveness and rapid removal of crop pests (Matthews et al. Reference Matthews, Bateman and Miller2014). However, the complexity of the pesticide application process (Ebert et al. Reference Ebert, Taylor, Downer and Hall1999) has contributed to inefficient and improper applications (Grisso et al. Reference Grisso, Dickey and Schulze1989; Ozkan Reference Ozkan1987). Current application recommendations have focused on increasing spray droplet size, as it reduces downwind spray drift deposits (Alves et al. Reference Alves, Kruger, da Cunha, de Santana, LAT, Guimaraes and Zaric2017a; Bueno et al. Reference Bueno, da Cunha and de Santana2017; Vieira et al. Reference Vieira, Butts, Rodrigues, Golus, Schroeder and Kruger2018). The need to reduce drift, specifically with dicamba and glyphosate herbicides, was established as a result of the crop response that can occur on exposed susceptible crops (Alves et al. Reference Alves, Kruger, da Cunha, Vieira, Henry, Obradovic and Grujic2017b; Egan et al. Reference Egan, Barlow and Mortensen2014; Johnson et al. Reference Johnson, Roeth, Martin and Klein2006). Although increasing spray droplet size reduces particle drift potential, negative herbicide efficacy effects on target weed species have been reported (Wolf Reference Wolf2002).
Previous research demonstrated reductions in control across multiple herbicides and weed species related to increases in droplet size (Ennis and Williamson Reference Ennis and Williamson1963; Knoche Reference Knoche1994; Lake Reference Lake1977; McKinlay et al. Reference McKinlay, Brandt, Morse and Ashford1972, Reference McKinlay, Ashford and Ford1974). Reduced biological efficacy due to increased herbicide droplet sizes were exacerbated in environments with abnormally difficult-to-control weed species (Jensen et al. Reference Jensen, Jorgensen and Kirknel2001). Additionally, several systemic herbicides, including two forms of dicamba [3,6-dichloro-o-anisic acid, N,N-bis-(3-aminopropyl)methylamine and diglycolamine salts], had efficacy reductions when droplet size increased (Butts et al. Reference Butts, Samples, Franca, Dodds, Reynolds, Adams, Zollinger, Howatt, Fritz, Clint Hoffmann and Kruger2018b; Meyer et al. Reference Meyer, Norsworthy, Kruger and Barber2016a; Prasad and Cadogan Reference Prasad and Cadogan1992). Dicamba efficacy was also influenced by interactions between droplet size and sprayer speed, carrier volume, and weed species (Butts et al. Reference Butts, Samples, Franca, Dodds, Reynolds, Adams, Zollinger, Howatt, Fritz, Clint Hoffmann and Kruger2018b; Creech et al. Reference Creech, Moraes, Henry, Luck and Kruger2016; Meyer et al. Reference Meyer, Norsworthy, Kruger and Barber2016a, Reference Meyer, Norsworthy, Kruger and Barber2016b). Conversely, glyphosate had greater absorption and translocation with Coarse droplets (Feng et al. Reference Feng, Chiu, Sammons and Ryerse2009). Glyphosate efficacy on several winter annual grasses was not affected by spray droplet size; therefore, an Ultra Coarse spray classification was recommended to reduce particle drift while maintaining biological efficacy (Ferguson et al. Reference Ferguson, Chechetto, Adkins, Hewitt, Chauhan, Kruger and O’Donnell2018).
Droplet size impacts on systemic herbicide efficacy are convoluted, especially when considering herbicide mixtures such as dicamba plus glyphosate; however, site-specific weed management strategies can assist with more effectively using optimum droplet sizes (Tian et al. Reference Tian, Reid and Hummel1999; Wilkerson et al. Reference Wilkerson, Price, Bennett, Krueger, Roberson and Robinson2004). Additionally, alternative optimization efforts must be identified moving into the future of agriculture, and the development and implementation of precision agriculture techniques should be one of the primary research focal points (Westwood et al. Reference Westwood, Charudattan, Duke, Fennimore, Marrone, Slaughter, Swanton and Zollinger2018).
Pulse-width modulation (PWM) sprayers provide an alternative method to optimize pesticide applications, as they allow for factors such application pressure and spray droplet size to be maintained across a range of sprayer speeds while variably controlling flow. Flow is controlled by pulsing an electronically actuated solenoid valve placed directly upstream of the nozzle (Giles and Comino Reference Giles and Comino1989). The solenoid valves are typically pulsed on a 10-Hz frequency (10 pulses s–1), and the relative proportion of time each valve is open (duty cycle) determines the flow rate. This system allows real-time flow rate changes to be made without manipulating application pressure as in other variable-rate spray application systems (Anglund and Ayers Reference Anglund and Ayers2003), and PWM solenoid valves buffer some negative impacts observed with other rate controller systems (Luck et al. Reference Luck, Sharda, Pitla, Fulton and Shearer2011; Sharda et al. Reference Sharda, Fulton, McDonald and Brodbeck2011, Reference Sharda, Luck, Fulton, McDonald and Shearer2013). Furthermore, PWM sprayers are capable of producing up to a 10:1 turndown ratio in flow rate with no pressure- or nozzle-based changes, thus creating more flexible options for pesticide applicators (Giles et al. Reference Giles, Henderson and Funk1996; GopalaPillai et al. Reference GopalaPillai, Tian and Zheng1999). Application pressure–based variable-rate flow control devices have slow response time and affect nozzle performance—specifically droplet size (Giles and Comino Reference Giles and Comino1989). In contrast, research has shown that PWM duty cycle has little to no effect on droplet size when using non-venturi nozzles (Butts et al. Reference Butts, Butts, Luck, Fritz, Hoffmann and Kruger2019a; Giles et al. Reference Giles, Henderson and Funk1996). Additionally, when PWM sprayers were operated at or above a 40% duty cycle, minimal to no negative impacts were observed on spray pattern and coverage (Butts et al. Reference Butts, Luck, Fritz, Hoffmann and Kruger2019b; Mangus et al. Reference Mangus, Sharda, Engelhardt, Flippo, Strasser, Luck and Griffin2017; Womac et al. Reference Womac, Melnichenko, Steckel, Montgomery and Hayes2016, Reference Womac, Melnichenko, Steckel, Montgomery, Reeves and Hayes2017). Therefore, it is feasible with a PWM sprayer to sustain an optimum herbicide droplet size and spray pattern throughout an application in which efficacy could be maximized and particle drift minimized, especially within site-specific scenarios.
Dicamba-plus-glyphosate mixtures are a commonly recommended herbicide combination to combat herbicide resistance, specifically in recently commercially released dicamba-tolerant soybean [Glycine max (L.) Merr.] and cotton (Gossypium hirsutum L.). However, an antagonistic reaction between dicamba and glyphosate in a mixture was identified, as translocation of both herbicides out of the treated leaf were reduced compared to applications of either herbicide alone (Ou et al. Reference Ou, Thompson, Stahlman, Bloedow and Jugulam2018). In other research, the dicamba-plus-glyphosate mixture produced smaller droplet sizes, greater driftable fines (droplets<100 µm), and increased downwind spray drift compared to a dicamba-only spray solution (Alves et al. Reference Alves, Kruger, da Cunha, Vieira, Henry, Obradovic and Grujic2017b). Additionally, a 2016 survey from Missouri showed that further education efforts in synthetic auxin application are required to enable applicators to efficiently and accurately apply growth regulator products (Bish and Bradley Reference Bish and Bradley2017). Therefore, if the dicamba-plus-glyphosate mixture is to be recommended moving forward, specific application practices must be identified and followed to optimize the application by maximizing efficacy while simultaneously mitigating spray drift potential.
The objectives of this research were to (1) characterize the influence of spray droplet size on the efficacy of a dicamba-plus-glyphosate mixture and (2) create novel application recommendations using an optimum droplet size to mitigate particle drift potential without compromising efficacy of a dicamba-plus-glyphosate mixture. The precise, site-specific application of this herbicide mixture will allow applicators to more effectively utilize PWM sprayers and reduce the selection pressure for the evolution of herbicide-resistant weeds.
Materials and Methods
Experiment Design and Establishment
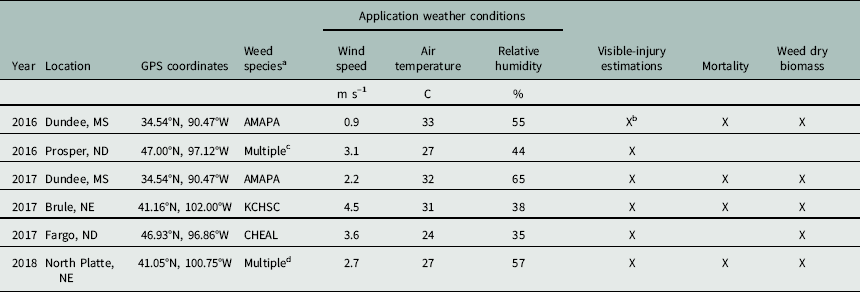
Field trials were conducted in 2016, 2017, and 2018 in a fallow environment across three states (Mississippi, Nebraska, and North Dakota) for a total of six site-years to evaluate the droplet size effect on the efficacy of dicamba plus glyphosate (Table 1). The trials were randomized complete block experimental designs replicated a minimum of three times spatially. This research was conducted using methods similar to previous droplet size research (Butts et al. Reference Butts, Samples, Franca, Dodds, Reynolds, Adams, Zollinger, Howatt, Fritz, Clint Hoffmann and Kruger2018b). Treatments consisted of six targeted droplet sizes (150, 300, 450, 600, 750, and 900 µm) determined from the Dv0.5 of the measured droplet size distribution. The Dv0.5 parameter represents the droplet diameter such that 50% of the spray volume is contained in droplets of smaller diameter. One nontreated control per site-year was used for comparison, providing a total of seven treatments. The herbicide mixture of dicamba (Clarity®, 0.48 kg ae L–1; BASF, Research Triangle Park, NC 27709) plus glyphosate (Roundup WeatherMAX®, 0.54 kg ae L–1; Monsanto Co., St. Louis, MO 63167) was applied POST to weeds at least 15 cm tall at 0.28 kg ae ha–1 dicamba plus 0.87 kg ae ha–1 glyphosate with a carrier volume of 94 L h–1. To eliminate confounding effects and permit evaluation of treatments solely on the herbicide, no additional adjuvants were tank-mixed into the solution.
Site-year, GPS coordinates, weed species, average application weather conditions, and data collected to understand the impact of droplet size on herbicide efficacy of dicamba plus glyphosate.

a AMAPA, Amaranthus palmeri S. Wats., Palmer amaranth; KCHSC, Bassia scoparia (L.) A.J. Scott, kochia; CHEAL, Chenopodium album L., common lambsquarters.
b An “X” indicates that the respective response variable data were collected from the respective site-year.
c Multiple weed species from the 2016 Prosper, ND, site-year included: CHEAL, Chenopodium album L., common lambsquarters; AMARE, Amaranthus retroflexus L., redroot pigweed; and SETPU, Setaria pumila (Poir.) Roem. & Schult., yellow foxtail.
d Multiple weed species from the 2018 North Platte, NE, site-year included: KCHSC, Bassia scoparia (L.) A.J. Scott, kochia; and ERICA, Erigeron canadensis L., horseweed.
Treatments were applied using a PinPoint® PWM research sprayer (Capstan Ag Systems, Inc., Topeka, KS 66609). The benefits of using a PWM sprayer in this research were two-fold. First, PWM allows spray output to become independent from nozzle orifice size, sprayer speed, and application pressure. Therefore, the application process was simplified and standardized for operators across a range of spray environments. Second, as previous research highlighted that PWM duty cycle had a minimal effect on droplet characteristics (Butts et al. Reference Butts, Hoffmann, Luck and Kruger2018a, Reference Butts, Butts, Luck, Fritz, Hoffmann and Kruger2019) and spray pattern (Butts et al. Reference Butts, Luck, Fritz, Hoffmann and Kruger2019b), a nozzle type, orifice size, and application pressure combination could be selected to provide a consistent droplet size treatment while maintaining the appropriate spray output (94 L ha–1) throughout an application.
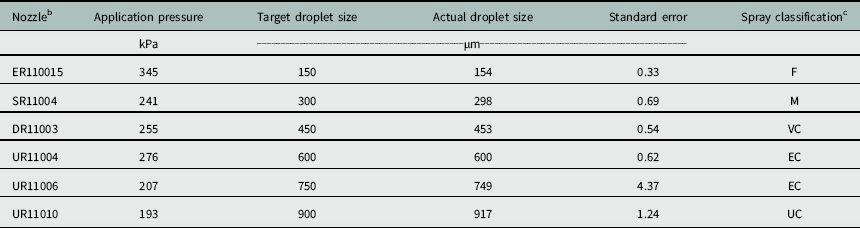
Nozzle type, orifice size, and application pressure required to create droplet size treatments were determined through droplet size measurements made using a Sympatec HELOS-VARIO/KR laser diffraction system with the R7 lens (Sympatec Inc., Clausthal, Germany) in the low-speed wind tunnel at the Pesticide Application Technology Laboratory in North Platte, NE (Table 2). Creech et al. (Reference Creech, Henry, Fritz and Kruger2015) and Henry et al. (Reference Henry, Kruger, Fritz, Hoffmann and Bagley2014) provide in-depth details regarding the low-speed wind tunnel at the Pesticide Application Technology Laboratory, and Butts et al. (Reference Butts, Butts, Luck, Fritz, Hoffmann and Kruger2019a) provides an illustration for further clarification of wind tunnel construction and operation. Only non-venturi nozzles (Wilger Industries, Ltd., Lexington, TN 38351) were used in this research, for two reasons: (1) Only non-venturi nozzles are recommended for use on PWM systems (Butts et al. Reference Butts, Butts, Luck, Fritz, Hoffmann and Kruger2019a; Capstan Ag Systems Inc. 2013), and (2) nozzle designs were kept similar (flat-fan, non-venturi, straight flow path) to eliminate confounding spray characteristic factors. Spray classifications were assigned in accordance with ASABE S572.1 (ASABE 2009).
Nozzle type, orifice size, and application pressure combinations for each dicamba-plus-glyphosate droplet size (Dv0.5) treatment. a

a Target droplet sizes were the designed droplet size treatments used in data analysis. Actual droplet sizes were the experimentally measured droplet sizes from spray solution, nozzle, and application pressure combinations. Actual droplet sizes were within 2.7% of the target droplet sizes.
b Flat fan, non-venturi nozzles; Wilger Industries Ltd., Lexington, TN 38351, USA.
c Spray classifications determined using ASABE S572.1, where F=Fine, M=Medium, VC=Very Coarse, EC=Extremely Coarse, and UC=Ultra Coarse.
Data Collection
Each collaborating university collected data from their respective sites. Visible-injury estimation proportions were recorded approximately 28 d after treatment for entire plots. At the time of application, 10 individual weeds per plot were marked. At 28 d after treatment, marked plants were individually evaluated for mortality (alive or dead), and the total number of dead plants was divided by 10 to provide mortality proportion measurements for each plot. The individual weeds were then clipped at the soil surface, harvested, and dried at 55 C to constant mass. The dry plants were pooled into one dry biomass measurement per plot, and the result was then divided by 10 for average weed dry-shoot biomass per plant measurements.
Statistical Analyses
Generalized additive modeling (GAM) analysis was conducted in R 3.5.0 statistical software using the mgcv package to model spray droplet size with each respective response variable to provide an estimate of the optimum spray droplet size for weed control (Crawley Reference Crawley2013). To meet model assumptions, visible-injury estimation and mortality proportions were analyzed using a beta distribution as the data were bound between 0 and 1, and weed dry-biomass per plant data were subjected to a natural log transformation. Back-transformed data are presented for clarity. Models consisted of one smoothed variable (droplet size) (Equation 1).
 $${\rm Response}\,{\rm variable}\,\sim\,{\rm s}\left( {{\rm Target}\,{\rm droplet}\,{\rm size}} \right)$$
Data were pooled across site-years to provide overall droplet size recommendations; however, GAM analysis was also conducted for data on individual site-years to assess droplet size efficacy implications in a site-specific weed management scenario. Models were used to predict the droplet size for maximum weed control, and the droplet size at which 90% of maximum weed control was attained for drift mitigation recommendations.
Results and Discussion
Individual site-year information, including GPS coordinates, weed species, weather conditions at the time of application, and data collected are presented in Table 1. Visible-injury estimation, weed mortality, and weed dry-biomass per plant data were collected from six, four, and five site-years, respectively. Additionally, droplet sizes discussed throughout the Results and Discussion refer to the Dv0.5 measurement (average droplet size) of the droplet size distribution.
Pooled Site-Years
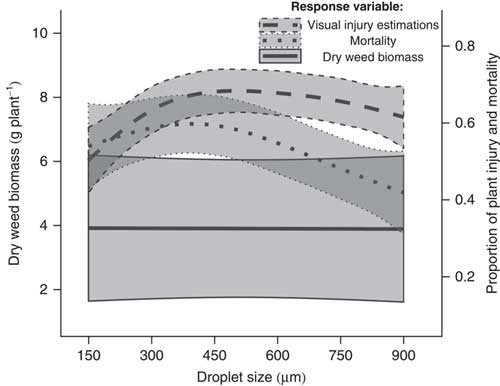
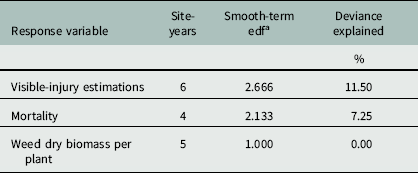
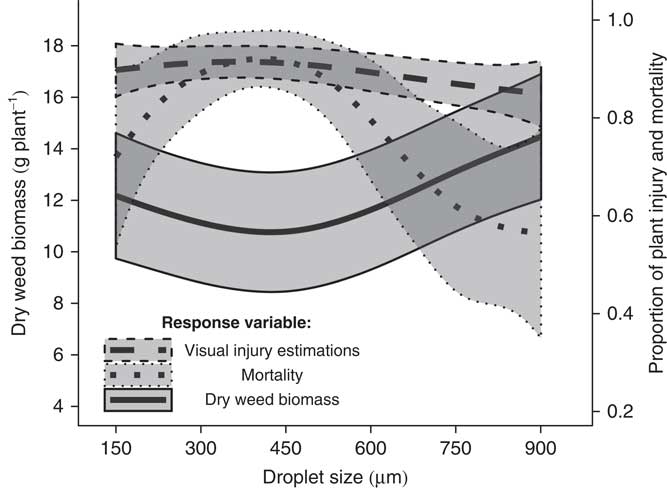
The GAM models for visible-injury estimation proportion, mortality proportion, and dry-weed biomass per plant response variables across pooled site-years are presented in Figure 1. The model smooth-term estimated degrees of freedom (edf) and deviance explained for each response variable are presented in Table 3. A smooth-term edf of 1.000 is equal to a linear model with model fluctuation increasing as the smooth-term edf increases. The explained deviance provides an estimate of the discrepancy between model predicted estimates and actual observations, with a larger percentage indicating a smaller discrepancy and overall better model fit.
Visible-injury estimation proportion, mortality proportion, and weed dry biomass per plant 28 d after treatment as affected by droplet size were pooled across six, four, and five site-years, respectively, and predicted using generalized additive models (GAM). The gray-shaded area indicates the 95% confidence limits.

Generalized additive model (GAM) smoothing parameters and deviance explained for each response variable across pooled site-years.

a Smooth-term estimated degrees of freedom (edf) provides an estimate of the model fluctuation. A smooth-term edf of 1.000=linear model.
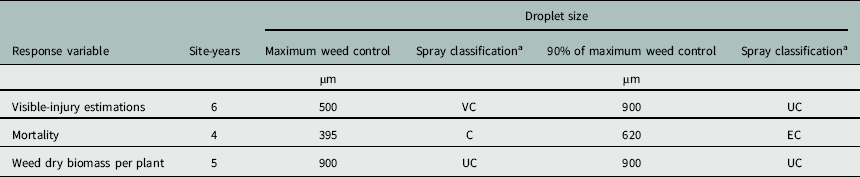
Pooled site-years GAM models for visible-injury estimation and mortality response variables had smooth-term edf values > 1.000, indicating models were more complex (more fluctuation) than a linear regression (Table 3) (Figure 1). Conversely, the weed dry-biomass per plant response variable GAM model was linear (smooth-term edf=1.000), but droplet size was not a good predictor of weed dry biomass per plant, as the explained deviance was 0%. The average deviance explained of the GAM models across response variables was 6.25%, meaning that<7% of the model variation could be explained by droplet size. The droplet size that maximized weed control ranged from 395 to 900 µm (Coarse to Ultra Coarse), depending on the response variable (Table 4). However, for visible injury estimations and weed dry-biomass per plant response variables, the model slope was relatively flat as droplet size increased, and 90% of the maximum weed control could still be achieved with a droplet size of 900 µm (Ultra Coarse). A more severe droplet size penalty was observed for the weed mortality response variable, as 90% of weed control could only be maintained with a 620-µm (Extremely Coarse) droplet size. Therefore, to achieve complete plant death and reduce additional weed seeds from replenishing the seedbank, a 620-µm (Extremely Coarse) droplet size would be recommended across site-years to maintain 90% of the maximum weed control while reducing particle drift potential.
Predicted droplet sizes based on a generalized additive model (GAM) to achieve maximum weed control and 90% of maximum weed control to enhance drift mitigation efforts for each response variable across pooled site-years.

a Spray classifications determined using ASABE S572.1, where C=Coarse, VC=Very Coarse, EC=Extremely Coarse, and UC=Ultra Coarse.
The differences observed in predicted droplet sizes for maximum weed control across response variables could be attributed to the method in which visible-injury estimations are made, especially with dicamba, and the lack of correlation between weed biomass and plant death (Norsworthy et al. Reference Norsworthy, Korres and Bagavathiannan2018). The weed species present across the Mississippi (Palmer amaranth, Amaranthus palmeri S. Wats.) and Nebraska [kochia, Bassia scoparia (L.) A.J. Scott] site-years were glyphosate-resistant (data not shown); therefore, dicamba provided the only effective herbicide site of action within these applications. When visibly assessing plots for dicamba injury, it was not uncommon to see similar plant damage and biomass accumulation across a range of droplet sizes. However, upon closer inspection of mortality, the plants sprayed with greater droplet sizes were often still alive, leading to decreased weed control as droplet size increased. This research supports the conclusion that care should be taken in future herbicide research, especially with dicamba, to determine weed mortality as opposed to strictly observing visible-injury symptoms or weed biomass to fully evaluate herbicide effectiveness (Norsworthy et al. Reference Norsworthy, Korres and Bagavathiannan2018).
The reduction in efficacy for dicamba-plus-glyphosate mixtures across droplet size treatments when evaluated using weed mortality may be attributed to an antagonism between the two herbicides. Previous research in kochia showed that when dicamba plus glyphosate were tank-mixed, translocation of both herbicides out of the treated leaf was reduced compared to applications of either herbicide alone (Ou et al. Reference Ou, Thompson, Stahlman, Bloedow and Jugulam2018). Therefore, if dicamba-plus-glyphosate mixtures continue to be recommended in areas in which herbicide resistance is a primary concern, applications should be optimized, including using a droplet size between 395 and 620 µm (Coarse to Extremely Coarse) when applied at 94 L ha–1, to limit the negative consequences of the antagonistic reaction. Future research should investigate the influence of carrier volume on a dicamba-plus-glyphosate mixture, as increasing spray carrier volume may buffer the impact of increasing droplet size on the resulting biological efficacy (Butts et al. Reference Butts, Samples, Franca, Dodds, Reynolds, Adams, Zollinger, Howatt, Fritz, Clint Hoffmann and Kruger2018b).
Although this research was conducted in a fallow environment, similar results could be expected within a cropping-system scenario, as previous research demonstrated similar spray coverage at the bottom of a soybean canopy across a range of droplet sizes (Legleiter and Johnson Reference Legleiter and Johnson2016). Therefore, the droplet size effect on dicamba-plus-glyphosate mixture efficacy observed in this research must be due to variables other than spray coverage, such as droplet impaction efficiency, retention, absorption, and translocation.
Site-Specific Weed Management
Prior to field trial establishment, it was hypothesized that identifying and applying an optimum herbicide droplet size would be more appropriate as a site-specific management strategy. Additionally, previous research highlighted the potential need for a site-specific weed management approach if an optimum droplet size is to be utilized, as different weed species each had a unique response to applications of dicamba and glyphosate made with differing nozzle types (Meyer et al. Reference Meyer, Norsworthy, Kruger and Barber2015). Therefore, each respective site-year was analyzed separately to determine if the deviance explained for each GAM model could be improved and optimum droplet size predictions made more robust.
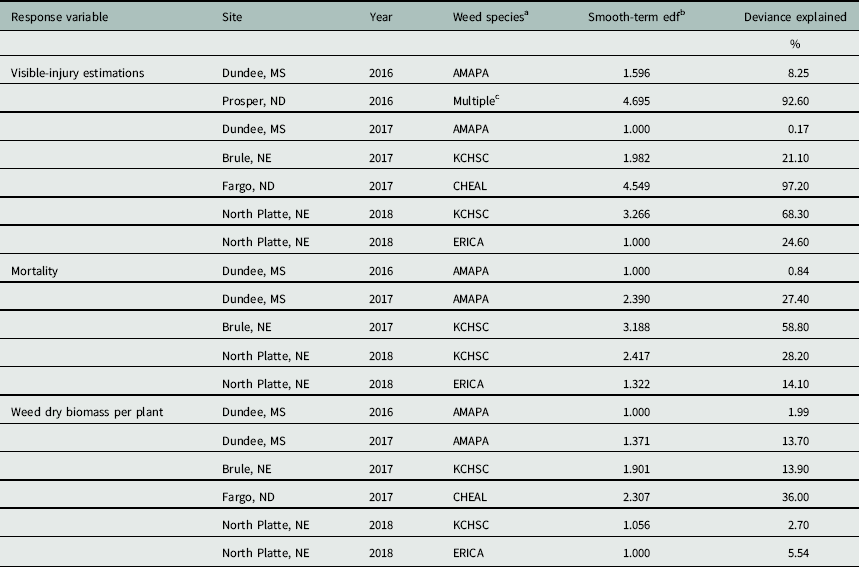
The GAM model smooth-term edf values and deviance explained for each respective site-year and response variable are presented in Table 5. The complexity of individual site-year models varied from a linear relationship (smooth-term edf=1.000) to very complex, high-fluctuation relationships (smooth-term edf=4.695). Additionally, the average deviance explained for individual site-year models across response variables was 28.63%, indicating that more than a quarter of the model variability could be explained from the droplet size treatment. This is a marked improvement (four-fold) compared to the pooled site-year model average deviance explained (approximately 7%); therefore, optimizing dicamba-plus-glyphosate mixture applications with a specific droplet size should be implemented using a site-specific approach.
Generalized additive model (GAM) smoothing parameters and deviance explained within individual site-years for each response variable to investigate the plausibility of site-specific weed management.

a AMAPA, Amaranthus palmeri S. Wats., Palmer amaranth; KCHSC, Bassia scoparia (L.) A.J. Scott, kochia; CHEAL, Chenopodium album L., common lambsquarters; ERICA, Erigeron canadensis L., horseweed.
b Smooth-term estimated degrees of freedom (edf) provides an estimate of the model fluctuation. A smooth-term edf of 1.000=linear model.
c Multiple weed species from the 2016 Prosper, ND, site-year included: CHEAL, Chenopodium album L., common lambsquarters; AMARE, Amaranthus retroflexus L., redroot pigweed; and SETPU, Setaria pumila (Poir.) Roem. & Schult., yellow foxtail.
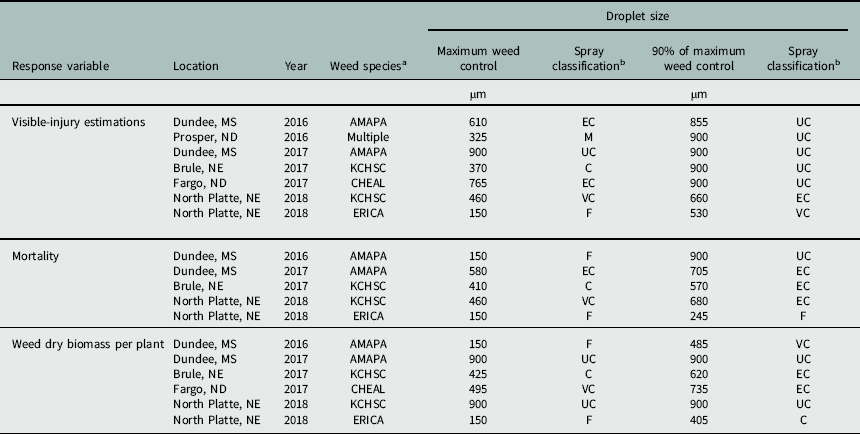
An example of the site-specific GAM model approach, the 2017 Brule, NE, site-year, is presented in Figure 2. Similar to the pooled site-year analysis, a severe reduction in weed mortality was observed as droplet size increased past a critical point, whereas visible-injury estimations had a relatively flat slope, resulting in a minimal droplet size impact. Optimum droplet size predictions for each site-year and response variable are presented in Table 6. Droplet size predictions to maximize weed control varied widely across site-years and response variables from 150 µm (Fine) to 900 µm (Ultra Coarse). However, in general across individual site-years and response variables, an Extremely Coarse (570 µm) to Ultra Coarse (900 µm) spray classification maintained 90% of maximum weed control and would assist with particle drift mitigation efforts.
Visible-injury estimation proportion, mortality proportion, and weed dry biomass per plant generalized additive models (GAM) for the 2017 Brule, NE, site-year to assess the plausibility of site-specific weed management strategies. The gray-shaded area indicates the 95% confidence limits.

Predicted droplet sizes based on a generalized additive model (GAM) to achieve maximum weed control and 90% of maximum weed control to enhance drift mitigation efforts within individual site-years for each response variable to investigate the plausibility of site-specific weed management.

a AMAPA, Amaranthus palmeri S. Wats., Palmer amaranth; KCHSC, Bassia scoparia (L.) A.J. Scott, kochia; CHEAL, Chenopodium album L., common lambsquarters; ERICA, Erigeron canadensis L., horseweed.
b Spray classifications determined using ASABE S572.1, where F=Fine, M=Medium, C=Coarse, VC=Very Coarse, EC=Extremely Coarse, and UC=Ultra Coarse.
c Multiple weed species from the 2016 Prosper, ND, site-year included: CHEAL, Chenopodium album L., common lambsquarters; AMARE, Amaranthus retroflexus L., redroot pigweed; and SETPU, Setaria pumila (Poir.) Roem. & Schult., yellow foxtail.
The wide array of predicted optimum droplet sizes across site-years is probably due to convoluted droplet size interactions and diverse weed structures influencing droplet retention on varied leaf surfaces. Previous research demonstrated greater impaction and retention efficiency on vertical leaf surfaces with finer droplets in the presence of horizontal winds (Lake Reference Lake1977); however, coarser droplets had greater impaction efficiency on horizontal leaf surfaces (Spillman Reference Spillman1984). Unfortunately, droplet adhesion was reduced with increasing droplet size, as droplets bounced or shattered upon impact (Forster et al. Reference Forster, Kimberley and Zabkiewicz2005). Therefore, a complex interaction between droplet size, plant architecture, and leaf structure influences droplet retention and thereby herbicidal efficacy (Massinon et al. Reference Massinon, De Cock, Forster, Nairn, McCue, Zabkiewicz and Lebeau2017; Nairn et al. Reference Nairn, Forster and van Leeuwen2013).
The primary weed species in Mississippi and North Dakota were Palmer amaranth and common lambsquarters (Chenopodium album L.), respectively. That both Palmer amaranth and common lambsquarters have flat, horizontal leaf surfaces helps to explain the coarser optimum droplet size of 900 µm corroborating findings from Spillman (Reference Spillman1984). Conversely, the primary weed species in Nebraska were kochia and horseweed (Erigeron canadensis L.), which have a much smaller and narrower leaf structure paired with relatively vertical plant architecture, compared to Palmer amaranth and common lambsquarters. Therefore, smaller droplet sizes were required to achieve 90% of maximum weed control across measured response variables for the Nebraska site-years compared to the Mississippi and North Dakota site-years, validating Lake’s (Reference Lake1977) findings.
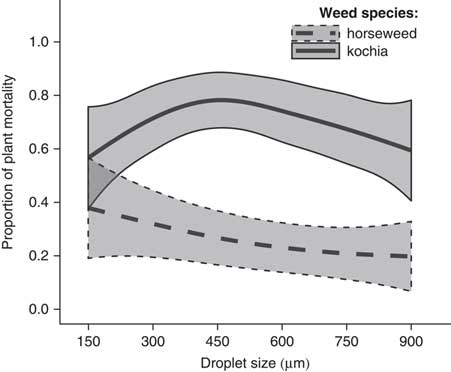
Additional differences in optimum droplet sizes were observed between the kochia and horseweed populations within the 2018 North Platte, NE, site-year, further supporting the conclusion that optimum herbicide droplet sizes differ among weed species (Figure 3). Overall, the dicamba-plus-glyphosate mixture provided less control of horseweed and required smaller droplet sizes to maintain 90% of maximum weed control compared to kochia. This difference in weed control can be attributed to weed height and density, as horseweed tended to be taller and denser than kochia within the respective site-year (data not shown).
Mortality proportion generalized additive models (GAM) for the horseweed (Erigeron canadensis L.) and kochia [Bassia scoparia (L.) A.J. Scott] weed species from the 2018 North Platte, NE, site-year. The gray-shaded area indicates the 95% confidence limits.

The results of the site-specific analysis corroborated previous research in which it was recommended that each herbicide and weed species interaction required a tailored, site-specific approach to maximize efficacy (Butts et al. Reference Butts, Samples, Franca, Dodds, Reynolds, Adams, Zollinger, Howatt, Fritz, Clint Hoffmann and Kruger2018b; Creech et al. Reference Creech, Moraes, Henry, Luck and Kruger2016; Meyer et al. Reference Meyer, Norsworthy, Kruger and Barber2015). Future research should holistically investigate the influence of weather conditions, weed species, geographic location, herbicide antagonism, and herbicide resistance paired with droplet size to create more robust models and fully optimize spray applications. Additionally, as previously stated, future research should investigate the role of carrier volume as it relates to the efficacy of a dicamba-plus-glyphosate mixture across a range of droplet sizes. A greater volume of spray solution would provide more droplets for potential impaction on the weed leaf surface, thereby potentially increasing herbicide efficacy; however, previous research has highlighted the variable effects of carrier volume on efficacy (Butts et al. Reference Butts, Samples, Franca, Dodds, Reynolds, Adams, Zollinger, Howatt, Fritz, Clint Hoffmann and Kruger2018b).
This research identified across a broad geographic setting and diverse weed spectrum that mixture applications of dicamba plus glyphosate should utilize a 620-µm (Extremely Coarse) droplet size when applying with a carrier volume of 94 L ha–1, as weed mortality would be maintained, the addition of weed seeds to the soil seedbank would be reduced, and particle drift potential would be simultaneously mitigated. However, more precise applications could be achieved by applying the optimum herbicide droplet sizes in a site-specific approach. Approximately 25% of the model variability could be explained from the droplet size treatment when analyzed using the site-specific approach as opposed to<10% when analyzed in a pooled site-year analysis. Generally, 90% of maximum weed control across individual site-years was achieved, with droplet sizes ranging from 570 µm (Extremely Coarse) to 900 µm (Ultra Coarse). These differences in optimum droplet sizes across individual site-years were probably due to weed species plant structure and leaf architecture; however, numerous other factors such as weather conditions at application, geographic location, herbicide antagonism, and herbicide resistance played a significant role in final herbicidal efficacy (Kudsk Reference Kudsk2017). Finally, to effectively reduce particle drift potential from future herbicide applications, researchers must identify and implement alternative drift reduction strategies other than increasing spray droplet size to avoid weed control losses and mitigate the evolution of herbicide-resistant weeds.
Acknowledgments
This project was partially supported by the Nebraska Agricultural Experiment Station with funding from the Hatch Multistate Research capacity funding program from the USDA National Institute of Food and Agriculture. The authors would like to thank all of the undergraduate and graduate research assistants across universities who helped with the implementation and data collection for this research. The authors would further like to thank Brian Finstrom and Capstan Ag Systems, Inc., for supplying and assisting with maintenance of the PWM equipment. Finally, the authors would like to thank Wilger Industries Ltd. for supplying nozzles and other sprayer components used in this research. No conflicts of interest have been declared.