INTRODUCTION
Seedling emergence is probably the single most important phenological event influencing the success of annual plants (Forcella et al. Reference Forcella, Benech-Arnold, Sánchez and Ghersa2000). Generally, due to the asymmetry of emergence with time, the first cohorts of seedlings contribute more to stand biomass and subsequent seed production (Fernández-Quintanilla et al. Reference Fernández-Quintanilla, Navarrete, González-Andújar, Fernández and Sánchez1986), having the largest contribution to the next generation and stronger competition with the crop. The ability to predict weed emergence could enhance crop management by facilitating the implementation of more effective weed control strategies through the optimization of the timing of weed control (Leblanc et al. Reference Leblanc, Cloutier, Stewart and Hamel2003; Izquierdo et al. Reference Izquierdo, González-Andújar, Bastida, Lezaun and Sánchez del Arco2009).
Seedling emergence is controlled by several factors, including temperature, water potential, burial depth and soil. However, it seems that temperature and water potential are the major factors (Forcella et al. Reference Forcella, Benech-Arnold, Sánchez and Ghersa2000). Previous research has demonstrated that emergence of several weed species can be predicted using indices (Naylor Reference Naylor1981; Hunter et al. Reference Hunter, Glasbey and Naylor1984) or modelling techniques (Colbach et al. Reference Colbach, Dürr, Roger-Estrade and Caneill2005). Researchers have used both mechanistic and empirical approaches to predict weed seedling emergence. However, Grundy (Reference Grundy2003) concludes that, although the benefits of an improved mechanistic understanding of weed emergence are undeniable, empirical models may offer the simplicity and flexibility required for practical decision support. Empirical emergence models can give valuable information about the beginning and extent of weed seedling emergence periods after sowing. Seedling emergence models can be classified in thermal time (TT) models, if they use soil temperature above a base temperature to describe emergence, and hydrothermal time (HTT) models, if they combine TT and hydro time above a base water potential. Detailed descriptions of these models can be found elsewhere (Forcella et al. Reference Forcella, Benech-Arnold, Sánchez and Ghersa2000; Bradford Reference Bradford2002; Grundy Reference Grundy2003).
HTT models have frequently proved better at predicting emergence than TT models (Leguizamón et al. Reference Leguizamón, Fernández-Quintanilla, Barroso and González-Andújar2005; McGiffen et al. Reference McGiffen, Spokas, Forcella, Archer, Poppe and Figueroa2008). However, they may be more suitable for situations with little tillage and low seed dormancy, where the seeds remain close to soil surface and emerge as soon as the environmental conditions become favourable.
Classical parametric models, such as Gompertz and logistic, have been used widely to define the relationship between HTT and weed emergence (Dorado et al. Reference Dorado, Sousa, Calha, González-Andújar and Fernández-Quintanilla2009; Haj Seyed Hadi & González-Andújar Reference Haj Seyed Hadi and González-Andújar2009). Nevertheless, there exists an important practical problem in calculating the HTT. Since the models used to describe weed emergence depend on the HTT in soil, what is the best depth to measure temperature and water potential in order to calculate it? There is not a universal answer, although simplistically, it should be ‘at the position of the individual seed(s)’. For instance, Royo-Esnal et al. (Reference Royo-Esnal, Torra, Conesa, Forcella and Recasens2010) indicate that the HTT was estimated in the 0–50 mm soil layer, without being more specific. The difference in HTT between soil layers may be huge. Since HTT is often measured at different soil depths, a natural question is to define an index that reflects which of these depths is the best to improve weed emergence prediction.
It is worth mentioning that emergence has a dichotomous nature: a seed can only germinate or not germinate, but it cannot ‘half germinate’. In that sense, the number of emerged seedlings is a realization of a binomial distribution. Most of the models used in this context work conditionally on seeds emerged during the experimental study, circumventing this binomial structure.
It is important to point out that most of the statistical methods used in this context tackle the problem from a parametric regression point of view. Under the parametric regression approach, cumulative emergence is viewed as a response variable in a parametric regression model (Gompertz or logistic, for instance) where cumulative hydrothermal time (CHTT) is regarded as the explanatory variable. The parametric regression view for weed emergence has several problems. First of all, parametric models are sometimes not flexible enough to capture complex features in the HTT distribution, such as abrupt jumps or heavy tails. From a regression perspective, observed cumulative emergence values at consecutive monitoring CHTTs are not statistically independent. However, this is not explicitly considered in the weed science literature, just fitting the model as if the data were independent. Since cumulative emergence is a non-decreasing function with values between 0 and 1, it is more natural to think of it as a distribution function (rather than a regression function). In particular, for a regression model to be at least a reasonable fit to model emergence, one has to take care that the response function in the model always gives values between 0 and 1. Finally, if there were no limitations due to monitoring, one would be able to observe the exact value of CHTT at the emergence of every seedling. In such a case, it would be more natural to formulate the statistical problem in terms of the distribution (cumulative emergence) of just one random variable (CHTT) rather than using a regression approach, involving an explanatory variable (CHTT) and a response variable (cumulative emergence).
In the present paper, a cumulative distribution (or equivalently, probability density) view is adopted. This consists of focusing on the HTT cumulative distribution function (cdf), F(t), which is the probability that a seedling emerges at an HTT less than or equal to t, where t is any possible hydrothermal value within a reasonable interval. The shape of the distribution or alternatively, its derivative, f(t)=F′(t), the density, may be used to obtain some indices (coefficient of variation, kurtosis, curvature, etc.) to assess how useful this distribution is for weed emergence purposes. For instance, it is clear that the flatter the distribution, the better its predictive value.
A classical statistical tool for estimating F(t) without any parametric assumption is the empirical cdf. For a given t, the empirical cdf is just the proportion of observed seedlings that have emerged before HTT t. To calculate the empirical cdf at any t, the whole set of HTTs at the emergence of all seedlings is needed. However, in practice all these times cannot be observed exactly. Due to the monitoring process, F(t) can only be observed at a very limited number of values for t. So, in this sense, HTTs cannot be observed for every single seedling, but in an aggregated way. In other words, the set of HTTs is an incomplete data set (grouped data). This forces us to adapt the existing statistical tools for use with grouped data in order to estimate the values of interest (coefficient of variation, kurtosis and probability density functions).
The present work develops new statistical methods that allow establishment of the best depth to measure soil variables to compute HTT using a probability density view. Two indices based on the coefficient of variation and the kurtosis of observed HTTs are proposed with this aim in mind. To solve some of the problems of these two indices, two new ones are defined. These are based on integrals of the square of density derivatives and are designed to capture the flatness of the HTT probability density function or equivalently, the spread of the HTT distribution.
MATERIALS AND METHODS
Monitoring plants and HTT
As a working example, an unpublished data set of ripgut brome (Bromus diandrus Roth) was taken from an experiment carried out during winter–spring 2005/06 in Gibraleon (37°22′N, 6°54′W; 26 m asl) and 2006/07 in Palos de La Frontera (37°12′N, 6°48′W; 30 m asl); both locations are situated in the province of Huelva (Andalucia, southern Spain).
Briefly, the experiment consisted of four polyvinylchloride cylinders (diameter 250 mm, height 50 mm) placed 1 m apart. For each sample, 200 seeds of B. diandrus were mixed thoroughly with the soil and distributed throughout the 0–50 mm layer. Numbers of emerged weed seedlings were recorded once or twice a week and then removed by cutting seedling stems at ground level with minimum disturbance of the substrate. All the data for the cumulative numbers of seedling emergence from the field were converted to n/m2.
Daily rainfall and maximum and minimum air temperatures were obtained from a meteorology station in Kronos, Quimisur S.L., Seville, Spain, located c. 50 m from the study field. This information was used as an input into the STM2 model (Spokas & Forcella Reference Spokas and Forcella2009) to simulate water potential and soil temperatures at 10 and 50 mm.
In this example, only a superficial layer (10 mm) and a deep layer (50 mm) were considered as representatives of the gradient of emergence of B. diandrus. Following Schutte et al. (Reference Schutte, Regnier, Harrison, Schmoll, Spokas and Forcella2008), soil temperature and water potentials were used to calculate HTT for day t, θ HT(t), at the two depths, by means of the following equation:

where θ H(t)=1{ψ(t)⩾ψ(b)}, with 1{×} the indicator function. Therefore, θ H(t)=1 when the actual water potential at day t, ψ(t), is larger than or equal to the base water potential for seedling germination, ψ b, otherwise θ H(t)=0, and

T(t) being the daily average soil temperature at day t and T b the base temperature for seedling germination. CHTT starting at crop sowing up to day s is defined as follows:

For B. diandrus, 0·91°C is the base temperature (T b) considered and −1·50 MPa is the base water potential (ψ b) (M. J. Sánchez del Arco, personal communication).
Data-generating process
For a fixed soil depth (10 or 50 mm) and a particular cylinder of a plot, n denotes the number of seedlings that have emerged at the end of the monitoring process. Ideally, one would like to know the CHTT, ΘCHT (s i), for i=1, 2, … , n, where s i is the exact instant of emergence of the ith seedling. These CHTTs at emergence, ΘCHT(s 1), ΘCHT(s 2), … , ΘCHT(s n), are abbreviated as X 1, X 2, … , X n. Although CHTT, X, can be modelled by a random variable with a continuous and a discrete part (due to the base temperature and the base water potential), for practical purposes it will be approximated by a continuous random variable. Since the inspections in the monitoring process are performed at a limited number of instants, the value ΘCHT(s) can only be observed at a limited number of values for s. Consequently, the values X 1, X 2, … , X n are not observable with precision (incomplete data). However, what is observed is the total number of seedlings that have emerged before every inspection. The number of inspection times (excluding the initial instant) is denoted by k and the inspection instants by t 1, t 2, … , t k; the cumulative observed HTTs at inspections become ΘCHT(t 1), ΘCHT(t 2), … , ΘCHT(t k). For the sake of brevity, these cumulative observed HTT at inspections will be denoted by y 0⩽y 1⩽···⩽y k (y 0 is the initial HTT at the beginning of the monitoring process, typically equal to zero). Seedling emergence is observed via the cumulative proportion of these X i that are smaller or equal to the CHTT, y j, recorded at the jth inspection day. This proportion will be denoted by

which is the well-known empirical cdf at the collection of observed CHTT at inspections. In this sense, seedling emergence can only be observed in an aggregate way (grouped data), i.e. by recording the number of emerged seedlings between two consecutive monitoring instants.
Although the previous paragraph describes the usual practice when monitoring seedling emergence, the statistical analysis of the observed HTT at inspection as grouped or incomplete data is new in the weed science literature. However, these statistical tools were developed in other contexts several decades ago. In fact, the data used in the present paper can be considered as a kind of interval-censored data, defined, in general, when the event of interest cannot be observed and it is only known to have occurred within a time interval. Pioneer papers considering interval-censored data were Peto (Reference Peto1973) and Turnbull (Reference Turnbull1976). Since then, many papers have been published considering interval-censored data, in such diverse areas as medicine, biology, computer science, environmental science, etc. Two examples of reviews on this topic are Lesaffre et al. (Reference Lesaffre, Komárek and Declerck2005) and Sun (Reference Sun2006). Recently, Onofri et al. (Reference Onofri, Gresta and Tei2010) applied censored data techniques to analyse weed emergence. Ritz et al. (Reference Ritz, Pipper, Yndgaard, Fredlund and Steinrücken2010) also used interval censored data to model the propensity of plants to flower.
Emergence indices
The knowledge of the relationship between seedling emergence time and the prevailing environmental conditions is useful for weed emergence prediction.The main idea is to define an index that reflects which of the soil depths is the best to improve weed emergence prediction. Any plausible index should measure the spread of the probability distribution of CHTT at emergence. The more spread the distribution, the better for weed emergence prediction purposes.
Reasonable indices for measuring the relative dispersion or the shape of the HTT distribution include those based on moments. Considering the random variable X, which measures CHTT at emergence, the coefficient of variation and the kurtosis are two first attempts to measure the spread of the distribution of emergence time:

where CV is the coefficient of variation and Kur is the kurtosis coefficient, which are defined in terms of the mean μ=E(X), the variance, σ 2=Var(X) and the fourth central moment m 4=E[(X−μ)4]. Both indices are invariant under scale transformation. This is an important property that makes these indices stable with respect to changes in units of measure for time or temperature. Moreover, I 2 is also a shifting invariant (i.e. I 2 does not change when adding a constant to the CHTTs), while I 1 is not. The shifting invariance property is also important, for instance, when changing the starting day for measuring CHTT, since two different starting days lead to two series of CHTTs that differ only by adding a constant value. Given the meaning of coefficient of variation and kurtosis, large values for I 1 and small values for I 2 indicate good weed emergence prediction properties for CHTT (see Ruppert (Reference Ruppert1987) for a deep insight of the concept of kurtosis).
Emergence indices can also be defined based on the probability density function, f, of the CHTT at emergence, X. Intuitively, this density reflects how probable it is to find CHTTs along all possible values. The flatter the density, the more spread the distribution of CHTT and, consequently, the better the index for weed emergence prediction purposes. The slope of the density, f, can be measured via its first derivative, f′, while its second derivative, f″, is useful for measuring the density curvature. These two functions are then squared to avoid compensation of a curve that is partially increasing and partially decreasing or partially convex and partially concave. Finally, the square of these functions is integrated out along all possible values of CHTT at weed emergence. The following two indices are just some standardized versions of these integrals, which are multiplied by two different powers of the standard deviation just for invariance convenience:


It is easy to check that these two indices are also invariant under shifting and scale transformations. Small values of J 1 and J 2 provide good opportunities to improve weed emergence prediction. In other words, J 1 and J 2 try to quantify the smoothness of f. Consequently, small values of these indices are preferable in the current instance.
Index estimation
If the exact value of CHTT at emergence could be observed for every seedling, the indices I 1 and I 2 could be estimated using their empirical analogues, i.e. by computing the sample mean, the sample variance and the sample fourth moment with the exact CHTTs for all seedlings. However, these data are not available, since we only know the proportion of seedling emergence between consecutive CHTTs. This incompleteness of the data, forces us to obtain grouped-data versions of the empirical estimates.
The observed CHTT values are denoted as y 0⩽y 1⩽···⩽y k, and their pertaining seed emergence proportions as F n(y 0)⩽F n(y 1)⩽···⩽F n(y k). The grouped-data estimators of the coefficient of variation and the kurtosis indices are as follows:

where

w i=F n(y i)−F n(y i−1) and t i=(y i−1+y i)/2, for i=1, 2, … , k. These estimators are just the grouped-data versions of the sample mean, variance and fourth central moment. To compute them, the central values, t i, between every pair of consecutive HTTs are calculated and the proportions of emergence, w i, in every interval are used.
In order to estimate the indices J 1 and J 2, one needs first to estimate the underlying density function, f, of the CHTT at emergence. If the exact values, X 1, … , X n, of CHTT at emergence were observed, then the well-known Parzen–Rosenblatt kernel density estimator (see Wand & Jones Reference Wand and Jones1995) could be used for this purpose:

where K is a kernel function (typically a density function chosen by the user, such as the normal density function) and h is the bandwidth or smoothing parameter that regulates the amount of smoothing to be used. Although the choice of the kernel function is of secondary importance, the smoothing parameter plays a crucial role in kernel density estimation. The idea of kernel density estimation is very close to that of a histogram. The kernel method simply generalizes the definition of a histogram in order to make it smooth (the histogram is a step function) and also independent of any arbitrary choice of the intervals endpoints. The smoothness is achieved by using a kernel function.
In practice, these HTTs at emergence, X i, cannot be observed for every individual seedling. For that reason, the Parzen–Rosenblatt kernel density estimator has to be adapted to a grouped-data set-up:

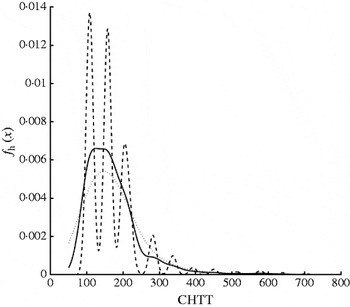
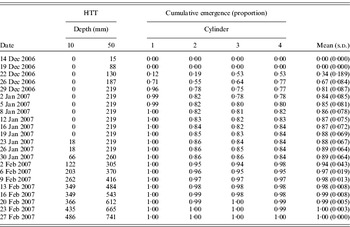
where, as above, t i and w i are the central points and the proportions of emergence for every interval of consecutive HTTs. Figure 1 shows the kernel density estimates for CHTT at emergence, computed with Eqn (4), using several smoothing parameters and a Gaussian kernel. The CHTTs used to obtain these estimates are those collected in Table 1 (see Results section) for the depth of 50 mm. The importance of the bandwidth choice is evident from this figure.
Kernel density estimation for CHTT at emergence using several smoothing parameters (h=10 ----, h=25 — and h=50 ····) and a Gaussian kernel, for location 1 at soil depth 50 mm.

Seedling emergence data of B. diandrus for Location 1

Plugging  and Eqn (4) into the definition of J 1 and J 2, estimators of these indices are easily obtained:


where


K″ is the second derivative of the kernel function, K, and K (4) is its fourth derivative. An alternative way to define Eqns (7) and (8) consists of adapting those proposed by Jones & Sheather (Reference Jones and Sheather1991) in a complete data set-up to the present grouped-data context.
To deal with the problem of bandwidth selection in this grouped-data setup, a bootstrap method is proposed. The algorithm for smoothing parameter selection is included in Appendix 1 at the end of the present paper.
RESULTS
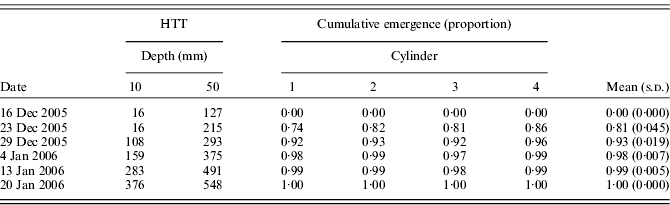
In this section, the analysis of B. diandrus emergence is presented. As previously indicated, field experiments were conducted in two locations. The observed emergence data for locations 1 and 2 are collected in Tables 1 and 2. As it can be seen in these tables, the CHTT at emergence can not be observed for every individual seed, but just in an aggregated way.
Seedling emergence data of B. diandrus for location 2
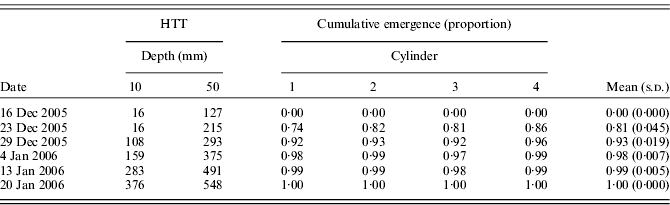
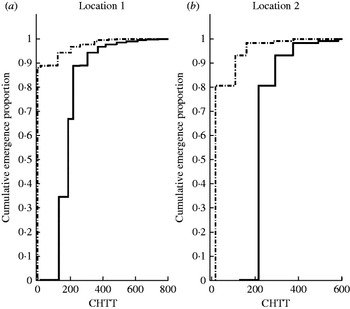
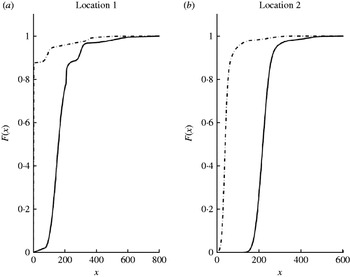
Figure 2 shows the cumulative emergence of B. diandrus at soil depths of 10 and 50 mm for locations 1 and 2 using the mean data. At 10 mm, a very high slope of the distribution function at CHTTs close to zero was observed. This large probability mass close to zero for HTTs at 10 mm leads to the conclusion that this depth is not good for predicting seedling emergence. The emergence distribution is much more spread for HTTs at 50 mm, which is good for weed emergence prediction. In summary, the more spread the distribution of HTT at emergence, the easier it is to predict the emergence process.
Cumulative emergence proportions of B. diandrus for CHTT at soil depths of 10 mm (–·–·–) and 50 mm (—) for (a) location 1 and (b) location 2 using the mean data.

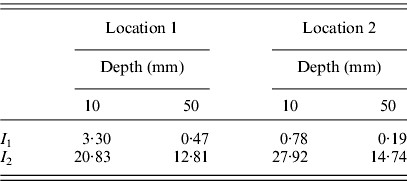
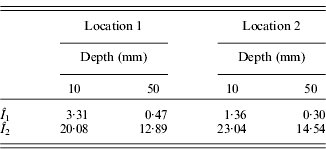
The free statistical software R (R Development Core Team 2008) was used to implement the statistical methods presented in the subsection on Index estimation (above) and in Appendix 1. Using this code, the first two indices (I 1 and I 2) presented in the Emergence indices subsection (above) were estimated for the B. diandrus emergence data in locations 1 and 2. The mean samples of the four cylinders in every location were used. These estimates are collected in Table 3.
Estimated emergence indices Î1 and Î2, based on the coefficient of variation and kurtosis, for the two soil depths (10 and 50 mm) at locations 1 and 2
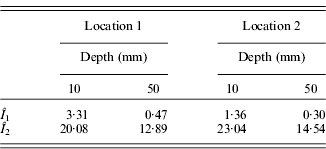
As mentioned above, the best value for the soil depth would be the one with the largest I 1 or the smallest I 2 in Table 3. Unfortunately, the smallest values for I 1 correspond to depths where I 2 attains also its smallest values. In fact, I 1 seems not to be a good index because it changes when adding a constant to CHTTs. For example, if the measurement of HTTs was started a few days earlier, this would give new CHTT values that consist of simply adding a positive number to the actual ones. Then, the estimated index I 1 would be smaller, since remains the same after such a shifting but  is larger. However, both emergence data (with or without shifting) will be equally good for weed emergence prediction. Therefore, it was decided not to use I 1 as a means of comparison. On the other hand, I 2 can be taken as a good index in this case, since its smaller values for depth 50 mm reflect the visual impression in Fig. 2. Consequently, 50 mm seems to be the best soil depth to predict weed emergence in terms of the index I 2.
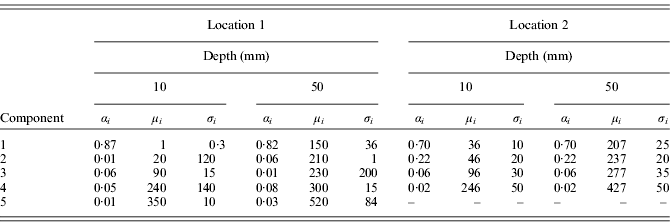
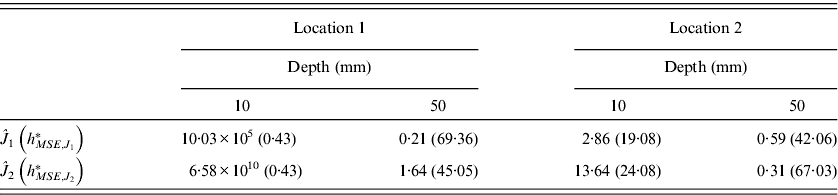
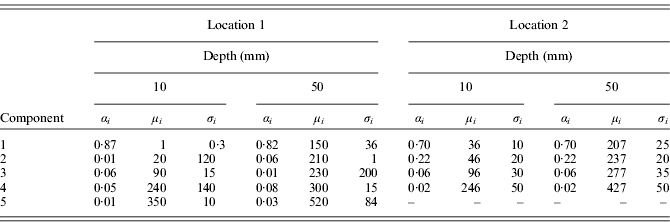
Next, indices J 1 and J 2 for depths of 10 and 50 mm will be estimated. For this, as explained before, a kernel function and a bandwidth parameter must be selected. The proposed bootstrap method to select the bandwidth (described in Appendix 1) needs of a parametric model as prior step. Technical details about functions, parameters and models used in the present research are given in detail in Appendix 2. Using the fitted models with parameter values in Table 4 (see Appendix 2), bootstrap bandwidth selectors were obtained as explained in Appendix 1. Using these bandwidths, non-parametric estimations for the indices J 1 and J 2 were computed. These values as well as the corresponding bandwidths used to compute them (in brackets) are included in Table 5. As pointed out above for index I 2, the values of indices J 1 and J 2 at depth 50 mm are smaller than those at a depth of 10 mm. This is a common feature at both locations. As a consequence, 50 mm seems to be the best soil depth to predict weed emergence also in terms of the indices J 1 and J 2.
Estimated parameters for the normal mixture model for soil depths of 10 and 50 mm at locations 1 and 2
Estimated emergence indices Ĵ1 and Ĵ2, based on the density function, for soil depths 10 and 50 mm at locations 1 and 2. The corresponding bootstrap bandwidths,  and
 , are given in parentheses
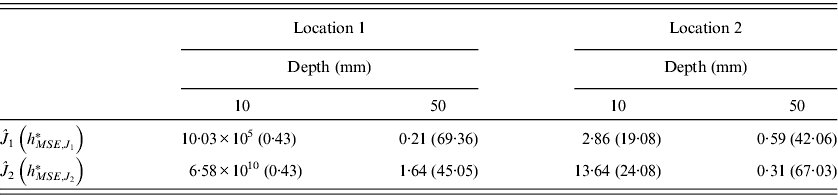
On the other hand, the values of J 1 and J 2 at depth 10 mm are very large for location 1. The reason for these values is the large slope of the cumulative emergence close to zero (see Fig. 2). Thus, J 1 and J 2 capture the intuitive idea of spread and they are useful tools for improving weed emergence prediction.
DISCUSSION
With the decline in the number of selective products available for chemical weed control, and the increase in environmental pressure for reduced pesticide inputs, there is greater emphasis on optimizing the application timing of herbicides. The ability to predict the emergence behaviour of weed species in relation to meteorological events presents a number of practical opportunities to meet these challenges. The development of emergence models could serve as the basis for making decisions on the use of weed management strategies (Izquierdo et al. Reference Izquierdo, González-Andújar, Bastida, Lezaun and Sánchez del Arco2009). However, variation in HTT estimates in soil depths could limit the use of these equations in weed management. Failure to provide an accurate prediction can produce important economic losses by letting many weeds escape to compete with the crop and may contribute greatly to seeds returning to the seedbank (Grundy Reference Grundy2003). Weed scientists choose the depth at which to measure thermal time or HTT without a clear criterion or without establishing the best depth. For instance, Schutte et al. (Reference Schutte, Regnier, Harrison, Schmoll, Spokas and Forcella2008) developed a hydrothermal emergence model for giant ragweed (Ambrosia trifida L.), estimating HTT to 10 mm depth when the maximum emergence for this species was 70 mm. One way of improving the predictability of these equations would be to choose the best soil depth to measure HTT through robust statistical methods involving observation of the depths from which individual seedlings emerge in the field.
As an illustrative example, a dataset concerning B. diandrus emergence has been analysed. Relationships between HTT and cumulative weed emergence proportion have been found for different locations and soil depths (10 and 50 mm).
Indices I 2, J 1 and J 2 are good tools for measuring the spread of the distribution of HTT at emergence at every depth. The flatter the density function, the lower the indices and, consequently, the better the depth for weed emergence prediction purposes.
The values of the estimated indices I 2, J 1 and J 2 for the B. diandrus emergence data are much smaller for soil depth 50 mm than for 10 mm. As a consequence, it is clearly concluded that the best soil depth to model B. diandrus emergence is the estimation of the HTT at 50 mm.
It is important to note that the goal of the present work was not to model the emergence of B. diandrus, but to show how new statistical tools can help to improve the predictive ability of weed emergence models. Development of an accurate model for B. diandrus would require inclusion of the whole range of depths from which this species can emerge.
This research was partially supported by the Spanish Ministry of Science and Innovation, Grant MTM2008-00166 (ERDF included) for the first and the second authors, by Xunta de Galicia Grant PGIDIT07PXIB105259PR for the second author and by Spanish Ministry of Science and Innovation, Grant AGL2005-544 for the fourth and fifth authors. Part of the third author research was done while he was on a stay at University of A Coruña under a Summer Fellowship. We thank two anonymous referees for constructive comments that improved the presentation of this article.
APPENDIX 1
BANDWIDTH SELECTION METHOD
As pointed out above, the choice of the smoothing parameter is important in kernel density estimation. Figure 1 shows how important it is to choose an adequate bandwidth in this set-up. A too narrow bandwidth leads to density estimations with many peaks and valleys, most of them produced by the fact that the CHTTs at emergence are observed in an aggregate way (grouped in intervals). On the other hand, large bandwidths lead to oversmoothed estimations that may hide important features of the distribution. Figure 1 exhibits this problem when estimating only the density, and, since the indices J 1 and J 2 depend on the density, it is clear that a similar problem of bandwidth (h) selection arises when estimating these two indices. To solve this problem, a parametric model is built that mimics the original data and uses the bootstrap method to estimate the mean-squared error of  and
 as a function of the bandwidth, h. Then the bandwidth producing an optimal value for the bootstrap mean-squared error is proposed. Similar ideas have been applied in different contexts by Cao (Reference Cao1993), González-Manteiga et al. (Reference González-Manteiga, Cao and Marron1996) and Cao et al. (Reference Cao, Janssen and Veraverbeke2001).
Using a parametric model as a reference for bandwidth selection is a common practice in density estimation, because the optimal bandwidth often depends on the selection of an auxiliary smoothing parameter, called pilot bandwidth. Silverman's rule of thumb (see, for instance, Silverman Reference Silverman1986) is a first attempt to implement this idea in a single step. Since the choice of the bandwidth, the pilot bandwidth, the prepilot bandwidth, etc., is a never-ending process, some parametric reference is used to stop the process at some stage (often at the second stage). At that point, a parametric model is assumed for pilot or prepilot estimation. The rationale of this method is that although the parametric fit may not be very accurate, it will only be used as a reasonable starting point for bandwidth selection (not for final estimation).
The parametric model for bandwidth selection for CHTT density estimation is a normal mixture distribution with r components. This can be justified by Fig. 2. Consider a discrete random variable G with possible values 1, 2, … , r and probability mass P(G=i)=α i, with α i⩾0 and  . The conditional distribution of X given G=i under this normal mixture model is as follows:

where μ i and  are the mean and variance of the ith component in the normal mixture. As a consequence, the marginal density function of X is a convex linear combination of normal densities:

where ϕ is the standard normal density.
This model is flexible and, when fitted to the data, is a useful parametric reference. Parameter estimation can be carried out using, for instance, the minimum distance approach of Cao et al. (Reference Cao, Cuevas and Fraiman1995). From the fitted model, ideal samples of exact HTTs at emergence can be generated. Obviously, a grouped-data version can be built from such an ideal sample, by mimicking the real data-generating process, i.e. counting the number of seedlings with simulated HTT between two consecutive inspection times. Moreover, once the model has been fitted, the values of the indices can be computed and the distance between these values and the corresponding non-parametric estimators can also be observed.
The method for bandwidth selection proceeds as follows:
1. Given the incomplete original sample F n(y 0), F n(y 1), … , F n(y k) for the sequence of consecutive HTTs y 0⩽y 1⩽…⩽y k, compute estimates,
 , and for the parameters α i, μi and (for i= 1, 2,…,r) of the normal mixture model in Eqn (10).
2. Draw a bootstrap resample, X 1*, X 2*,…, X n*, from the fitted normal mixture density, f (x;
, , ).3. Compute the incomplete version of the bootstrap resample by computing the values F n*(y 0), F n*(y 1),…, F n*(y k), where
4. Fix a bandwidth, h, and use the incomplete bootstrap resample to compute the bootstrap version of the two density-based indices
and , where5. Repeat steps 2–4 a large number, B, of times to obtain B bootstrap replications of these two indices:
, . Use these bootstrap replications to obtain bootstrap estimations of the mean-squared errors:where Ĵ 1par and Ĵ 2par are the indices computed for the fitted normal mixture parametric model:and6. Repeat step 5 for different values of h, as many times as required, in order to approximate numerically the optimal value for h in
and . These bandwidths will be denoted by and .
 ,
 and
 for the parameters α i, μi and
 (for i= 1, 2,…,r) of the normal mixture model in Eqn (
 ,
 ,
 ).

 and
 , where

 ,
 . Use these bootstrap replications to obtain bootstrap estimations of the mean-squared errors:


 and
 . These bandwidths will be denoted by
 and
 .
APPENDIX 2
TECHNICAL ISSUES FOR THE STATISTICAL ANALYSIS OFB. DIANDRUS EMERGENCE
This Appendix gives some detailed information about the functions, parameters and models used to obtain the results presented in the Results Section. The Gaussian kernel is used for non-parametric estimation of the indices  and
 . In order to select the smoothing parameter, the algorithm presented in the previous Appendix is used, with B=500 bootstrap replications. The first task is to fit normal mixture models to the four data sets (depths of 10 and 50 mm for locations 1 and 2). In view of the different distributions of the four emergence data sets (see Fig. 2) the number of normal components in the mixtures has been set to r=5, for depths of 10 and 50 mm in location 1, and r=4, for depths of 10 and 50 mm in location 2. The estimated parameters in these four mixture models are collected in Table 4. Figure A1 shows the emergence cdfs of the fitted parametric models for both locations and depths.
Cumulative emergence for the normal mixture fitted model at soil depth 10 mm (–·–·–) and 50 mm (—) for (a) location 1 and (b) location 2.

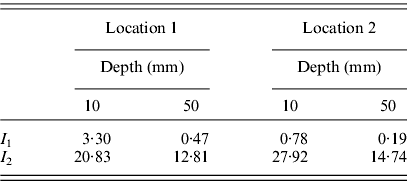
Visual comparison of Figs. 2 and A1 shows that the parametric fits are quite similar to the empirical cumulative emergence data. The indices I 1 and I 2 have been computed for the normal mixture models with the parameters detailed in Table 4. The values of these indices are included in Table A1. It is worth mentioning the good approximation between the non-parametric estimates  and
 (see Table 3) and their parametric counterparts using the fitted normal mixture model. As a consequence of all these features, the fitted parametric models are adequate starting points for bandwidth selection in non-parametric estimation of the indices J 1 and J 2.
Estimated values for the emergence indices I1 and I2 for the fitted normal mixture models