


Introduction
Bering Glacier surge history
During the 20th century Bering Glacier, Alaska, USA (Fig. 1), surged five times, in ∼1900, ∼1920, ∼1938–40, 1957-67 and 1993-95: approximately every 20 years (Reference Molnia, Post, Shuch-mann and JosbergerMolnia and Post, 2010). The 1993-95 surge was keenly studied using aerial photography (Reference Lingle, Post, Herzfeld, Molnia, Krimmel and RoushLingle and others, 1993; Reference Herzfeld and MayerHerzfeld and Mayer, 1997) and synthetic aperture radar (SAR) data (Reference Fatland and LingleFatland and Lingle, 1998; Reference Lingle and FatlandLingle and Fatland, 2003; Reference Roush, Lingle, Guritz, Fatland and VoroninaRoush and others, 2003). The surge started well below the equilibrium-line altitude (ELA) during winter, and was associated with high englacial water pressures, as evidenced by artesian, clear, blue water in fresh crevasses (Reference Lingle, Post, Herzfeld, Molnia, Krimmel and RoushLingle and others, 1993), and by interferometric detection of vertical displacements in Bagley Ice Valley indicating localized subglacial hydraulic jacking (Reference Fatland and LingleFatland and Lingle, 1998; Reference Lingle and FatlandLingle and Fatland, 2003). Analysis of SAR images showed the surge front propagated down-glacier at a rate of 75-112md–1 (27-40 km a-1) in a wave-like fashion, while the ice velocity was considerably less, 10-20md–1 (3.77.3 km a-1) (Reference Roush, Lingle, Guritz, Fatland and VoroninaRoush and others, 2003). The surge also propagated up-glacier at 200-500 md–1 (73-182 km a-1) into Bagley Ice Valley, significantly faster than the rate at which it moved down-glacier. Each stage of the surge ended with an outburst of turbid water into proglacial Vitus Lake (August 1994 and September 1995) (Reference Fatland and LingleFatland and Lingle, 1998).
Location of Bering Glacier. Black rectangle in (a) indicates location of (b) within Alaska.

Optical satellite imagery of the 1993-95 surge is not available due to lack of acquisitions and cloud cover, and SAR interferometry is only capable of producing glacier velocity fields over short time-spans (days to weeks), not over an entire year, so the pre-surge build-up and climax of the surge has never been studied on an annual basis. During the 2000s, though, Bering Glacier began a new surge phase and there is sufficient optical satellite imagery to study the surge through the entire process in the ablation zone.
Previous observations of kinematic waves on glaciers
Traveling waves on glaciers have been reported since the 1890s (Reference SharpSharp, 1954), with observations on the Mer de Glace, France, in 1891–95 (Reference VallotVallot, 1900), on glaciers in Yakutat Bay, Alaska, in the early 1900s (Reference Tarr and MartinTarr and Martin, 1914), on Hintereisferner, Austria, in 1905 (Reference Blumcke and FinsterwalderBlumcke and Finster-walder, 1905), on Black Rapids Glacier, Alaska, in 1936– 37 (Reference HanceHance, 1937), and on Nisqually Glacier, Washington, USA, in the 1950s and 1960s (Reference JohnsonJohnson, 1953; Reference HarrisonHarrison, 1956; Reference Meier and JohnsonMeier and Johnson, 1962). The 1982–83 surge of Variegated Glacier was particularly well studied (Reference KambKamb and others, 1985; Reference RaymondRaymond, 1987). A surge front was observed on Variegated Glacier that was described as a bulge propagating down-glacier which was nearly coincident with a peak in velocity. As the front moved down-glacier, the peaks in height and velocity increased in amplitude and approached the leading edge of the wave. This resulted in a shock-like surge front with longitudinal compression ahead of the surge front and extension behind it. More recently a surge front was observed, via repeat image feature tracking, on Kunyang glacier in the Karakoram mountains of Pakistan (Reference Quincey, Braun, Glasser, Bishop, Hewitt and LuckmanQuincey and others, 2011). Over a 4year period from 2006 to 2010 it was possible to track a velocity front as it grew in intensity and moved down-glacier, until it eventually diminished as the surge ended. However, the rate at which the surge front propagated down-glacier was not measured.
In general, the response of Alaskan glaciers to the warming climate has been to retreat (Reference Hall, Giffen, Chien, Hellstrom and FrankensteinHall and others, 2005), thin (Reference Aðalgeirsdottir, Echelmeyer and HarrisonAðalgeirsdottir and others, 1998; Reference Arendt, Echelmeyer, Harrison, Lingle and ValentineArendt and others, 2002; Reference Luthcke, Arendt, Rowlands, McCarthy and LarsenLuthcke and others, 2008; Reference Berthier, Schiefer, Clarke, Menounos and RemyBerthier and others, 2010) and decelerate (Reference Heid and KaabHeid and Kaab, 2012a). Exactly how surging glaciers will respond to warming trends, either by increasing or decreasing surge frequency and magnitude, is unknown. A complete surge cycle, including the quiescent and active phases, may last from several decades to more than a century (Reference PostPost, 1969). Therefore, it is important to study every surge possible, because they occur only intermittently, and to establish a baseline with which future observations may be compared to determine any possible changes in surge behavior. Consequently, the aim of this study is to observe the build-up and movement of a surge front on Bering Glacier as it progresses down-glacier, measure its speed of propagation, and compare the results with previous observations of the 1993–95 surge.
Methods
For this study, two different feature-tracking algorithms were applied to sequential Landsat-7 Enhanced Thematic Mapper Plus (ETM+) images of the ablation zone to measure the increase in ice surface velocity through time. The first method used orientation images, which are produced by calculating the gradient in brightness values in the north–south and east–west directions across the satellite image, thereby creating a complex image in which the east-west gradient is the real part and the north-south gradient is the imaginary part. Then the signum function (x/|x|) is applied to produce an image with values ranging from - 1 to 1 (Reference Fitch, Kadyrov, Christmas, Kittler, Marshall and RosinFitch and others, 2002; Reference Haug, Kaab and SkvarcaHaug and others, 2010). Orientation images were used because they have been shown to be effective in feature tracking on large glaciers, specifically ice shelves in Antarctica (Reference Haug, Kaab and SkvarcaHaug and others, 2010), and orientation images are not affected by seasonal changes in solar illumination, which is beneficial when performing feature tracking on images taken during different seasons of different years, such as the July 2009 and September 2010 images used in this study (Table 1). Also, orientation images are not impacted by areas of uniform brightness, such as featureless snowpatches found in some of the winter images also used in this study (Table 1). The orientation images were inserted into COSI-Corr feature-tracking software (Reference Leprince, Barbot, Ayoub and AvouacLeprince and others, 2007) to produce velocity maps of Bering Glacier for dates before failure of Landsat-7’s scan-line correction mirror in May 2003. COSI-Corr makes use of the Fourier shift theorem which states the shift between two images is found in their phase difference, as opposed to the similarity of their intensities as with cross-correlation. Transformation of the images into the frequency domain allows isolation of the phase difference and measurement of the displacement between the two images (Reference Shekarforoush, Berthod and ZerubiaShekarforoush and others, 1996). COSI-Corr was chosen due to its proven precision (1/10 pixel) (Reference Scherler, Leprince and StreckerScherler and others, 2008) and because it executes faster than statistical cross-correlation which is performed in the spatial domain.
Pairs of Landsat-7 ETM+ panchromatic imagery and feature-tracking search parameters used in this study. Search and reference window sizes are the same when using orientation correlation, so only one size is listed. When using statistical cross-correlation, the search window is larger than the reference window, so two values are given. The mean georeferencing error is given for each image pair; this value represents the average error in positional accuracy between the images
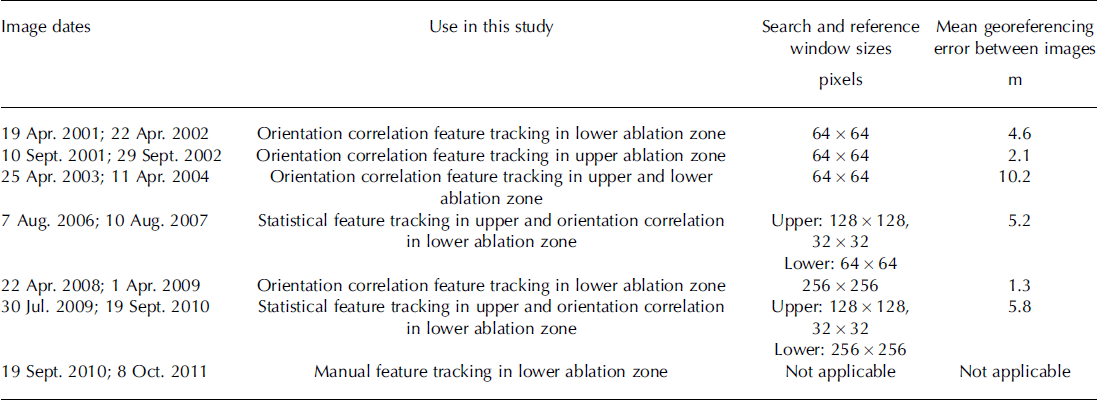
The second feature-tracking program is a statistical cross-correlation algorithm that operates in the spatial domain based upon the work of Reference Ahn and HowatAhn and Howat (2011). It is robust when given Landsat-7 ETM+ images that contain scan-line data voids (SLC-off images), whereas COSI-Corr is not. To achieve this robustness, pixels that lie within a data void are excluded from the cross-correlation calculations; therefore, only actual recorded brightness values contribute to the displacement measurements. Reference Ahn and HowatAhn and Howat (2011) suggest the use of large reference areas with a minimum size of 1 0 0 x 1 0 0 pixels to provide a sufficient number of valid pixels (in the presence of data voids that can be 30 pixels wide) to obtain accurate correlation results. This method was used to produce velocity measurements for areas of the glacier affected by scan-line voids. The piedmont lobe and much of the ablation zone lie within an area in the satellite images in which the scan-line data voids disappear. So, in this area the combination of orientation images and COSI-Corr was used to produce velocity measurements, instead of statistical cross-correlation, after May 2003.
Individual point displacements are assigned to the center of the search window from which they were derived. In the case of statistical cross-correlation this is reasonable because the displacement measurement represents how well pixels within the smaller reference window (centered within the search window) match an equally sized patch within the larger search window. Thus, the displacement represents movement of the ice encompassed within the reference window, taken from the first image, to a new location within the second image. Because the displacement measurement begins at the center of the windows, it is reasonable to assign it to this position within the first image of the image pair. For the case of phase correlation, such as COSI-Corr, the search and reference windows are the same size, so the dominant feature that is tracked may lie anywhere within the windows. It is not feasible to visually examine every match produced by a phase correlation program and determine the location of the feature matched within the windows; therefore, the displacement measurement is assigned to the center pixel of the search window.
Traditionally, optical feature tracking has been performed on the ablation areas of alpine glaciers using summer images in which there are numerous ice surface features to track. However, initial application of the feature-tracking programs to summer images obtained in 2001 and 2002 revealed the effects of shifting surface features caused when sediment layers emerge from the ice due to ablation (Reference Bruhn, Forster, Ford, Pavlis, Vorkink, Shuchmann and JosbergerBruhn and others, 2010). This happens because the exposed edge of the sediment layer lies within a different plane than the ice surface and therefore moves relative to the ice surface as ice melts. This phenomenon is so prevalent on the lower portion of the ablation zone that feature tracking using summer images from 2001 and 2002 yielded unusable results, because the ice is nearly stagnant during the quiescent phase and the apparent motion of the emergent sediment layers is greater than the down-glacier motion of the ice. Therefore, feature tracking was performed on images in which the ablation zone was snow-covered (April 2001 and April 2002) to avoid this problem. The snow in the ablation zone is sufficiently deep to hide the effects of emergent sediment layers, while other features such as prominent medial moraines and crevasses have greater visual contrast, even when snow-covered, and are distinguishable. Therefore, these moraines and crevasses can be reliably tracked because they dominate the local search window, rather than the emergent sediment layers that are buried by snow in winter.
Five velocity maps were produced from the Landsat-7 images, with time frames spanning 2001–02, 2003–04, 2006–07, 2008–09 and 2009–10 (see Table 1 for specific image dates and their use). By summer 2011 the glacier surface was too disrupted by crevasses and contortion of surface features to extract accurate displacement measurements using repeat image feature tracking. Therefore, manual feature tracking was used to measure the displacement of large, obvious moraine features for 2010–11 by visually determining their movement from one image to the next.
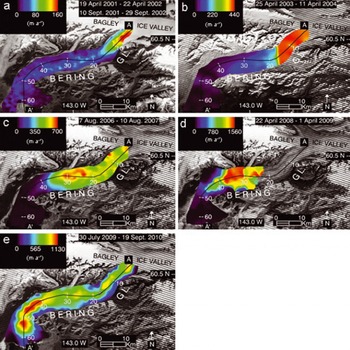
The point displacements produced using the feature-tracking programs are post-processed to eliminate erroneous matches, remove image-to-image georeferencing error, and then turned into velocity rasters. Displacements on dry, cloud-free, snow-free land are averaged to determine the mean georeferencing error between sequential satellite images (Table 1). This error is subtracted from the on-ice displacements to improve their accuracy. The on-ice displacements are filtered using a neighborhood analysis routine to remove statistical outliers. Vectors that have either a direction or magnitude more than ± 2 standard deviations away from their local neighborhood mean (computed from at least the nine nearest vectors) are deemed anomalies and removed. The vector field is then visually inspected and any remaining anomalous vectors are manually removed. The point data are interpolated using a linear inverse distance weighting scheme and then smoothed using a mean filter to produce a velocity raster (Fig. 2) in which the mean is calculated over the area contained by the search window used to produce the velocity field.
Velocity fields for Bering Glacier derived by repeat image feature tracking. (a) Lower ablation zone: 19 April 2001 to 22 April 2002; upper ablation zone: 10 September 2001 to 29 September 2002. (b) 25 April 2003 to 11 April 2004. (c) 7 August 2006 to 10 August 2007. (d) 22 April 2008 to 1 April 2009. (e) 30 July 2009 to 19 September 2010. Transect A-A0 within each panel shows location of velocity profiles in Figure 3. Note: velocity quantization is different for each velocity field to better highlight the spatial structure within each field.
The accuracy of optical feature-tracking methods depends upon how well the two images are co-registered to one another, and the precision of the algorithm used. Typical misalignment between two Landsat-7 ETM+ images acquired within the same World Reference System path and row on different days is <5 m (Reference Lee, Storey, Choate and HayesLee and others, 2004). We find misalignments between sequential satellite images ranging from 1.3 to 10.2 m (Table 1), with a mean (±1 std dev.) for all image pairs of 4 . 8 ± 3 . 1 m, which is in agreement with the value give by Reference Lee, Storey, Choate and HayesLee and others (2004). The precision of COSI-Corr is ∼ 1 m when applied to ETM+ imagery, and for statistical cross-correlation it is ∼ 9 m (Reference Heid and KaabHeid and Kaab, 2012b). Using the root-sum-of-squares method, the overall error in the resulting velocity maps is ± 5 m when using COSI-Corr and ± 1 0 m when statistical cross-correlation is used. These error estimates are valid on dry land without deformation of surface features from one image to the next. Removal of the mean georeferencing error, as described above, will decrease these error estimates. The precision of the 2010-11 displacements obtained using manual feature tracking is estimated to be ± 2 pixels (±30 m) due to the diffuse nature of the moraines that were matched and deformation of the features from one image to the next during the surge climax. The error in the displacement measurements on the glacier ice produced by the feature-tracking programs is difficult to quantify due to compressive and extensive deformation, rotation, emergent features, and crevassing. Statistical cross-correlation is robust against deformation (compression and extension) of surface features due to its pixel-by-pixel correlation process; however, the degree of its robustness has not been quantified. Phase correlation is more sensitive to feature deformation than statistical cross-correlation, but COSI-Corr incorporates a least-squares routine so it is also robust versus surface compression and extension, as well as rotation. But again, the degree of its robustness has not been quantified. Both feature-tracking algorithms are susceptible to mismatches from emergent features and crevassing, but these can be removed with the filtering routines described above. As ice velocity increases during the surge, it is reasonable to assume the degree of surface deformation will also increase. Therefore, we assume the amount of error in the feature-tracking results increases linearly with velocity, from a minimum of ± 1 0 m to a maximum of ±30 m, coinciding with little deformation for slowly moving ice and with the error associated with visual feature tracking during the surge climax, respectively. Under this assumption, the error associated with a velocity of 1500 m a- 1 (roughly the peak velocity in 2008-09 (Fig. 3)) is ±17.5 m a- 1 , or slightly more than ± 1 pixel a- 1 . At a velocity of 4390 m a- 1 , the maximum velocity found using visual feature tracking, the error is ±30 m a- 1 , or ± 2 pixels a- 1 . These error estimates are ∼ 1 % , or less, of their associated velocities and are smaller than the line thickness and size of the individual data points displayed in Figure 3; therefore, no error bounds are shown.
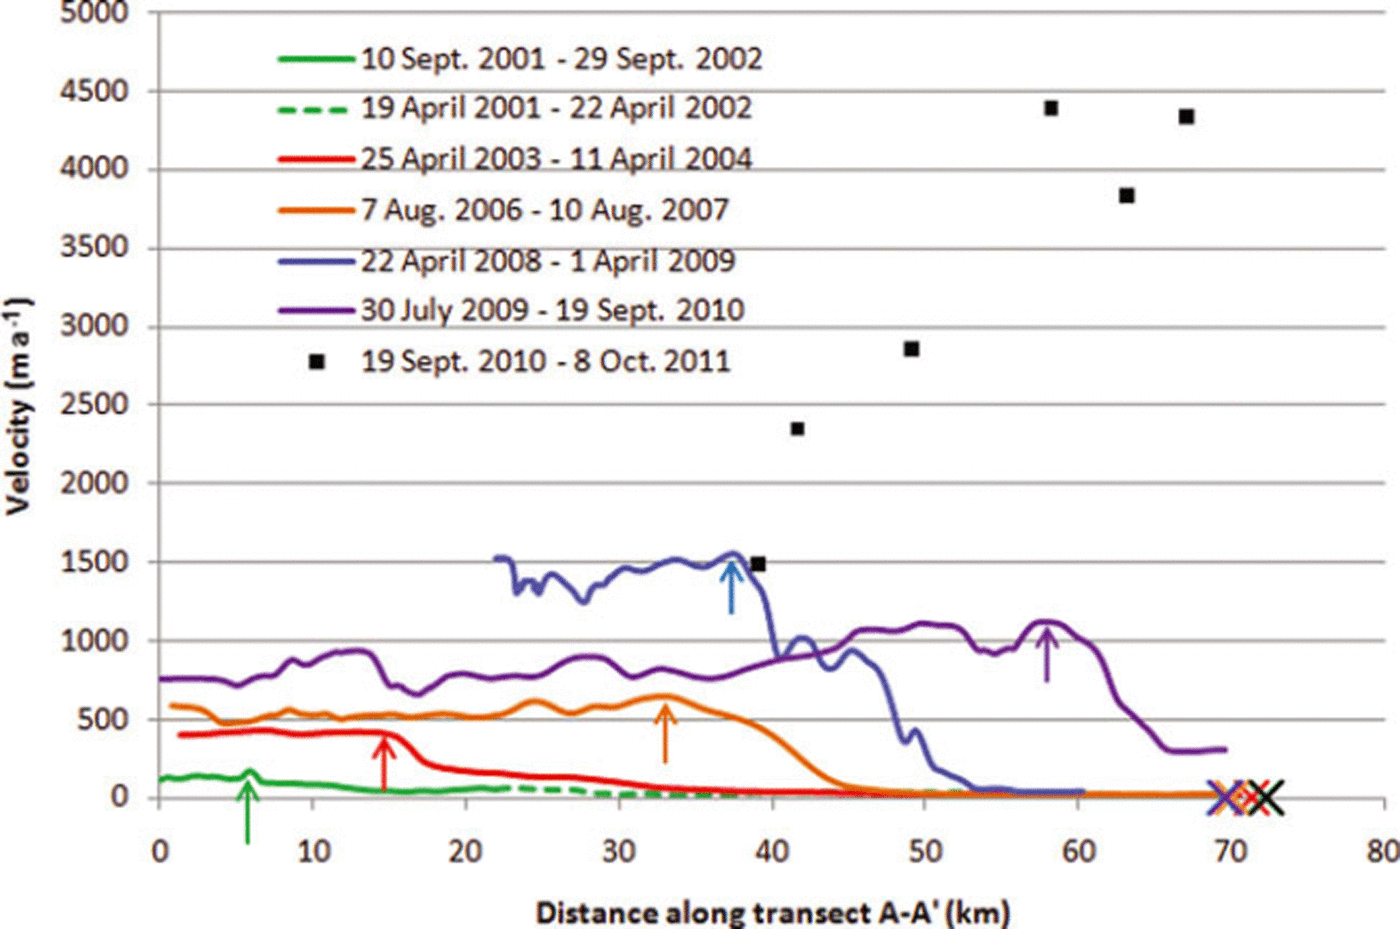
Velocity of Bering Glacier along transect A-A’ for all five velocity fields (colored lines). The surge front is seen in each profile as a step change in velocity, and the peak of the surge front for each profile is indicated by colored arrows. The changing location of the peak indicates the yearly propagation of the surge front down-glacier. The surge front increases in magnitude year-by-year from 2001 to 2009, until in the 2009-10 profile there is a drop in peak velocity. The surge climax is illustrated by the manually determined measurements (individual black squares), in which the velocity approaches 4.4 km a-1. Error estimates for velocity are within the line thickness. Colored crosses on the abscissa indicate position of the glacier terminus in the second image for each image pair used to produce the associated velocity profile of the same color.
Results
Five velocity fields were produced spanning 2001-10 (Fig. 2). A velocity profile along transect A-A’ for each of the five velocity fields illustrates the progression of the surge front down-glacier through time (Fig. 3). Beginning with the 2001-02 profile, we interpret the small rise in velocity at ∼ 6 km from the confluence with Bagley Ice Valley as being the first observable instance of the surge front. In later years it is evident by looking at the peak velocities that the surge front steadily progresses down-glacier and the ice steadily accelerates year-by-year, until there is a drop in maximum ice velocity from ∼1 . 4 ± 0 . 0 1 6 km a- 1 in 2008-09 to 1.2 ±0.015 km a- 1 in 2009-10. It should be noted that the 2008-09 velocity field was produced using winter images (see Table 1), so the velocity field does not extend up-glacier as far as the others due to thicker snow cover at higher elevations obscuring features.
Due to large ice surface deformation and heavy crevassing in summer 2011, repeat image feature tracking was unsuccessful. However, manual tracking of medial moraines was still possible in the lower half of the ablation zone. Manual feature-tracking results, shown as individual points in Figure 3, reveal the piedmont lobe experienced nearly a threefold increase in velocity compared to the previous 2008-09 maximum, with velocities close to 4.4 ± 0 . 0 3 km a- 1 near the glacier terminus and decreasing rapidly up-glacier.
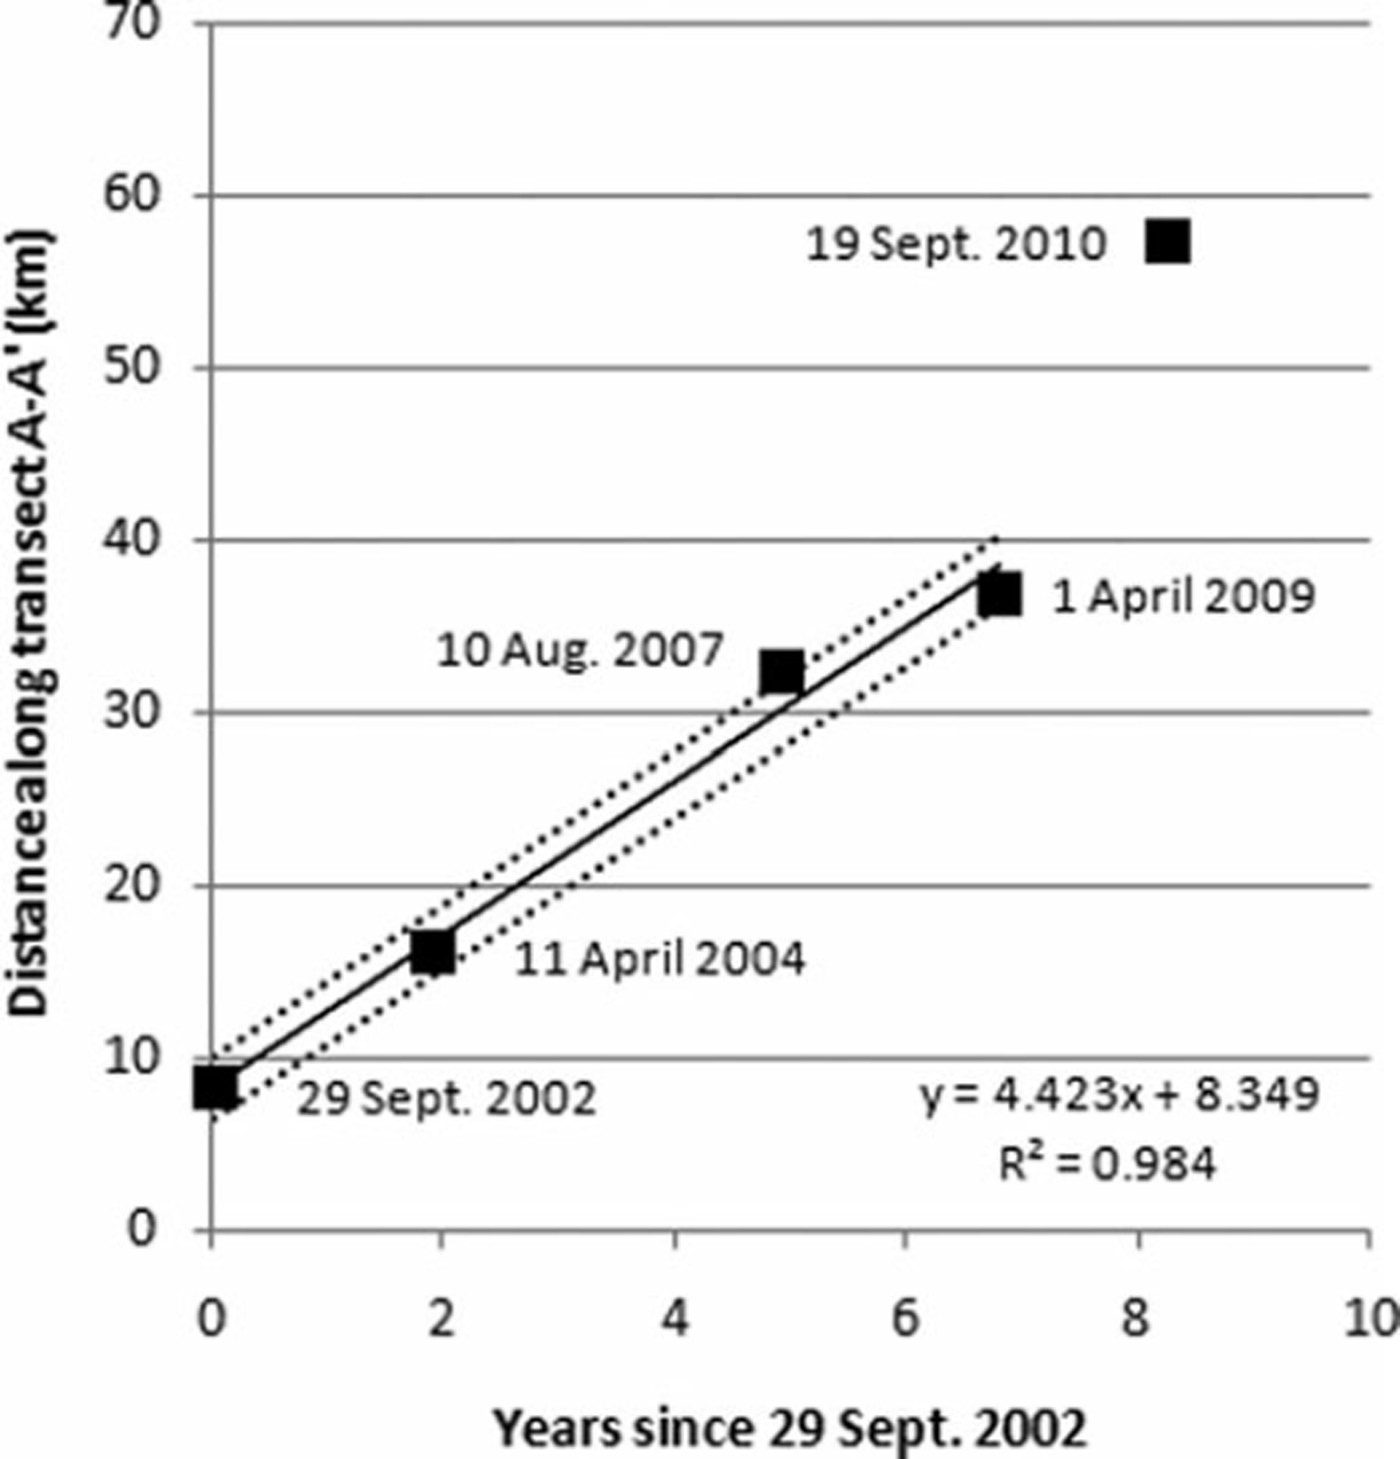
By plotting the position of the surge front’s peak velocity vs time it is possible to determine the rate at which the surge front moved down-glacier (Fig. 4). The slope of the line fitted through the points from September 2002 to April 2009 gives the mean celerity of the surge front during this time, 4.4 ± 2 . 0 km a- 1 . This velocity is greater than the velocity at which the ice moves, which indicates the surge front moves as a kinematic wave. From April 2009 to September 2010 the celerity of the surge front increases to 13.9 ± 2 . 0 km a- 1 . Selecting the location of the peak of the surge front to track its movement down-glacier is subjective, with unknown errors, because the peak is not always obvious. Therefore, the error given for the kinematic wave celerity, ±2.0 km a- 1 , is the standard deviation of the regression analysis used to determine the mean celerity and should be considered a minimum.
Location of the peak of the surge front through time. The abscissa values are the date of the second image within each image pair used to create a velocity field; the date is given next to each point. The ordinate values are the distances of the maximum ice velocity nearest the surge front from the confluence with Bagley Ice Valley. The slope of the solid line fitted through the points from 2002 to 2009 represents the average rate at which the surge front moves down-glacier, 4.4 km a-1. Dotted lines represent ±2.0 km a-1, the standard deviation of the surge front speed. (Reference Roush, Lingle, Guritz, Fatland and VoroninaRoush and others, 2003) using 35 day repeat SAR images showed typical ice velocities of 10-20 m d–1 in the piedmont lobe between August and September 1993. If these rates are extrapolated to an annual velocity (3.7-7.3 km a-1), they are comparable in magnitude to the maximum velocity of the ice presented here, 4.4 ± 0.03 km a- 1.
Discussion
Ice dynamics of the surge
Reference Burgess, Forster, Larsen and BraunBurgess and others (2012) found, via SAR speckle tracking over monthly repeat intervals, that the surge had two phases of acceleration surrounding a slower phase. The first acceleration phase, from September 2008 to February 2009, had ice velocities up to 7md–1 (2.5 km a-1), and the second phase of acceleration, summer 2011, had velocities up to 9md–1 (3.2 km a-1). These speckle-tracking results are of comparable magnitude to the velocities presented here for the April 2008-April 2009 (1.5 ± 0.03 km a-1) and September 2010-October 2011 (4.4 ±0.03 km a-1) time frames. The slower phase described by Burgess and others, from January to April 2010, is within the time-span of our July 2009-September 2010 velocity field and would explain the overall decrease in ice surface velocity up-glacier of the surge front compared to the earlier April 2008-April 2009 velocity field. Down-glacier of the surge front in the 200910 velocity field, the ice accelerated to ∼350ma–1, compared to values of 15-20ma–1 for previous years. This acceleration is likely due to the close proximity of the surge front to the glacier terminus and the associated increased longitudinal stress transfer down-glacier overcoming basal drag near the terminus. In spite of this acceleration, the terminus did not advance, likely due to increased calving into Vitus Lake. In fact, the terminus of Bering Glacier has retreated annually since the end of the previous surge in 1995 (Reference Shuchmann, Josberger, Jenkins, Payne, Hatt, Spaete, Shuchmann and JosbergerShuchmann and others, 2010). It is only since the surge front reached the terminus in 2011 that the terminus has advanced, roughly 2-4 km (see colored crosses in Fig. 4).
The results presented here are annual measurements derived from satellite images acquired ∼1 year apart, and therefore represent an average of the seasonal fluctuations in the surge. Conversely, Reference Fatland and LingleFatland and Lingle (1998) used SAR interferometry to measure displacements over 3 days for the 1993–95 surge, and these more closely represent seasonal velocity in Bagley Ice Valley and are not directly comparable to our measurements. However, visual feature tracking
Kinematic wave
It has been suggested that a surge front represents the transition of the basal hydraulic system from fast, efficient tunnel drainage that promotes ice movement by deformational flow ahead of the front, to a high-pressure linked-cavity system behind the front that promotes flow by sliding (Reference KambKamb and others, 1985). Reference FowlerFowler (1987) describes the transition in terms of activation waves that move up- and down-glacier from a nucleation point, and he states that the passage of the wave indicates collapse of the tunnel drainage system. Fast-flowing ice behind the surge front that is adjacent to slow-moving ice ahead of the front creates large compressive stress and strain gradients across the surge front that induce an increase in ice thickness. Kinematic wave theory predicts this perturbation in ice thickness will diffuse over time as the wave moves down-glacier. Diffusion of the perturbed mass counterbalances the effects of increased ice velocity to stabilize the kinematic wave and produce a wave of constant height that moves with a constant velocity (Reference JohnsonJohnson, 1968). As shown above, the kinematic wave on Bering Glacier propagates down-glacier at an average velocity of 4.4 ± 2 . 0 km a- 1 between September 2002 and April 2009, suggesting in this instance that diffusion acts to stabilize the wave, as theorized by Reference JohnsonJohnson (1968).
The kinematic wave accelerates to 13.9 ± 2 . 0 km a-1 between April 2009 and September 2010. This rate is derived from only two data points, and the straight line connecting them has no inherent statistical deviation, such as would be expected with a linear regression through a cluster of points. So we assign the rate the same error bounds as found for the wave speed from 2002 to 2009. The acceleration of the wave suggests a breakdown of the linear relationship between wave height and speed and replacement by a different response as it enters the piedmont lobe. Several physical variables change from the part of Bering Glacier contained in the valley to the piedmont lobe. The ice is thinnest in the piedmont lobe (Reference Conway, Smith, Vaswani, Matsuoka, Rignot and ClausConway and others, 2009), the valley walls diminish so the ice spreads laterally to form a broad fan, the terminus calves into Vitus Lake, so there may be unknown lakewater effects, and the trend of underlying geologic structures changes. The orientation of geologic and topographic structures in the mid- and upper ablation zone causes mountain ridges adjacent to the glacier to plunge beneath the ice, creating obstacles to flow. This pattern continues down-glacier and into the eastern half of the piedmont lobe. In the western half of the piedmont lobe, the trend in geologic structures changes to a north-south orientation, parallel to ice flow (Reference Bruhn, Forster, Ford, Pavlis, Vorkink, Shuchmann and JosbergerBruhn and others, 2010). Additionally, the existence of subglacial troughs has been noted in SAR imagery of the piedmont lobe (Reference Bruhn, Forster, Ford, Pavlis, Vorkink, Shuchmann and JosbergerBruhn and others, 2010). Exactly how all these physical attributes combine to influence kinematic wave speed is still unknown, but the relationship between wave height and speed has changed from the linear one observed up-glacier, to a new, possibly nonlinear relationship in the piedmont lobe.
Between 2000 and 2003, airborne laser altimetry data showed there were small acceleration events in the accumulation zone that transferred ice down-glacier to the upper ablation zone (Reference Burgess, Forster, Larsen and BraunBurgess and others, 2012). This formed a reservoir area from roughly the 30 km mark (Figs 2 and 3) extending up-glacier to the confluence with Bagley Ice Valley and eastward into Bagley Ice Valley another 5 km, which Reference Burgess, Forster, Larsen and BraunBurgess and others (2012) suggest acted as the trigger area for the first acceleration phase of the 2008-11 surge. In this discussion we refer to the location at which the surge began as the trigger point, or trigger area, and we refer to the location at which the surge front (kinematic wave) began as its nucleation point, or nucleation area. It is probably not a coincidence that our first observation of the kinematic wave in 2001-02 is located in the reservoir area, because Reference FowlerFowler (1987) predicts the wave will nucleate within a reservoir of ice that exceeds its threshold of stability. Reference FowlerFowler (1987) also predicts the surge will begin after the kinematic wave has propagated up- and down-glacier of the entire reservoir area and its hydraulic system has been activated. Our observations seem to confirm this theory. In the current instance, the reservoir extends to roughly the mid-ablation zone by 2007 (cf. fig. 5b in Reference Burgess, Forster, Larsen and BraunBurgess and others, 2012), and our velocity maps show the kinematic wave in this same region, near the 33 km mark, in 2007. The surge begins the next year in 2008, after the wave has passed down-glacier of the reservoir. Reference Roush, Lingle, Guritz, Fatland and VoroninaRoush and others (2003) place the trigger point in 1993 near the 40 km mark. If it is assumed the 1993-95 surge was triggered within a reservoir of ice located in the same region as the current surge, then the 1993-95 surge began down-glacier of the reservoir area as well. Reference Roush, Lingle, Guritz, Fatland and VoroninaRoush and others (2003) also note the surge must have initiated up-glacier of the extent of a 26 March 1993 SAR image because all the ice within that image was rumpled. This places the nucleation point for the 1993-95 surge at least 50 km up-glacier of the terminus near the confluence of Bering Glacier and Bagley Ice Valley, and in the same general location as our first observation of the surge front in the 2001-02 velocity field.
The speed of the surge front during the 1993-95 surge was measured using differential SAR interferometry in winter 1992 and winter 1994 by Reference Fatland and LingleFatland and Lingle (1998). They found the surge front celerity to be up to 100md–1 (36.5 km a-1). This rate is significantly greater than the estimates of 4.4 ± 2 . 0 km a- 1 and 13.9 ± 2 . 0 km a- 1 presented here. Assuming the 1993-95 and 2001-10 surge fronts actually moved at similar rates (because of similar trigger and nucleation points), the difference in magnitude between the two surge front propagation rates may illustrate the difference between seasonal and annual measurements and could indicate a seasonal cycle to surge front propagation, faster in late winter and early spring when creep closure pressurizes englacial and subglacial passages, and slower in summer when channelization of subglacial drainage pathways reduces water pressure. This type of seasonal pattern of surge front acceleration and deceleration was observed on Variegated Glacier in 1982-83 (Reference RaymondRaymond, 1987) in which the leading edge of the surge front moved down-glacier fastest during April and May, and slowest from July to October. Reference Fatland and LingleFatland and Lingle (1998) also note the 1993-95 surge propagated up-glacier into Bagley Ice Valley at 200-500 md–1 (73-182 km a-1), much faster than the down-glacier rate. Due to limitations of optical feature tracking in snow-covered areas, we do not have velocity measurements in Bagley Ice Valley to constrain the up-glacier propagation of the surge and cannot make comparisons with Fatland and Lingle’s observations. Our observations show that a kinematic wave took from 2001 to 2011 to travel ∼ 6 4 km in the ablation zone. Currently no evidence has been presented to show the surge front for the 1993-95 surge had a similar travel time, but considering the recent surge and the 1993-95 surge had similar trigger and nucleation areas, it is not unreasonable to think the two events had surge fronts with similar travel times.
Summary
It has been shown that it is possible to track the build-up and movement of a surge front on a large temperate Alaskan glacier using a combination of repeat image feature-tracking algorithms and Landsat-7 ETM+ imagery, including images with scan-line voids. Analysis of the resulting velocity maps, spanning 2001-10, shows the surge front moved down-glacier in the form of a kinematic wave with an average velocity of 4.4 ± 2 . 0 km a- 1 between September 2002 and April 2009. The small variability in speed of the wave during this time suggests it may have been stabilized by diffusion. The wave then accelerated to 13.9 ± 2 . 0 km a- 1 between April 2009 and September 2010 as it entered the piedmont lobe. The surge appears to have climaxed in summer 2011, with the ice velocity approaching 4.4 ± 0.03 km a- 1 near the terminus. The kinematic wave is estimated to have nucleated near the confluence of Bering Glacier and Bagley Ice Valley as early as 2001. The surge began in 2008 after the kinematic wave moved down-glacier of an ice reservoir area in the mid-ablation zone, suggesting it was triggered there after the reservoir’s basal hydraulic system was converted to a high-pressure linked-cavity system.
Acknowledgements
This project was funded by NASA grants NNX08APZ76 and NNX08AX88G. We thank Torborg Heid of the University of Oslo for generously donating her orientation correlation MATLAB program which was used to produce some of the velocity maps in this study. We thank Ted Scambos of the US National Snow and Ice Data Center, Boulder, CO, for suggesting that we try feature tracking on winter images to avoid the problem of emergent sediment layers in the ablation zone seen in summer images. We also thank the reviewers, including Duncan Quincey, and the editorial staff of Annals of Glaciology whose comments helped to improve the manuscript.



