Nomenclature
- AGCAS
-
Automatic Ground Collision Avoidance System
- CDB
-
Circular distance bin
- CFIT
-
Controlled flight into terrain
- EGPWS
-
Enhanced Ground Proximity Warning System
- FC
-
Forward climb
- FLTA
-
Forward-looking terrain avoidance
- GCAS
-
Ground collision avoidance system
- LC
-
Left climb
- LL
-
Level left
- LR
-
Level right
- RDB
-
Rectangular distance bin
- RC
-
Right climb
- SOC
-
System Operating Characteristic Curve
- TAWS
-
Terrain awareness and warning system
- TGCAS
-
Tactical Ground Collision Avoidance System
1.0 Introduction
In modern military and civil fields, aircraft has become an indispensable tool for transportation or combat. To ensure the safety of aircrew is one of the basic requirements for aircraft missions. According to statistics, most aircraft safety accidents are controlled flight into terrain (CFIT) [Reference Pranav, Tanishq and Chetan1]. For CFIT accidents, ground approach warning systems were first established in the United States as early as the 1970s. Flight conditions were monitored by radio altimeter and barometric altimeter. It provides the pilot with auditory and visual warning signals when there is threatening terrain ahead of the flight path [Reference Maley, Hubbard and Urban2, Reference Brugnara, Andrade and Fontes3].
With the rapid development of digital map technology and navigation technology, there are two kinds of mature ground collision avoidance early warning systems after years of updating and improvement. One is the enhanced ground approach warning system for commercial aircraft systems, such as the Terrain Awareness and Warning System (TAWS) [Reference Breen4, Reference Gellerman, Kaabouch and Semke5]. The other is the automatic avoidance collision warning system for high manoeuverability fighters, such as the Automatic Ground Collision Avoidance System (AGCAS) [Reference LeBourne6, Reference Sachs, Sennes and Dudek7]. The Enhanced Ground Proximity Warning System (EGPWS) includes seven warning modes and forward-looking terrain avoidance (FLTA) [Reference Josel8, Reference Gang, Fang and Wu9]. Because commercial aircraft typically plan their routes in advance, TAWS systems can only provide pilots with effective warnings about the dangerous terrain ahead. Whether and how to perform evasive manoeuvers depends largely on the pilot’s own experience. At present, most of the literature and patents related to TAWS focus on reducing interference warning and modulating warning envelope. For example, (Ref. [Reference Chen and Zhao10] proposed a method to adjust the envelope of forward-looking terrain warning according to navigation performance. Reference [Reference Wu and Zhang11] compares the received radar echo with the existing database to achieve interference early warning and suppression. In addition, Refs Reference Kuchar12–Reference Kuchar15) analysed the early warning performance and collision detection model under different terrain categories by using system operating characteristic curve (SOC) and Monte Carlo simulation methods based on relevant statistical theories. Reference [Reference Gingras and Ralston16–Reference Lu18] designed warning thresholds by establishing normal trajectories and escape trajectories.
For highly manoeuverable aircraft, the US Air Force has proposed and developed an automatic disposal scheme that can automatically recover the aircraft when the pilot is unable to avoid a collision [Reference Swihart and Griffin19]. In 2012, a Tactical Ground Collision Avoidance System (TGCAS) was proposed to provide CFIT protection for military flight phases close to the ground, such as low-altitude flight or low-altitude delivery [Reference Goerke and Berger20]. Subsequently, in 2018, an AGCAS was proposed, mainly for military aircraft F-16 and F-35, to prevent CFIT through an automatic recovery mechanism. AGCAS protects the pilot and the aircraft when the pilot’s mission is saturated, disoriented, or ineffective [Reference Carpenter, Gahan and Cobb21].
Whether civil aviation aircraft or military fighter aircraft, it is a research direction to ensure flight safety to provide appropriate evasive manoeuver decision-making advice to pilots on the basis of early warning information. Reference [Reference Penney22] proposed a 3-TPA (trajectory Prediction algorithm) ground collision avoidance system for small UAVs. Reference [Reference Angela23] found the optimal avoidance trajectory satisfying enthusiasm and timeliness by constructing the cost function. But because the solution of the algorithm is nonlinear, the real-time performance is poor. References [Reference John24–Reference Kenneth26] has compared and analysed the performance of AGCAS system under different integration methods, look-ahead time and update rate. Reference [Reference Kirkendoll and Hook27] provide a framework for evaluating trajectory prediction algorithms applicable to general aviation. However, the current reference avoidance trajectories all use extreme or fixed manoeuvers without considering the impact of terrain environment and manoeuverability on avoidance decision-making. For example, in the face of gentle threatening terrain, a small pull-up load can satisfy the avoidance requirement.
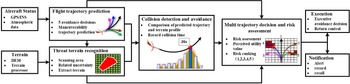
In this paper, a ground collision avoidance warning and decision system with multi-trajectory risk assessment and decision function is proposed to provide the comprehensive avoidance decision for the flight crew. The system structure is shown in Fig. 1. The main contributions of this paper can be summarised as follows:
-
(1) The terrain extraction method is optimised. The rectangular distance bin is designed to replace the circular distance bin to extract the terrain contour of each predicted trajectory and improve the correlation between the extracted terrain and the real terrain.
-
(2) A multi-trajectory risk assessment and decision function is proposed, which comprehensively considers aircraft manoeuvers, threat terrain conditions, and predicted impact time, prioritises the avoidance decision, and provides the minimum required load factor for safety avoidance decision.
The remainder of this paper is structured as follows. Section 1.0 provides a literature review regarding the related work. In Section 2.0, we introduce the working principles of the traditional GCAS and optimise the terrain extraction method in the threat terrain recognition module. Then, in Section 3.0, the proposed multi-trajectory risk assessment and decision function is illustrated in detail. Section 4.0 discusses and analysis the numerical performance of the proposed system in contrast with the traditional GCAS. Finally, concluding remarks and future directions of research are given in Section 5.0.
The structure of ground collision avoidance warning and decision system.

2.0 Ground collision avoidance system
2.1 Flight trajectory prediction
Flight trajectory prediction is mainly realised by state recurrence of kinematic equation. Raghunathan et al. outlined a 3-DOF model that accurately represents the movement of an aircraft over a short period of time. The simplified aircraft motion model by introducing load factors is obtained as follows [Reference Raghunathan, Gopal, Subramanian, Biegler and Samad28]:
 \begin{align}\dot x = V\cos \vartheta \cos \psi \end{align}
 \begin{align}\dot y = V\cos \vartheta sin\;\psi \end{align}
 \begin{align}\dot z = V\;sin\;\vartheta \end{align}
 \begin{align}\dot \vartheta = \frac{{{N_z}\cos \phi - g\cos \vartheta }}{V}\end{align}
 \begin{align}\dot \psi = \frac{{{N_z}\sin \phi }}{{V\cos \vartheta }}\end{align}
where
 $\dot x$
,
 $\dot y$
and
 $\dot z$
are the speed of the flight path direction, lateral and vertical respectively. V is the ground speed.
 $\vartheta $
is the pitch angle.
 $\psi $
is the heading angle.
 $\phi $
is the roll angle. g is the gravity. N
z
is the load factor. For most tactical aircraft, the conservative threshold is
 $ - {60^ \circ } \le \phi \le {60^ \circ }$
,
 $0g \le {N_Z} \le 2g$
[Reference Penney22].
Currently, most avoidance manoeuvers use the standard vertical forward pull manoeuver, that is, first roll the wing to a horizontal position and then do an upward pull manoeuver with a load factor of 2 g [Reference Swihart, Arthur and Edward29]. However, when the aircraft is faced with threatening terrain, the forward pull manoeuver is not always the most effective avoidance decision. We can plan five avoidance decisions in flight space: level left (LL), left climb (LC), forward climb (FC), right climb (RC), and level right (LR).
2.2 Threat terrain recognition
After predicting the flight path, the threat terrain recognition module extracts the terrain under the flight trajectory. Due to the uncertainty of the aircraft’s position, a scanning area needs to be established to capture all the terrain it may fly over. The scan area can be divided into three categories based on the current state of the aircraft. In the case of straight flight, the scanning area is trapezoidal. In the case of turning flight, the terrain scan area is tubular. In the case of vertical dive, the scan area is polygon [Reference Penney22]. The two main factors that determine the width of the scan area are the uncertainty of the navigation horizontal solution and the uncertainty of the predicted trajectory. The formula for calculating the half-width of the scan area is
 \begin{align}HalfWidth = {\sigma _{XY}} + {D_{TPA}}^{\ast}\sin\!(\alpha )\end{align}
where,
 ${\sigma _{XY}}$
is the error value of the navigation solution in the horizontal direction.
 ${D_{TPA}}$
is the distance from the current trajectory point to the current position, which is the cumulative value between each trajectory point.
 $\alpha $
is the uncertainty increase angle of the predicted trajectory.
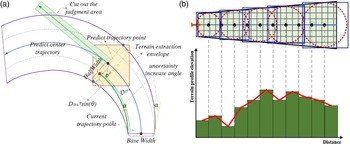
Through a large number of flight test analysis, the uncertainty increase angle of the predicted trajectory is 5° for straight flight and 10° for turning flight [Reference Penney22]. The schematic diagram of scanning area for turning is shown in Fig. 2(a). The solid blue line shows the predicted flight trajectory, the blue dashed line shows the boundary with navigation uncertainty added. The purple line shows the boundary of the scan area after adding trajectory uncertainty.
Schematic diagram related to terrain extraction. (a) Terrain scanning area when turning. (b) The simplified 2D terrain profile.

2.3 Collision detection
The collision detection module extracts the terrain elevation in the scanned area and converts it into a form that can be compared with the predicted trajectory. A relatively simple and effective method is to divide the topographic data into a series of bins with a fixed distance from the aircraft along the centre line of the scanned area, called ‘distance bins’. The highest terrain elevation in the distance bin is taken to generate a simplified terrain profile, as shown in Fig. 2(b). The shape and size of distance box directly affect the result of collision detection. The traditional method takes the predicted trajectory point as the centre of the circle and the uncertainty width as the diameter to build a circular distance bin, as shown in the red dashed line in Fig. 2(b).
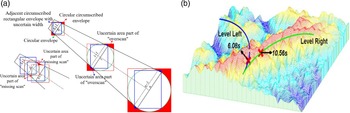
The terrain elevation data are mostly stored in grid form. Rectangular distance bin is more conducive to the extraction of terrain data. The rectangular distance bin consists of the uncertain widths of two adjacent predicted trajectory points, as shown in the yellow rectangle in Fig. 2(b). The improved range bin is no longer affected by the sampling interval, which solves the ‘missed scan’ problem caused by the sampling interval. As can be seen from Fig. 3(a), the ‘over-scan’ area of the rectangular distance bin is significantly reduced. The coordinate range of the rectangular distance bin on the terrain elevation map is described as
 \begin{align} \left\{\!\begin{array}{l} X_{L}(k) = x(k) - W_{half}(k)\sin\!(\theta(k))\\[5pt]Y_{L}(k) = y(k) - W_{half}(k)\cos\!(\theta(k))\\[5pt]X_{R}(k) = x(k) - W_{half}(k)\sin\!(\theta(k))\\[5pt]Y_{R}(k) = y(k) - W_{half}(k)\cos\!(\theta(k)) \end{array}\right. \end{align}
 \begin{align} \left\{\!\begin{array}{l} Rs=\textrm{max}\{X_{L}(k-1),X_{R}(k-1),X_{L}(k),X_{R}(k)\}\\[5pt]Rx=\textrm{min}\{X_{L}(k-1),X_{R}(k-1),X_{L}(k),X_{R}(k)\} \end{array}\right. \end{align}
 \begin{align} \left\{\!\begin{array}{l} Cs=\textrm{max}\{Y_{L}(k-1),Y_{R}(k-1),Y_{L}(k),Y_{R}(k)\}\\[5pt]Cx=\textrm{min}\{Y_{L}(k-1),Y_{R}(k-1),Y_{L}(k),Y_{R}(k)\} \end{array}\right. \end{align}
where k represents the sampling time; x(k) and y(k) are the coordinates of the predicted trajectory point; X L , X R , Y L , and Y R are coordinates with uncertain widths; Rs, Rx, Cs, and Cx are the row and column value ranges of the rectangular bins on the terrain elevation map, respectively.
Schematic diagram related to collision detection and avoidance decision. (a) Distance bin under different shape and intervals. (b) Example avoidance situations.

The extracted terrain profile is compared with the predicted flight avoidance trajectory. If the terrain profile intersects the predicted avoidance trajectory, the predicted trajectory cannot avoid the threat terrain. The predicted collision point position was recorded and the predicted collision time C Time was calculated. Otherwise, the predicted trajectory can safely avoid threatening terrain. The predicted collision time C Time is equal to the total trajectory prediction time A Time . The predicted collision time is
 \begin{align}{C_{Time}} = \left\{ \begin{array}{l@{\quad}l} {i \cdot \Delta t} & {i \ne 0} \\[5pt] {{A_{Time}}} & {i = 0} \end{array} \right.\end{align}
However, the circular distance bin is easily affected by the sampling interval when extracting the terrain profile. As shown in the red area in Fig. 3(a), when the interval between adjacent samples is large, the phenomenon of missed scan will occur. When the interval between adjacent samples is small, the phenomenon of over-scan’ will occur. As the speed increases, the over-scan area will also increase, which will interfere with collision determination.
3.0 Multi-trajectory risk assessment and decision function
For the avoidance decision, the traditional GCAS adopts the simple “Last Man Standing” idea, that is, the trajectory with the longest predicted collision time is selected as the avoidance decision [Reference Kenneth26]. However, the method provides most evasive manoeuvers using extreme load factors. For example, in the environment shown in Fig. 3(b), the predicted collision time for a right turn is longer, but the terrain around its trajectory is steeper. A left turn predicts a shorter collision time, but the terrain around its trajectory is relatively flat. If the right turn is chosen, a large climb load factor is required, which is not conducive to the future safe flight.
For various avoidance trajectories, flight crews tend to compare the results when making decision; if the trajectory enables the aircraft to successfully avoid the threatening terrain, the flight crew will be rejoiced; if the trajectory causes the aircraft to collide with the ground, the flight crew will regret choosing this decision. Therefore, the risk of the decision trajectory can be assessed by the regret theory (regret-rejoicing value) [Reference David30, Reference Liao, Jiang and Wang31], and then the best avoidance decision can be selected. Since avoidance trajectory have multiple load factor attributes and is affected by the characteristics of the threatening terrain, the traditional regret theory cannot be directly applied to select the best decision. Therefore, we proposed a new multi-attribute avoidance decision-making model based on the regret theory to realise the multi-trajectory risk assessment and decision function.
3.1 Multi-attribute avoidance decision-making model
Let
 $\boldsymbol\varUpsilon = \left\{ {{\Upsilon _1},{\Upsilon _2}, \ldots ,{\Upsilon _t}} \right\}$
be system states,
 $\boldsymbol{p} = \left\{ {{p_1},{p_2}, \ldots ,{p_t}} \right\}$
be the probability of state occurrence and
 $\sum\limits_{k = 1}^t {{p_t}} = 1$
,
 $\boldsymbol{A} = \left\{ {{A_1},{A_2}, \ldots ,{A_m}} \right\}$
be the multiple avoidance decisions,
 $\boldsymbol{C} = \left\{ {{C_1},{C_2}, \ldots ,{C_n}} \right\}$
be the aircraft load factor attributes,
 $\boldsymbol{X} = {\left[ {x_{ij}^t} \right]_{m \times n}}$
be the result matrix for avoidance decision, and
 $x_{ij}^t$
represents the result of avoidance decision
 ${A_i}$
in state
 ${\Upsilon _t}$
with attribute
 ${C_j}$
.
According to the regret theory, in the state
 ${\Upsilon _t}$
, there exists a utility function
 ${v_j}$
and a monotonically increasing odd function
 ${\tau _j}$
, when avoidance decision
 ${A_1}$
is preferred to
 ${A_2}$
for attribute
 ${C_j}$
should be satisfied
 \begin{align}{\tau _j}\!\left( {{v_j}\!\left( {x_{1j}^t} \right) - {v_j}\!\left( {x_{2j}^t} \right)} \right) \gt 0\end{align}
where,
 ${\tau _j}$
is the regret-rejoicing function under attribute
 ${C_j}$
.
Since multi-attribute is a feature of the decision result, each attribute affects the making-decision. Therefore, according to the additive effect, the value difference (regret-rejoicing value) between avoidance decision
 ${A_1}$
and
 ${A_2}$
under each attribute can be accumulated. Since
 ${\tau _j}$
is the monotonically increasing odd function, its accumulation still satisfied
 \begin{align}{A_1} \succ {A_2} \Leftrightarrow \int_\Upsilon {\varphi \!\left( {\sum\limits_{j = 1}^n {{\tau _j}\!\left( {{v_j}\!\left( {x_{1j}^t} \right) - {v_j}\!\left( {x_{2j}^t} \right)} \right)} } \right)} d{p_t} \gt 0\end{align}
where,
 $ \succ $
denotes prefer, and
 ${A_1} \succ {A_2}$
denotes avoidance decision
 ${A_1}$
is preferred to
 ${A_2}$
.
In this paper, there is only one state that whether aircraft collision. Therefore, the
 $t = 1$
,
 $\varUpsilon = {\varUpsilon _1}$
, and the probability of state occurrence is 1. The formula () can be simplified as
 \begin{align}{A_1} \succ {A_2} \Leftrightarrow \sum\limits_{j = 1}^n {{\tau _j}\!\left( {{v_j}\!\left( {x_{1j}^{}} \right) - {v_j}\!\left( {x_{2j}^{}} \right)} \right)} \gt 0\end{align}
For any attribute
 ${C_j}$
, the avoidance decision
 ${A_i}$
always has an ideal avoidance decision
 $A_i^*$
and the corresponding decision result
 $x_i^*$
, such that selecting any other avoidance decision behaves as regret, as follows.
 \begin{align}{\tau _j}\!\left( {{v_j}\!\left( {{x_{ij}}} \right) - v\!\left( {x_i^*} \right)} \right) \lt 0\end{align}
Then the avoidance decision
 $\boldsymbol{A}_{j} = \left\{ {{A_{1j}},{A_{1j}}, \ldots ,{A_{mj}}} \right\}$
under any attribute
 ${C_j}$
does not need to be judged preferentially, and all decisions only need to be judged preferentially with the ideal decision
 $A_i^*$
, which not only ensures that all decisions have a uniform comparison base, but also reduces the number of calculations. In addition, the perceived utility value
 ${u_{ij}}$
of the avoidance decision
 ${A_i}$
for attribute
 ${C_j}$
can be obtained from the self-utility value and the regret value, as follows.
 \begin{align}{u_{ij}} = {v_j}\!\left( {{x_{ij}}} \right) + {\tau _j}\!\left( {{v_j}\!\left( {{x_{ij}}} \right) - {v_j}\!\left( {x_i^*} \right)} \right)\end{align}
Since utility function
 ${v_j}$
and regret-rejoicing function
 ${\tau _j}$
are both monotonically increasing odd functions, the perceived utility value
 ${u_{ij}}$
under each attribute is cumulated as the overall perceived utility value
 ${u_i}$
of the avoidance decision
 ${A_i}$
under all attributes, as follows.
 \begin{align}{u_i} = \sum\limits_{j = 1}^n {\left( {{v_j}\!\left( {{x_{ij}}} \right) + {\tau _j}\!\left( {{v_j}\!\left( {{x_{ij}}} \right) - v\!\left( {x_i^*} \right)} \right)} \right)} \end{align}
3.2 Risk assessment and decision function
Based on the overall perceived utility value, the multi-trajectory risk assessment and decision are realised as follows.
Let
 $\boldsymbol{A} = \left\{ {FC,LL,LR,LC,RC} \right\}$
be avoidance decisions and
 $\boldsymbol{C}$
be the range of the load factor. Since the decision result of each trajectory is affected by multiple factors such as threaten terrain characteristics, the prediction collision time and cut-off information, it needs to design risk assessment parameters to calculate the decision result
 $\boldsymbol{X}$
under multiple factors. The risk assessment parameters mainly include occurrence, severity, and degree of cut-out.
Occurrence is the ratio of the number of terrain elevations in which the terrain profile exceeds the predicted trajectory height to the total number of terrain elevations. The greater the occurrence, the higher the risk of collision on the predicted trajectory. The formula for calculating the occurrence O is
 \begin{align}O = {{{N^j}({H_T} \gt H)} \over {{N^j}_{All}}}\end{align}
where j is the sampling sequence number of the load factor, H T represents the terrain height. H represents the predicted trajectory height.
Severity is the ratio of the predicted collision time to the total trajectory prediction time. The greater the severity, the closer the threat terrain is to the aircraft. The formula for calculating the severity S is
 \begin{align}S = 1 - {{C_{Times}^j} \over {A_{Time}^j}}\end{align}
where C Time represents the predicted time of the collision between the predicted trajectory collides with the threat terrain, and A Time is the total trajectory predicted time.
The tangent line is made for each trajectory point before the collision point (safe trajectory point) on the predicted trajectory, and then the judgement area is cut out according to the uncertainty width of the current position, as shown in the green area in Fig. 2(a). If there is non-threaten terrain in the cut-out area for three consecutive frames, it is a trajectory point that can be cut-out; otherwise it is a trajectory point that cannot be cut-out. Cut-out degree is defined as the ratio of the number of the trajectory points that can be cut-out to the number of the safe trajectory points. The smaller the cut-out degree, the safer the predicted trajectory. The calculation model of cut-out degree D is
 \begin{align}D = 1 - {{N_{cut - out}^j} \over {N_{safe}^j}}\end{align}
where N cut-out represent the number of the trajectory points that can be cut-out, N safe represent the number of the safe trajectory points.
According to the above definition, we can calculate the perceived utility value of each attribute under different decision results. Since the values of each attribute are homogeneous, we use the same utility function
 $v$
and regret-rejoicing function
 $\tau $
for all attributes
 $\boldsymbol{C}$
. Then, the perceived utility values of each avoidance decision under different decision results are summed up to realise the prioritisation of the avoidance decision
 $\boldsymbol{A}$
. The specific execution steps are as follows.
Step 1: Calculate the overall perceived utility value.
Let decision result matrix be
 $\boldsymbol{X} = \left\{ {O,S,D} \right\}$
. For each decision result, the perceived utility value of each trajectory under all load factor attributes is calculated as
 \begin{align}u_i^\boldsymbol{X} = \sum\limits_{j = 1}^n {\left( {v(\boldsymbol{X}_{ij}^{}) + \tau (v(\boldsymbol{X}_{ij}^{}) - v(\boldsymbol{X}_{}^*))} \right)} \end{align}
where i is the sequence number of the avoidance decision;
 $\boldsymbol{X}_{}^*$
is the ideal decision result (ideally, the decision result is zero, i.e.,
 ${O^*} = 0$
,
 ${S^*} = 0$
, and
 ${D^*} = 0$
);
 $v(x) = {x^\iota }$
is the utility function, in which
 $\iota $
is the risk coefficient of decision
 $(0 \lt \iota \lt 1)$
, and the smaller
 $\iota $
, the higher risk;
 $R(x) = 1 - {e^{ - \delta \cdot x}}$
is the regret-rejoicing function, in which δ is the regret coefficient of decision, and the greater δ, the higher regret.
Step 2: Calculate the relative importance.
The relative importance is determined by the overall perceived utility value of each decision result, which measure the risk of each avoidance decision. The formula to calculate the relative importance
 ${Q_i}$
is as follows.
 \begin{align}{Q_i} = u_i^O + u_i^S + u_i^D\end{align}
Step 3: Determine the risk level of the avoidance decision.
Relative importance combines the impact of threat terrain and aircraft manoeuverability. Therefore, all avoidance decisions can be prioritised according to
 ${Q_i}$
. For convenience, we use a normalised percentage to define the risk level for each avoidance decision. The lower the risk level, the less dangerous the decision. The risk level calculation formula for each decision is as follows.
 \begin{align}Leve{l_i} = \frac{{{Q_i}}}{{{Q_{\max }}}} \times 100\% {\rm{ }},{\rm{ }}i = 1,2, \ldots ,5\end{align}
where
 ${Q_{\max }} = \mathop {\max }\limits_{1 \le i \le 5} \left\{ {{Q_i}} \right\}$
is the maximum value of the relative importance of all avoidance decisions.
Finally, the avoidance decisions FC, LL, LR, LC, and RC are prioritised according to the risk level
 $Leve{l_i}$
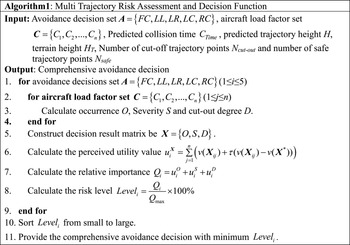
of each avoidance decision. And the comprehensive avoidance decision with the highest priority is provided for the flight crew. In addition, the proposed method can give the minimum required load factor attribute value under the provided decision. The pseudocode graph of the multi-trajectory risk assessment and decision-making function is shown in Fig. 4.
Pseudocode graph of the multi-trajectory risk assessment and decision-making function.

4.0 Simulation results and discussion
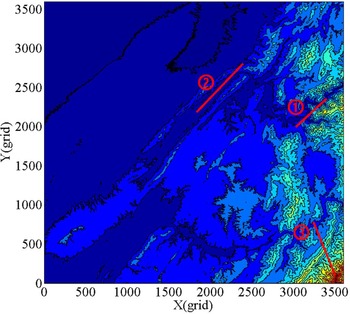
The algorithm is verified by using a real-terrain elevation map and simulated flight trajectory. The size of the digital elevation map used in the experiment is 540 km × 540 km, and the map resolution is 30 m. The terrain map and the three simulated flight trajectories are shown in Fig. 5, including flight path  in the box-type terrain environment (Case 1), flight path
 in the steep mountain environment (Case 2), and flight path
 in the canyon environment (Case 3). The load factor ranges from 1 g to 2 g, the roll angle of the left and right climbing trajectory is 15°, the roll angle of the left and right horizontal trajectory is 30°, the forward-looking prediction time is 35 s, and the refresh rate is 12.5 Hz.
The terrain contour map and the simulated flight trajectory.

4.1 Experiment 1: rectangular distance bins test
For each avoidance trajectory, the terrain profile below the predicted avoidance trajectory is extracted by using circular distance bins (CDB) and rectangular distance bins (RDB) under the lower limit load of level turning (1.2 g). And then calculate the correlation with the real terrain profile under the true flight path, as shown in Table 1. It can be seen that compared with CDB, the terrain correlation coefficient of RDB is closer to 1. This shows that the terrain profile extracted by the rectangular distance bins used in this paper is closer to the real terrain profile.
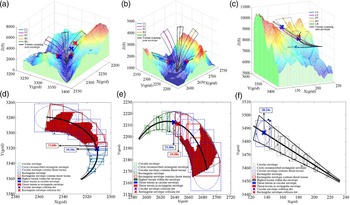
In order to further compare the two distance bins, Table 2 shows the predicted collision time of five collision avoidance decisions under different distance bins in three cases. Figure 6 shows the 3D collision avoidance trajectory of three cases under the lower limit load of level turning (1.2 g) and draws the top view of the terrain scanning area with LL, RC and FC as examples.
The Terrain Correlation under different distance bin

The predicted collision time under different distance bin

Avoidance trajectory and terrain scanning area in different cases. (a) 3D collision avoidance trajectory in Case 1. (b) 3D collision avoidance trajectory in Case 2. (c) 3D collision avoidance trajectory in Case 3. (d) Terrain scanning area with LL in Case 1. (e) Terrain scanning area with RC in Case 2. (f) Terrain scanning area with FC in Case 3.

As can be seen in Table 2, compared with the CDB, the predicted collision time of the RDB is longer. Taking LR as an example, the prediction time of RDB is 1.76 s, 2.24 s and 2.48 s longer than that of CDB in three cases. And the collision site of the RDB in Fig. 6 is closer to the threat terrain. This reduces the interference of premature warnings to the flight missions and increases the pilot’s response time. In addition, it can be seen from Fig. 6(c) that the FC avoidance decision using CDB has a ground collision alarm, while the FC avoidance decision using RDB has no alarm. And in Fig. 6(f), there is no threaten terrain in the scanning area, so this alarm is false alarm. The main reason is that when the CDB is used to extract terrain, it is necessary to construct a circumscribed rectangular envelope. This expands the extraction range and exacerbates the “overscan” phenomenon, leading to false alarms.
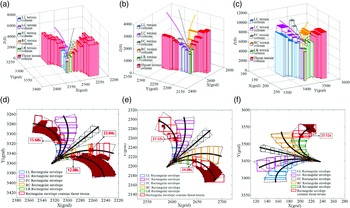
Threat terrain recognition and avoidance decision results in three cases under the lower limit load of level turning (1.2 g) are shown in Fig. 7. In addition to using rectangular envelope, the method in this paper also establishes the terrain scanning area of the predicted trajectory based on the navigation horizontal error, and establishes the judgement buffer area based on the height error (as shown in the area above the terrain column in Fig. 7). It can be seen that the proposed method can effectively reflect the forward terrain situation of the different avoidance trajectories, recognise the threat terrain, and predict the collision time.
4.2 Experiment 2: multi-trajectory risk assessment and decision
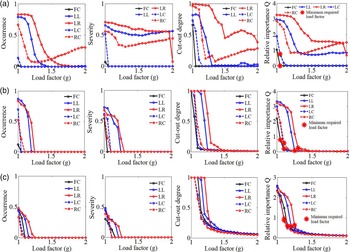
Within the load factor range, the risk assessment parameters under different load factors (the sampling numbers is 20, and the sampling step is 0.05 g) are shown in Fig. 8, and the minimum required load factor and the corresponding relative importance Q for each avoidance decision are shown in Table 3. The risk levels are arranged in ascending order (1 represents the highest priority) and compared with the traditional GCAS method, as shown in Table 4.
As can be seen from Fig. 8 and Table 3, the relative importance Q decreases with the increase of load factor. The lower limit of the relative importance Q can be calculated as 0 according to the ideal risk assessment parameters. When the avoidance trajectory is safe, continuing to increase the load factor has less effect on the Q. Compared with the traditional limit avoidance decision, our algorithm can provide the minimum required load factor. And it can be seen that the load factor required for climbing is less than that required for turning. Therefore, FC is generally preferred to avoid threatening terrain. In addition, for Case 1, even under the maximum load factor, LL, LR, and RC failed to safely avoid the threatening terrain, so the minimum required load factor is not provided.
Threat terrain recognition and avoidance decision results. (a) 3D terrain columns in Case 1. (b) 3D terrain columns in Case 2. (c) 3D terrain columns in Case 3. (d) Top view of the terrain scanning area in Case 1. (e) Top view of the terrain scanning area in Case 2. (f) Top view of the terrain scanning area in Case 3.

Lower required load factor and relative importance

Lower required load factor and relative importance

The risk assessment parameters of different load factors. (a) Case 1. (b) Case 2. (c) Case 3.

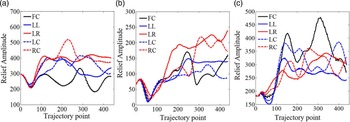
The traditional GCAS method adopts the idea of Last Man Standing and selects the trajectory with the longest collision prediction time as the best avoidance decision. However, it does not take into account the terrain conditions faced by the trajectory and the manoeuverability of the aircraft. On the basis of GCAS, our algorithm combines these two aspects into the avoidance decision. As can be seen from Table 5, the priority order of the traditional GCAS method and the method proposed in this paper is different in Case1 and Case 3, and same in Case 2. For further analysis, the terrain relief amplitude [Reference Chen and Zhao32] in the terrain scanning area is calculated, as shown in Fig. 9.
In Case1, the highest priority avoidance decision of both methods is the FC. Compared to the traditional method using the limit load factor of 2 g, the proposed method can give the minimum required load factor of 1.05 g, which enables the pilot to select the appropriate manoeuver to successfully avoid the threat terrain according to the aircraft performance. The main difference is LL and RC. The traditional method preferentially selects RC according to the predicted collision time, while the proposed method selects LL. As can be seen in Fig. 9(a), the terrain in the LL area is relatively flat, while the RC faces more dangerous terrain. Therefore, LL should be selected by considering the predicted collision time and terrain conditions.
In Case 3, the highest priority avoidance decision of the traditional method is FC, while the method in this paper is RC. From the minimum required load in Table 3, it can be seen that the minimum required load of RC is 1.15 g, and the minimum required load of FC is 1.20 g. In contrast, the load factor required by RC to safely avoid terrain is lower. The predicted collision time of FC and RC is long, and the difference is small. In addition, it can be seen from Fig. 8(c) that the terrain in RC is relatively flat. Therefore, choosing RC to avoid threat terrain has more advantages than FC.
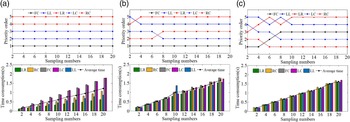
The average time consumption of different sampling numbers

The terrain relief amplitude of 5-TPA. (a) Case 1. (b) Case 2. (c) Case 3.

4.3 Experiment 3: time consumption test
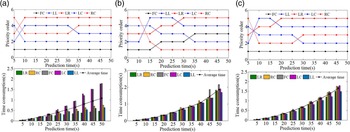
The time consumption of the proposed method is mainly affected by the prediction time and the sampling numbers. The longer prediction time can improve the terrain awareness for pilots, but the terrain data to be extracted will increase significantly. And the shorter prediction time cannot provide effective avoidance decisions. Although the larger the sampling numbers, the more accurate the minimum required load factor is calculated; too, larger sampling numbers will increase the number of cycle calculations. In order to test the real-time performance of the method in this paper, the time consumption and priority order results of different prediction time and sampling numbers are calculated, as shown in the Figs. 10 and 11. The statistical average time consumption is shown in Tables 5 and 6.
The average time consumption of different prediction time

Time consumption and priority order results of different sampling numbers. (a) Case 1. (b) Case 2. (c) Case 3.

Time consumption and priority order results of different prediction time. (a) Case 1. (b) Case 2. (c) Case 3.

As can be seen from Fig. 10 and Table 5, the smaller the sampling numbers, the shorter the time consumption. However, if the sampling numbers is too small, the priority result will be affected. When the sampling numbers is greater than 10, the priority result will remain unchanged. And as can be seen from Fig. 11 and Table 6, the shorter the prediction time, the shorter the time consumption. If the prediction time is too short, the threat terrain in front of the avoidance trajectory will not be in the scanning range, which will affect the results of the avoidance decision. When the prediction time is greater than 35 s, the priority results tend to be stable. Therefore, if the prediction time is 35 s and the sampling numbers is 10, the appropriate avoidance decision results can be given while ensuring real-time performance.
5.0 Conclusion
A ground collision avoidance system with multi-trajectory risk assessment and decision function is proposed to provide comprehensive avoidance decision for pilots. The algorithm mainly includes four parts: flight trajectory prediction, threat terrain recognition, collision detection, and multi-trajectory risk assessment and decision. The algorithm was tested and verified by using the actual digital terrain elevation map and simulated flight trajectory, and compared with the traditional GCAS method. In the threat terrain recognition module, the terrain contour extracted by the rectangular distance bins can reduce the interference warning. The added multi-trajectory risk assessment and decision module can comprehensively predict collision time, terrain conditions, and aircraft manoeuverability, and to give priority to the avoidance trajectories. Our method can provide safe and effective avoidance decision and minimum required overload factor.
Although the simulation experiment results verify the feasibility of our algorithm under a general aircraft model, in practical applications, the performance of the algorithm is subject to limitations and constraints imposed by factors such as aircraft type and trajectory model. Additionally, the algorithm in this paper only considers the influence of different load factors on avoidance decisions in aircraft performance. Apart from this, the roll angle range and the integrity of input data also affect avoidance decisions. Therefore, further research efforts will concentrate on enhancing the algorithm’s universality and balancing the impact of various manoeuvering factors as well as ensuring the integrity of input data.
Funding
This work was supported in part by the National Natural Science Foundation of China under Grant No. 42274037, the Aeronautical Science Foundation of China under Grant No. 2022Z022051001, the National key research and development program of China under Grant No. 2020YFB0505804.