NOMENCLATURE
Roman symbols
-
 $$\bar{a}$$
=
$$a{\plus}a^{'} $$
, Reynolds average of variable, a
-
$$\tilde{a}$$
=
$$a{\plus}a^{{''}} $$
, Favre average of variable, a
- a′, a″
fluctuating part in decomposition of a
- A
Arrhenius pre-exponential constant
- A edm
constant number one of the EDM
- B edm
constant number two of the EDM
- E
mixture total energy per unit mass (J/kg)
- H
mixture total enthalpy per unit mass (J/kg)
- I
turbulence intensity (%)
-
$$J_{{s_{j} }} $$
diffusion flux components of species s (kg/(m2 s))
- k
turbulent kinetic energy (J/kg)
- k f
forward reaction rate constant
- k r
reverse reaction rate constant
- M
Mach number
-
$$\dot{m}_{s} $$
mass flow rate (kg/s)
- Pr t
turbulent Prandtl number
- p
static pressure (Pa)
- p pitot
Pitot pressure (Pa)
- p ref
Reference total pressure (Pa)
- q j
heat flux components (W/m2)
- Sc t
turbulent Schmidt number
- s
mass stochiometric ratio
- T
static temperature (K)
- T A
Arrhenius activation temperature (K)
- T 0=T tot
total temperature (K)
- T ref
reference total temperature (K)
- t
time (s)
- u i
velocity components (m/s)
- W s
molar mass of species s (kg/mol)
- X s
molar fraction of species s
- [X s ]
molar concentration of species s (mol/m3)
- x j
cartesian co-ordinates (m)
- Y s
mass fraction of species s


Greek symbols
- β*
=0.09, turbulence model constant
- δ ij
kronecker delta: 0 (i≠j), 1 (i=j)
- Δy reac
reaction zone thickness
- ∈
dissipation of turbulent kinetic energy (m2/s3)
- η c
combustion efficiency
- μ t /μ
ratio of turbulent to laminar viscosity
-
$${\rm \rnu }_{m}^{'} $$
forward stochiometric coefficient
-
$${\rm \rnu }_{m}^{{''}} $$
reverse stochiometric coefficient
- ρ
mixture density (kg/m3)
-
$${\rm \bar{\rrho }}\widetilde{{u_{i}^{{''}} u_{j}^{{''}} }}$$
Reynolds stress tensor components (kg/(m s2))
- τ ij
molecular stress tensor components (kg/(m s2))
- ω
dissipation rate of turbulent kinetic energy (1/s)
-
$${{\bar{\dot{\romega}}}_{s}}$$
reaction rate of species s (kg/(m3 s))


Abbreviations
- AUSMDV
advection upstream splitting method combining difference and vector splitting
- BLS
boundary-layer section
- CFD
computational fluid dynamics
- DLR
German Aerospace Center
- EBU
eddy break up
- EDM
eddy dissipation model
- EFM
equilibrium flux method
- FRC
finite rate chemistry
- HEG
High Enthalphy Shock Tunnel Göttingen
- LES
large-eddy simulation
- MDO
multi-disciplinary design optimisation
- RANS
Reynolds-averaged Navier–Stokes
- SPARTAN
Scramjet Powered Accelerator for Reusable Technology AdvaNcement
- TCI
turbulence/chemistry interaction
- URANS
unsteady Reynolds-averaged Navier–Stokes
1.0 INTRODUCTION
Scramjet technology has been the subject of many studies since the late 1950s as it provides an efficient means of flying at hypersonic speeds. Potential applications include hypersonic cruise vehicles and access-to-space systems with hydrogen and hydrocarbon as potential fuels. For example, the Australian Scramjet Powered Accelerator for Reusable Technology AdvaNcement (SPARTAN) program aims at exploring the advantages of hydrogen-fuelled scramjets by designing a three-stage-to-orbit rocket–scramjet–rocket launch system with reusable first and second stages( Reference Preller and Smart 1 , Reference Forbes-Spyratos, Kearney, Smart and Jahn 2 ). As an accelerator for access-to-space, the high Mach regime (≈7–12) at which a scramjet will operate is characterised by a combustion process which can be considered to be mainly mixing limited( Reference Ferri 3 – Reference Landsberg, Wheatley and Veeraragavan 5 ). For design purposes, it is desirable to have a computational technique that can run effectively and efficiently account for turbulence–chemistry interaction (TCI) in the mixing-limited combustion process, and, subsequently, assess the overall combustor performance.
Numerical tools with different levels of fidelity are extensively used in the design of scramjets. Quasi-1D models have been developed which rely on simplified assumptions to describe the supersonic combustion process( Reference O’Brien, Starkey and Lewis 6 – Reference Vanyai, Bricalli, Brieschenk and Boyce 8 ). Being computationally cheap, such low-fidelity approaches are attractive for integration as a subsystem in a complete vehicle analysis as well as in Multi-disciplinary Design Optimisation (MDO). However, in some cases, these methods may not provide a sufficient level of accuracy or consistency with the physics when complex engine configurations are considered. Steps are being taken towards the improvement of the mixing and combustion models for such low-fidelity methods by introducing surrogates informed by more accurate computational fluid dynamics (CFD) approaches( Reference Torrez, Driscoll, Ihme and Fotia 9 ) capable of capturing the complex flow field inside scramjets and to account explicitly for the TCI mechanisms inside the combustor section of the engine. Chemically reactive Reynolds-Averaged Navier–Stokes (RANS) still remains the most used approach when targeting design( Reference Baurle 10 , Reference Georgiadis, Yoder, Vyas and Engblom 11 ). This is mainly related to its more manageable computational cost with respect to methods like large-eddy simulations (LES) or hybrid RANS/LES which can provide superior accuracy and insight into the detailed physics of the combustion mechanism but at a higher computational expense.
In the context of RANS-based approaches, the eddy dissipation model (EDM) introduced by Magnussen and Hjertager( Reference Magnussen and Hjertager 12 ) is a capable approach to address TCI for mixing-limited scramjets. The use of EDM in the modelling of hydrogen-fuelled scramjet flows has been reported in the literature by Edwards et al( Reference Edwards and Fulton 13 ) using the REACTMB CFD solver and it has also been largely documented in the case of commercially available software( Reference Mohieldin, Tiwari and Reubush 14 – Reference Kummitha, Pandey and Gupta 17 ). However, little information is found in the open literature about the optimal use of the EDM for scramjets with different types of fuel injection configurations or possible improvements of the model to increase its accuracy. The specification of the model parameters are not always communicated and no consistent guidelines are found regarding their setting. The EDM has as well been reported in the literature for hydrocarbon-fuelled scramjets and an overview can be found in Ref. 18. It is, however, not tackled in the present work and is left for future considerations.
The aim of the present work is to elaborate on the capability of the EDM in addressing supersonic mixing-limited combustion processes inside scramjets which rely on hydrogen fuel. The optimal use of the model is inferred for three specific scramjet combustors that conceptually represent the most relevant configurations based on different fuel injection schemes: parallel, strut and jet-in-crossflow. This is achieved by analysing the specification of model constants as well as alternatives to the standard EDM including a kinetic limit and zonal formulation.
The paper is structured as follows. In Section 2, the RANS equations for turbulent reacting flows are presented as well as the detailed formulation of the EDM. Section 3 describes the scramjet test cases used in this work followed by the results of the simulations. A critical discussion summarising the results is presented in Section 4. Final remarks and proposed future directions are reported in Section 5.
2.0 NUMERICAL MODELLING OF SCRAMJETS
The governing equations for turbulent compressible reacting flows can be written as
Mass conservation:
 $${{\partial {\rm \bar{\rrho }}} \over {\partial t}}{\plus}{\partial \over {\partial x_{i} }}\left( {{\rm \bar{\rrho }}\tilde{u}_{i} } \right){\equals}0$$
Momentum conservation:
 $${\partial \over {\partial t}}\left( {{\rm \bar{\rrho }}\tilde{u}_{i} } \right){\plus}{\partial \over {\partial x_{j} }}\left( {{\rm \bar{\rrho }}\tilde{u}_{j} \tilde{u}_{i} {\plus}{\rm \rdelta }_{{ij}} \bar{p}} \right){\equals}{\partial \over {\partial x_{j} }}\left( {{\rm \bar{\rtau }}_{{ji}} {\minus}{\rm \bar{\rrho }}\widetilde{{u_{i}^{{''}} u_{j}^{{''}} }}} \right)$$
Energy conservation:
 $${\partial \over {\partial t}}\left( {{\rm \bar{\rrho }}\tilde{E}} \right){\plus}{\partial \over {\partial x_{j} }}\left( {{\rm \bar{\rrho }}\tilde{u}_{j} \tilde{H}} \right){\equals}{\partial \over {\partial x_{j} }}\left( {{\rm \bar{\rtau }}_{{ij}} \tilde{u}_{i} {\plus}\overline{{{\rm \rtau }_{{ij}} u_{i}^{{''}} }} {\minus}\bar{q}_{j} {\minus}{\rm \bar{\rrho }}\widetilde{{H^{{''}} u_{j}^{{''}} }}} \right)$$
Species conservation:
 $${{\partial ({\rm \bar{\rrho }}\tilde{Y}_{s} )} \over {\partial t}}{\plus}{{\partial ({\rm \bar{\rrho }}\tilde{Y}_{s} \tilde{u}_{j} )} \over {\partial x_{j} }}{\equals} {{\bar{\dot{\romega}}}_{s}} {\minus}{\partial \over {\partial x_{j} }}\left( {\bar{J}_{{s_{j} }} {\plus}{\rm \bar{\rrho }}\widetilde{{Y_{s}^{{''}} u_{j}^{{''}} }}} \right)$$
with conserved variables
 $${\rm \bar{\rrho }}$$
,
 $${\rm \bar{\rrho }}\tilde{u}_{j} $$
,
 $${\rm \bar{\rrho }}\tilde{E}$$
,
 $${\rm \bar{\rrho }}\tilde{Y}_{s} $$
representing density, momentum, total energy per unit volume and partial densities of the species s (s=1,…,N), respectively. Throughout this work, the above set of equations will be referred to as the Reynolds Averaged Navier–Stokes (RANS) equations. The symbols
 $$\bar{x}$$
and
 $$\tilde{x}$$
denote, respectively, the time and the Favre (or density-weighted) average. Equations (1)–(4) are written in such a way that those terms which require modelling are indicated on the right-hand side. The system of conservation equations for a turbulent chemically reacting flow needs extensive modelling. A comprehensive overview of the modelling practice for supersonic internal flows can be found in the work of Baurle(
Reference Baurle
10
). The present work will only address the treatment of the mean species reaction rates
 $${{\bar{\dot{\romega}}}_{s}}$$
.
In this work, the RANS equations are solved with the Eilmer(
Reference Gollan and Jacobs
19
) open-source CFD package, developed at the University of Queensland. The finite volume solver with explicit time stepping addresses turbulence closure by means of Wilcox’s 2006 k−ω model(
Reference Wilcox
20
) and has been previously validated with Eilmer for scramjet type flows(
Reference Chan, Jacobs and Mee
21
–
Reference Hoste, Fossati, Taylor and Gollan
23
), demonstrating similar predictive capability to the more widely adopted k−ω SST model. Shock capturing is ensured by treating the inviscid fluxes with an adaptive method switching between Macrossan’s Equilibrium Flux Method (EFM)(
Reference Macrossan
24
) and Liou and Wada’s Advection Upstream Splitting Method combining Difference and Vector splitting (AUSMDV)(
Reference Liou
25
). With its more diffusive character, the former is active in regions with strong velocity gradients while the latter is used elsewhere. Viscous fluxes are treated by Gauss’ theorem and the forward Euler scheme or a predictor–corrector scheme (Heun’s method) is used for time integration. Unless otherwise stated the former is selected for time integration as well as the adaptive flux treatment. Eilmer(
Reference Jacobs, Gollan, Denman, O’Flaherty, Potter, Petrie-Repar and Johnston
26
) adopts temperature-dependent species heat capacities and energies that are evaluated with the polynomial curve fits of McBride and Gordon(
Reference Gordon and McBride
27
). An important modelling issue in high-speed turbulent reacting flows is the chemical source term (
 $${{\bar{\dot{\romega}}}_{s}}$$
) which is highly non-linear and cannot be directly related to mean flow properties. It is the role of the TCI model to specify this source term. In the following subsection, the assumptions of the EDM are introduced followed by the expression for (
 $${{\bar{\dot{\romega}}}_{s}}$$
). Thereafter, the limitations of the model are outlined.
2.1 Physical interpretation of the EDM
The EDM was introduced by Magnussen and Hjertager( Reference Magnussen and Hjertager 12 , Reference Poinsot and Veynante 28 ). It assumes that fuel and oxidiser are carried by separate eddies in diffusion flames. Furthermore, chemical reactions are fast so that fuel and oxidiser will react as soon as they mix on a molecular scale. Assuming this fast chemistry limit in the EDM, the rate at which reactions occur is then dependent on the rate at which turbulent eddies carrying fuel and oxidiser are brought together. In other words, the mean reaction rate is mainly controlled by the turbulent mixing time. On a dimensional basis, this mixing time is estimated from the integral length scales by using the turbulence model parameters which describe the energy cascade process in turbulent flows. Consequently, the mixing on a molecular level is dependent on the rate at which the eddies dissipate. The model is sometimes referred to as ‘mixed-is-burned’ which highlights the idea that once fuel and oxidiser is mixed, it burns immediately (fast chemistry).
2.2 Implementation of the EDM
The EDM is implemented by assuming a single-step irreversible reaction of the form
 $$\rnu _{{\rm F}}^{'} F{\plus}\rnu _{{\rm O}}^{'} O\to\rnu _{{\rm P}}^{{''}} P$$
, where ν
s
are the stoichiometric coefficients of Fuel (F), Oxidiser (O) and Products (P). Such a form is consistent with the model’s physical description of fast chemical reactions. It must be noted that the model is limited to scramjet configuration where the chemical time scales are much smaller with respect to the turbulent time scales and is believed to be the case at high Mach regimes. Several CFD studies of generic scramjet combustors, representative for high flight Mach numbers (>8), documented in the literature, indicate that chemical time scales are smaller than turbulent times scales for the majority of the domain. Locally, such as near the injection, chemical time scales can be of the same order of magnitude as the turbulence time scales(
Reference Urzay
29
), i.e. chemical kinetics are important. Depending on the turbulent mixing (injection configuration), the extent of the kinetically dominated region can be limited. The use of a single-step irreversible reaction instead of a reaction mechanism reduces the computational cost and makes it useful for design. In the case of hydrogen combustion, the reaction is
 $$2{\rm H}_{2} {\plus}{\rm O}_{2} \to2{\rm H}_{2} {\rm O}$$
N 2 acts as an inert species, resulting in four species conservation equations (Equation (4)). In EDM, the reaction rate of fuel is defined as
 $${{\bar{\dot{\romega}}}_{F}} {\equals}{\minus}A_{{{\rm edm}}} \,{\rm \bar{\rrho }\rbeta }^{{\asterisk}} \,{\rm \romega }\,{\rm min}\left[ {\tilde{Y}_{{\rm F}} ,{{\tilde{Y}_{{\rm O}} } \over s},B_{{{\rm edm}}} {{\tilde{Y}_{{\rm P}} } \over {s{\plus}1}}} \right] $$
The oxidiser destruction and product production rates can then be obtained as
 $${{\bar{\dot{\romega}}}_{\rm O}} {\equals}s{{\bar{\dot{\romega}}}_{\rm F}} ,\quad {{\bar{\dot{\romega}}}_{\rm P}} {\equals}{\minus}(s{\plus}1){{\bar{\dot{\romega}}}_{\rm F}} $$
In the above equation, s is the mass stoichiometric ratio defined as
 $$s{\equals}({\rm \rnu }_{{\rm O}}^{'} W_{{\rm O}} )\,/\,({\rm \rnu }_{{\rm F}}^{'} W_{{\rm F}} )$$
and equals 8 for H2–air combustion(
Reference Poinsot and Veynante
28
), W
s
is the molar mass in kg/mol and
 $$\tilde{Y}_{s} $$
is the mass fraction. In Equation (6), β* is a turbulence model constant with a value of 0.09 and ω (1/s) is the specific dissipation of turbulent kinetic energy obtained through the turbulence model. The underlying physical assumption regarding the dissipation of turbulent eddies in the model is accounted for through ω. In summary, the mean fuel reaction rate of EDM,
 $${{\bar{\dot{\romega}}}_{\rm F}} ({\rm kg/(m}^{3} \,{\rm s}))$$
, is a function of turbulence (ω), and the mass fractions of fuel (
 $$\tilde{Y}_{{\rm F}} $$
), oxidiser (
 $$\tilde{Y}_{{\rm O}} $$
) and products (
 $$\tilde{Y}_{{\rm P}} $$
) in every cell of the domain.
2.3 Specification of the model constants
Equation (6) requires the specification of two model constants, namely A edm and B edm. In their original work, Magnussen and Hjertager( Reference Magnussen and Hjertager 12 ) demonstrate the EDM’s use on a series of premixed and diffusion flames at low-speed in conjunction with the k−ε turbulence model. A setting of A edm=4.0 and B edm=0.5 resulted in satisfactory agreement with experimental data (mean temperature, mean composition, mean velocity) for six different test cases. In the literature, the latter setting for the model constants is, therefore, adopted as the default when using the EDM.
The aforementioned standard setting for the modelling constants might not be the most appropriate for scramjet flow fields. With regard to A edm for instance, Edwards et al( Reference Edwards and Fulton 13 ) suggest a value between 1 and 4. The physical effect of increasing (decreasing) this constant’s value is the promotion (reduction) of the turbulent eddy dissipation process in the flow field which, where available, brings fuel and oxidiser together on a molecular level.
The last term in the minimum evaluation of Equation (6) is intended to account for the effect of hot (or cold) products in a premixed turbulent flame situation where both fuel and oxidiser are contained within the same eddies(
Reference Magnussen and Hjertager
12
). The importance of the products on the combustion process can be controlled through the parameter B
edm. An increase in the value of B
edm will promote the reaction between fuel and oxidiser as more hot products are present to ignite the premixed mixture. The inclusion of the product term implies that, for reactions to occur, an initial product mass fraction is required and is usually taken as
 $$\tilde{Y}_{{{\rm P,initial}}} $$
=0.01. In a scramjet, fuel and oxidiser are injected through different inflows and thus carried by separate eddies which gives rise to a non-premixed combustion process. For this reason, the product term is commonly omitted in their simulation. The present work does, therefore, not consider the
 $$\tilde{Y}_{{\rm P}} $$
term in Equation (6).
2.4 Limiting the reaction rate within EDM
The EDM does not include any effect of finite-rate chemical kinetics. Equation (6) does not account for the temperature on the formation of products. Consequently, the EDM has a tendency to over-predict the fuel consumption as well as peak temperatures. The way to mitigate these disadvantages is by limiting
 $${{\bar{\dot{\romega}}}_{\rm F}} $$
with a kinetic reaction rate. This can be done by use of the reaction rate obtained with the Arrhenius approach (law of mass action) and a single step global reaction(
Reference Baurle
10
)
 $${{\bar{\dot{\romega}}}_{{\rm F}} {\equals}{\rm min}({{\bar{\dot{\romega}}}_{{{\rm F},{\rm edm}}} ,{{\bar{\dot{\romega}}}_{{{\rm F},{\rm lam}}} )$$
where
 $${{\bar{\dot{\romega}}}_{{{\rm F},{\rm lam}}} $$
is given by
 $${{\bar{\dot{\romega}}}_{{{\rm F},{\rm lam}}} {\equals}{\minus}{\rm \rnu }_{{\rm F}}^{{\rm '}} W_{{\rm F}} \left( {k_{f} [X_{{\rm F}} ]^{{{\rm \rnu }_{{\rm F}}^{{\rm '}} }} [X_{{\rm O}} ]^{{{\rm \rnu }_{{\rm O}}^{{\rm '}} }} {\minus}k_{r} [X_{{\rm P}} ]^{{{\rm \rnu }_{{\rm P}}^{{\rm '}} }} } \right)$$
[X s ] is the molar concentration in this definition. The kinetic limit allows the extension of the EDM’s applicability to test cases where the combustion is not purely mixing limited but where ignition delay effects are present. However, the trade-off is the introduction of two reaction rate parameters which are not universally defined: the forward reaction rate k f and the backward or reverse reaction rate k r . The former is obtained with Arrhenius law by defining a pre-exponential constant A and an activation temperature T A. Several options are available in the open-literature for the Arrhenius law constants and this work adopts the values A=1.1e19 and T A=8052 K as proposed by Chandra Murty and Chakraborty( Reference Chandra Murty and Chakraborty 15 ). These values have been obtained for hydrogen combustion by requiring that the flame speed of the single-step kinetics match with those from full chemistry as pointed out by Sekar and Mukunda( Reference Sekar and Mukunda 30 ). The k r is obtained from the forward rate and equilibrium constant. The use of Equation (8) will be referred to as ‘EDM with kinetic limit’. As pointed out by Baurle( Reference Baurle 10 ), the use of EDM alleviates the stiffness of the governing equations as turbulent time scales are driving the reactions.
In the case of non-premixed scramjet flow path simulations with EDM, on top of the model constant A edm, values for turbulent Prandtl (Pr t ) and Schmidt number (Sc t ) have to be specified. Including the possibility to limit reaction rates with a kinetic limit, this leaves the user to specify a combination of 3 (or 4) parameters per simulation. Details about the settings and effect of parameter values choices are presented in the following sections.
3.0 TEST CASES
Three generic scramjet combustor geometries are selected to study the application of the EDM, each with a different fuel injection arrangement. The aim is to better understand the choice of the modelling constant A edm. Another aspect of the present investigation is to explore if improvements in the use of the EDM are possible. As the authors’ future intent is the use of the EDM in the preliminary design context of scramjet combustors, quantities such as combustion efficiency, total pressure loss and thrust potential( Reference Hoste 18 , Reference Drozda, Baurle and Drummond 31 ) would be of interest. The latter performance measures are not directly acquired from experimental campaigns. They are, however, dependent on other quantities which are experimentally obtained such as velocity, temperature, composition and (total) pressure. These experimental quantities are considered in the present work in order to validate the EDM.
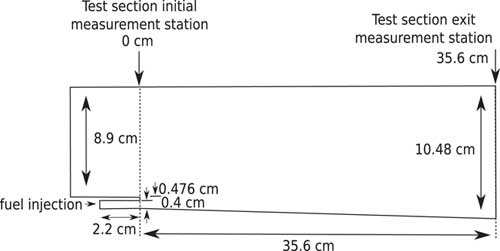
The first test case is the experiment of Burrows and Kurkov( Reference Burrows and Kurkov 32 , Reference Burrows and Kurkov 33 ) (Fig. 1) where hydrogen is injected parallel to a vitiated air-stream behind a backward facing step. The experimental design results in high combustor entrance Mach number (>2) and static temperature (>1000 K), typical for high flight Mach numbers (>8). A mixing layer is generated close to the injection and a runaway length is observed where the fuel and oxidiser mix before igniting. Whilst the ignition delay is kinetically controlled, it will be demonstrated that once the flow ignites the combustion is mixing limited.
Schematic of the Burrows–Kurkov supersonic combustion experiment( Reference Burrows and Kurkov 32 ). Not to scale.

The second test case is the DLR combustor experiment of Waidmann et al( Reference Waidmann, Alff, Brummund, Böhm, Clauss and Oschwald 34 ) (Fig. 11). In this case, hydrogen is injected behind a strut. The physics inside the combustor is dominated by a pattern of shock waves interacting amongst themselves and with shear layers. Turbulence modelling will play a crucial role in capturing the mixing layers and recirculation regions generated behind the strut. These physical features are, in turn, key in controlling the behavior of the flame held behind the strut and the transport of the species along the combustor. A Mach 2 vitiated air stream is supplied to the test chamber with cold temperature (<1000 K) due to limitations of the facility. Most of the studies reported in the literature on this configuration adopt a TCI which assumes that turbulent time scales are larger than chemical time scales. Waidmann et al( Reference Waidmann, Alff, Brummund, Böhm, Clauss and Oschwald 34 ) identified the combustion mode to be situated in the flamelet regime. This an indication that, in spite of the cold vitiated air stream conditions, the combustion process is primarily mixing limited. The flamelet and EDM commonly rely on the assumption that chemical time scales are smaller than mixing time scales. The DLR combustor is, therefore, adequate for the study of the EDM in this work.
The third test case is the HyShot II combustor( Reference Karl, Hannemann, Mack and Steelant 35 , Reference Karl 36 ), ground tested at DLR, where the fuel is injected perpendicular to the incoming flow inside the constant area combustor. Similar to the experiment of Burrows and Kurkov, the entrance Mach number (>2) and static temperature (>1000 K) are representative of a high flight Mach number (>8). It was demonstrated in several RANS studies( Reference Karl 36 , Reference Pecnik, Terrapon, Ham, Iaccarino and Pitsch 37 ) that the combustion is primarily mixing limited. Moreover, the same comment was made by Larsson et al( Reference Larsson, Laurence, Bermejo-Moreno, Bodart, Karl and Vicquelin 38 ) in their numerical study of the combustor with LES. The HyShot II combustor is, therefore, a suitable candidate for study with the EDM. The selected test cases are characterised by different physical features which is suitable for assessing a model’s predictive capability over a broader range of supersonic combustion phenomena.
Unit Lewis number is assumed for each species throughout this work and in the case of viscous walls without wall functions, the value of ω is set according to Menter’s suggestion for smooth walls( Reference Menter 39 ). A CFL value of 0.5 is adopted for time integration using the Euler or predictor–corrector scheme. Simulations are converged to a steady state and convergence is monitored through point probes of velocity, density, temperature and pressure at different locations in the computational domains.
3.1 Case 1: Burrows–Kurkov
A commonly used test case in CFD code validation studies for supersonic combustion is the experiment of Burrows and Kurkov( Reference Burrows and Kurkov 32 , Reference Burrows and Kurkov 33 ) (BK) shown in Fig. 1 for which an extensive set of comparison data in pure mixing and reacting conditions is available. Many authors have performed RANS studies of the geometry over the last three decades( Reference Evans and Schexnayder 40 – Reference Gao, Jiang, Pan and Lee 46 ). The test case is known( Reference Parent and Sislian 42 , Reference Engblom, Frate and Nelson 43 ) to be very sensitive to the the values of turbulent Prandtl (Pr t ) and Schmidt (Sc t ) numbers. During a sensitivity study for the Wilcox k−ω 2006 model, it was observed that the combinations Pr t =0.9, Sc t =0.5 and Pr t =0.5, Sc t =0.5 gave very similar results in comparison with the experimental data at the exit of the combustor. The value of Pr t has a significant influence when temperature gradients are high (energy conservation equation), which is mainly the case at the interface between the fuel and vitiated air-stream, hence the limited influence observed in the Burrows–Kurkov configuration. In this study, Pr t and Sc t were varied between 0.3 and 0.9( Reference Hoste 18 ), repsectively. Simulations with the combination Pr t =0.5 and Sc t =0.5 are presented here. For design purposes, exit properties are used to determine overall engine performance (e.g. combustion efficiency, thrust potential, total pressure loss). The results at the exit location are, therefore, useful to indicate the usefulness of the model for design analysis.
3.1.1 Problem formulation
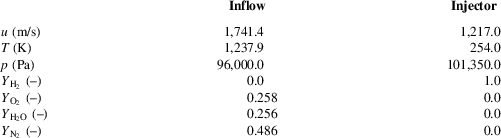
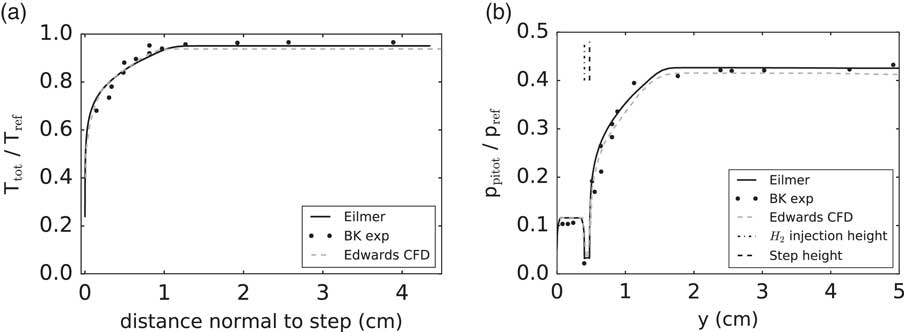
The experimental setup in Fig. 1 has been simulated in two stages. This approach was selected in order to considerably reduce the computational cost. The first stage has only to be simulated once as it is not affected by the downstream combustion process. In the first stage, a boundary-layer section (BLS) of 65 cm is considered using the same vitiated air supersonic inflow conditions as Edwards et al( Reference Edwards, Boles and Baurle 47 ) listed in Table 1. Note that these values differ from the ones typically encountered in the literature; however, Edwards et al( Reference Edwards, Boles and Baurle 47 ) demonstrated a good agreement with experiments in their work, i.e. the peak in total temperature and associated production of H2O at the combustor exit plane was located similarly to experimental observations. Values for turbulence intensity (I) and the ratio of turbulent to laminar viscosity (μ t /μ) are set to 5% and 10, respectively. The exit profile of the first stage is used as an inflow condition for the second stage which considered the geometry depicted in Fig. 1 with a BLS of 2 cm. The injector is simulated as a constant area channel of 2.2 cm with conditions in Table 1. Turbulence boundary conditions for the injector are the same as for the separate BLS simulations. Walls are treated as isothermal at a temperature of 300 K. A supersonic outflow is prescribed where values from the interior of the domain are extrapolated. The simulation results in terms of profiles of total temperature and Pitot pressure are depicted in Fig. 2. The profiles are compared to the experimental data collected at the first section (x=0 cm) as well as to the CFD of Edwards et al( Reference Edwards, Boles and Baurle 47 ) obtained with a hybrid RANS/LES approach. An overall satisfactory prediction of the inflow conditions is observed with a boundary-layer thickness at the entrance of the combustor around 1 cm.
Inflow and injector flow conditions for Burrow–Kurkov’ experiment

Vitiated air flow total temperature (a) and Pitot pressure (b) at the entrance of the combustor. T ref=2380 K, p ref=17.1e5 Pa

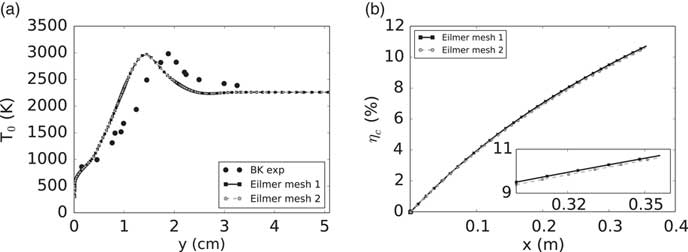
For the second-stage calculation, a mesh independence study has been performed with structured grids containing 129,987 (mesh 1) and 185,920 (mesh 2) cells. In both cases, the maximum first cell distance to physical walls was below 5e−6 m. The EDM with setting A edm=4 was adopted. The result of the mesh refinement study on the total temperature (T 0) at the exit of the combustor (x=35.6 cm) is shown in Fig. 3. The horizontal axis represents the distance from the lower wall. No visible differences in predictions are observed indicating mesh independent results. The same is valid for the combustion efficiency along the combustor. This paramater has been computed according to Kim et al( Reference Kim, Yoon, Jeung, Huh and Choi 48 ) as
 $${\rm \reta }_{c} (x){\equals}1{\minus}{{{\int} {\rm \rrho }uY_{{\rm F}} {\rm d}A} \over {({\int} {\rm \rrho }uY_{{\rm F}} {\rm d}A)_{{x{\equals}0}} }}{\equals}1{\minus}{{\dot{m}_{{\rm F}} } \over {(\dot{m}_{{\rm F}} )_{{x{\equals}0}} }}$$
Predictions of total temperature at x=35.6 cm (a) and combustion efficiency (b) obtained with different mesh sizes.

Equation (10) evaluates the mass flow rate of fuel (
 $$\dot{m}_{{\rm F}} $$
) across a plane at any position with respect to the injected amount. The profiles of η
c
obtained by both meshes are very similar (<6 K for T
0 and <0.1% for η
c
) and a mesh independent result is achieved. In the following discussion, the finer mesh is considered.
3.1.2 Results
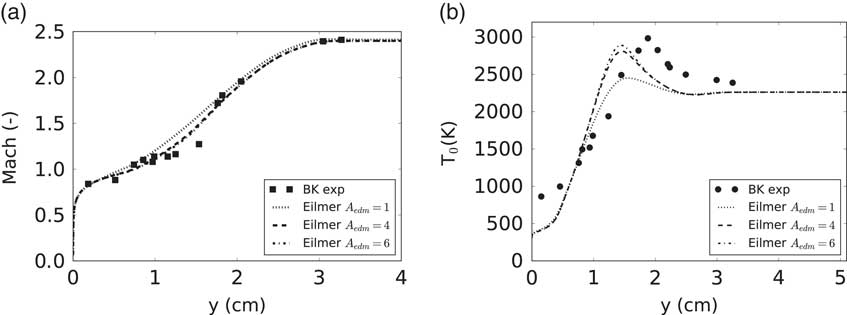
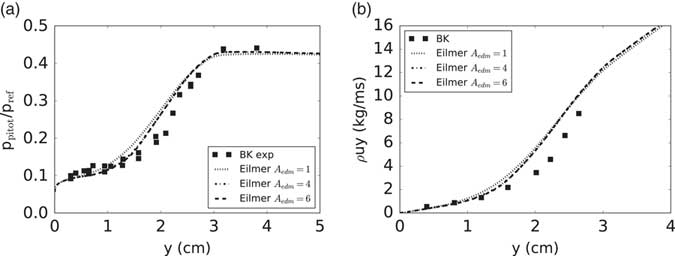
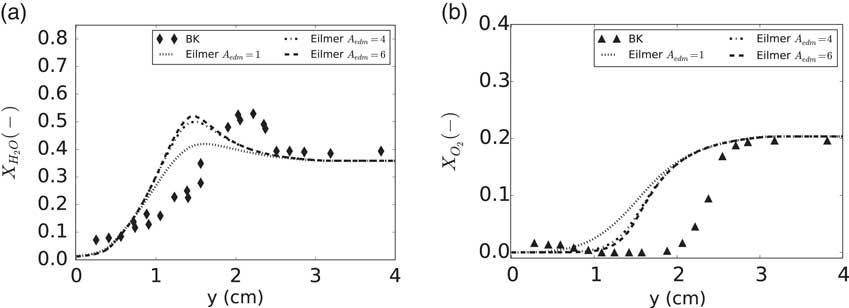
The influence of the A edm parameter is assessed through comparison with the available experimental data measured at the exit plane (x=35.6 cm) in Figs 4–6 for Mach number, total temperature, Pitot pressure, mass flow rate and composition. The horizontal axis represents the vertical distance from the lower wall. Simulations have been performed with several values of the A edm. No kinetic limit has been used in these results. It will be shown hereafter that it did not influence the different profiles at the exit of the test section.
Predictions of Mach (a) and total temperature (b) at x=35.6 cm obtained with EDM compared with experimental values of Burrows and Kurkov.

Predictions of Pitot pressure (a) and mass flow (b) at x=35.6 cm obtained with EDM compared with experimental values of Burrows and Kurkov. Pref=17.1e5 Pa

Predictions of H2O (a) and O2 (b) mole fraction at x=35.6 cm obtained with EDM compared with experimental values of Burrows and Kurkov.

The effect of varying A edm is observed in the profile of total temperature (T 0) in Fig. 4. A higher peak temperature corresponds to a higher A edm. This behavior is a direct consequence of the model (Equation (6)) as more products are allowed to form which in turn increases mean temperature. A value of six results in a peak value of T 0 comparable to experiments; however, its location is closer to the lower wall by ≈0.44 cm (4.2% of the exit height). An increase of A edm above its standard value of 4 does not demonstrate drastic changes which suggests the presence of an asymptotic limit. This is explained by the scarce presence of reactants available for reaction at that location (Fig. 6(b), y ≈1.5 cm). Experimentally, this situation occurs further away from the wall. Adopting a lower value of the model constant (A edm=1) results in a consistent under-prediction of the peak total temperature. Regarding the profiles of Mach number (Fig. 4(a)), a higher A edm setting is in better agreement with the experimental data. Overall a good match with experiment is observed for Mach number. Figure 5, showing Pitot pressure (p pitot) and mass flow, confirms the need for a higher value of the EDM constant in order to get an improved agreement with experiments. The influence is, however, contained to the region closer to the wall (y<2 cm).
Figure 6 shows the exit profiles of species mole fractions of H2O and O2. The observations on the effect of A
edm on the H2O mole fraction are in agreement with the total temperature curves discussed previously. A higher A
edm setting predicts peak values comparable to experiment but an offset in peak position is present. The different EDM results under-predict the penetration depth of hydrogen into the vitiated airflow. The
 $$X_{{{\rm O}_{2} }} $$
profiles show that the experimental slope is better captured by a higher value of the EDM constant.
Overall, the best results with EDM are obtained by prescribing A
edm=6. With the latter setting, a relative error in peak total temperature and peak product mole fraction of, respectively, 3.5% and 4.1% is observed. The standard value for the same model constant results in relative errors of 6.2% and 7.6% for these peak quantities. The explanation for this result can be understood by studying the contour of product mass fraction
 $$Y_{{\rm P}} {\equals}Y_{{{\rm H}_{2} {\rm O}}} $$
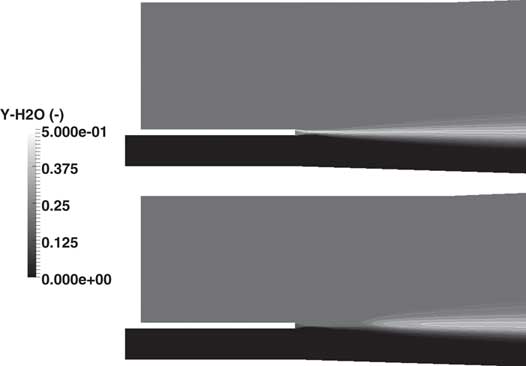
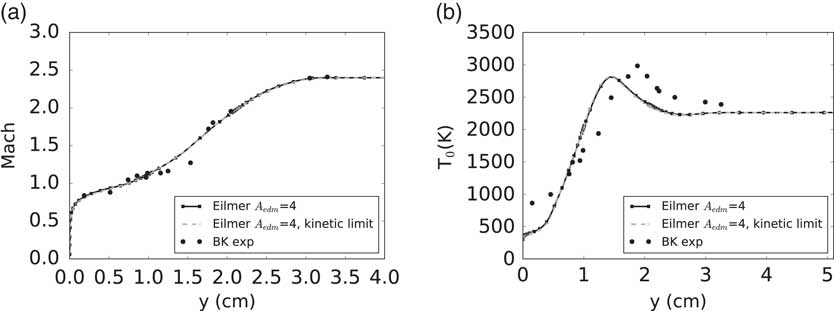
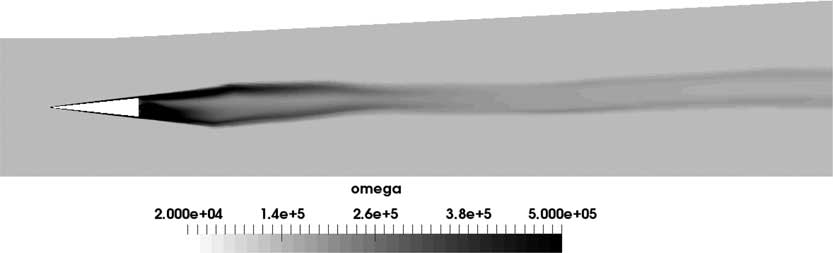
(or mean temperature) and ω. Figure 7 shows the product mass fraction contour predicted by the EDM (upper representation). The top contour is in accordance with what would be obtained with a single-step reaction (see Ref. 49) except for the fact that combustion occurs very close to the injection point. The latter behavior of not predicting any ignition delay is unphysical. It is, however, expected as the EDM allows products to be formed as soon as fuel and oxidiser mix. Introducing the kinetic limit (Equation (8) mitigates this effect as can be seen in the bottom contour. It was mentioned earlier that applying this limit does not affect the CFD predictions at the exit of the combustor. This statement is confirmed by observing the profiles of Mach number and total temperature in Fig. 8. The same observations are valid for the other quantities and are, therefore, not shown in this work. The kinetic limit only affects a very small region near the injector and the length of the combustor is long enough to allow the EDM to compensate this localised effect near the injector. That is, downstream the point of fuel injection the combustion products that could not be formed earlier will rapidly form. The minimal influence of the kinetic limit is explained by the high vitiated air-stream temperature. In the experiments, ignition onset is indicated by a rise in wall static pressure 18 cm downstream of the injection point(
Reference Burrows and Kurkov
33
). With the kinetic limit, this occurs at ≈1 cm downstream of the injection point.
Mass fraction contours of H2O close to the injection point with from top to bottom: EDM and EDM with kinetic limit.

Comparison of EDM with and without kinetic limit on Mach (a) and total temperature (b) at the exit of the combustor (x=35.6 cm).

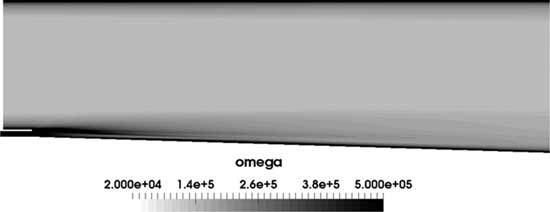
The EDM assumes that a higher mixing rate is characterised by a higher value of ω. This assumption is not valid near the injector where no combustion takes place but where very high values of ω are predicted by the turbulence model in Fig. 9. Note that high values of ω are relative to the rest of the flow field. In the shear layer near the backward facing step, ω is an order of magnitude larger than at the fuel/oxidiser interface near the exit of the combustor. Moving further away from the injection point, a decrease in ω is observed in Fig. 9 which is coupled to a decay in the strength of the turbulence inside the combustor. The high local values in the shear layer near the injector causes an early product formation. In reality, the combustion should start after some ignition delay. The location for ignition onset is downstream of the injection point where the value of ω decreases. Consequently, an increase in the A edm constant is required as compensation. Values higher than 6 have no strong influence as there are not enough reactants at stochiometric ratio left to burn at the interface between the fuel stream and the vitiated air stream.
Contour of ω for the experiment of Burrows and Kurkov.

Ignition delay with zonal EDM
Figure 7 demonstrates that the kinetic limit is perhaps not the most adequate way of introducing an ignition delay in a shear layer environment with high free stream temperature. Its effect is minimal and is far from representative of what is experimentally observed. Moreover, the combustion induced shock wave, reported by Bhagwanding et al( Reference Bhagwandin, Engblom and Georgiadis 49 ), is not predicted by the EDM. The reference work of Burrow and Kurkov( Reference Burrows and Kurkov 32 ) mentions that it is possible to rely on a 1D kinetics program to obtain an estimate of the expected ignition delay. Such an approach can be very beneficial for the use of the EDM, which lacks the ability to account for ignition delay in a parallel injection setting with high free stream temperatures (above autoignition temperature of hydrogen), as shown here. Based on a free stream temperature of 1270 K, an H2/O2 ratio of 0.013 and a free stream mixture containing N2, O2, H2O and NO, an induction time (or ignition delay or runaway length) of 90e−6 s was obtained( Reference Burrows and Kurkov 32 ) with the one-dimensional kinetics program developed by Bittker and Scullin( Reference Bittker and Scullin 50 ). Using an averaged vitiated air stream velocity at the entrance of the combustor of 1689 m/s (obtained from CFD), a flow residence time equal to 2.1e−4 s is obtained. From the averaged velocity value and the previously calculated induction time, the ignition location inside the combustor is estimated to be at x=0.153 m. Note that this approach only gives a rough estimate of the induction process. It does not, for example, account for the low fuel stream temperature near the wall which can have a significant influence as indicated by Burrows and Kurkov( Reference Burrows and Kurkov 32 ). Nevertheless, this information can be relied on for a better use of the EDM.
A simulation has been performed relying on the above ignition delay estimate where no combustion is allowed at any axial location before that point, hence the terminology ‘zone’. Recall that, experimentally( Reference Burrows and Kurkov 33 ), an ignition delay is observed between 18 cm (wall pressure trace) and 25 cm (photographs of OH radiation). Numerical predictions have also been obtained with finite-rate chemistry simulations (no TCI) relying on the seven species, eight reactions mechanism of Evans–Schexnayder (E–S)( Reference Evans and Schexnayder 40 ) with modified third-body efficiencies in accordance with Bhagwandin et al( Reference Bhagwandin, Engblom and Georgiadis 49 ). The finite rate chemistry (FRC) simulation predicted an onset of ignition at a position of 23 cm. This value is located between the experimentally observed interval mentioned previously showing that the chemical kinetics are well reproduced by the selected reaction mechanism.
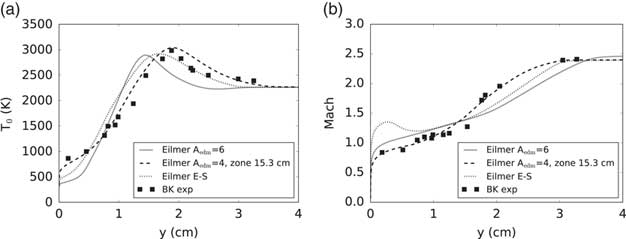
Figure 10 compares the different approaches (EDM, EDM-zonal, FRC) with experimental values of Mach number and total temperature (T 0) at the combustor exit. The classical EDM is shown for a constant value A edm=6 following the parametric study discussed previously. The profiles of T 0 show that the use of the EDM can be greatly improved with an estimate of ignition onset. A good agreement with experimental T 0 values are observed near the wall with the zonal use of the EDM. The relative error with respect to the experiment is ≈1.5% for the peak value and ≈1.1% for the peak location in Fig. 10(a). The FRC (E–S) predictions result in relative errors of ≈2.0% and ≈13.2% for, respectively, the peak T 0 value and location. These quantities are ≈3.5% and ≈23.8% for the classic EDM. Therefore, the FRC does perform better than the classic EDM but slightly less than the zonal EDM. This is explained by the fact that the combustion process is kinetically limited until the onset of ignition whereafter it becomes mixing-limited. The same observation was made by Kirchhartz et al( Reference Kirchhartz, Mee, Stalker, Jacobs and Smart 51 ) in an axisymmetric scramjet combustor with similar fuel injection mechanism. The EDM assumes a mixing limited combustion and is, therefore, more appropriate once the flow is ignited. In terms of the Mach number profile (Fig. 10(b)), a lesser agreement with experimental data is observed for the EDM with ignition estimate compared to the curve without. Nevertheless, it remains superior to the FRC CFD prediction in the vicinity of the wall (y<1 cm). The observations for the profiles of Pitot pressure are similar to the Mach number and the composition profiles are in close agreement with the curves for T 0. They are, therefore, not shown here.
Comparison of EDM with and without zone on total temperature (a) and Mach number (b) at the exit of the combustor (x=35.6 cm).

In conclusion, even though the estimated induction length from the 1D program does not agree with experimental observationsFootnote 1 , it proves to be very useful information for an improved use of the EDM. The zonal EDM provides improved results in T 0, Mach number, Pitot pressure and composition profiles with respect to the classic EDM. It is, therefore, a viable approach for study of similar scramjet configurations.
3.2 Case 2: DLR combustor
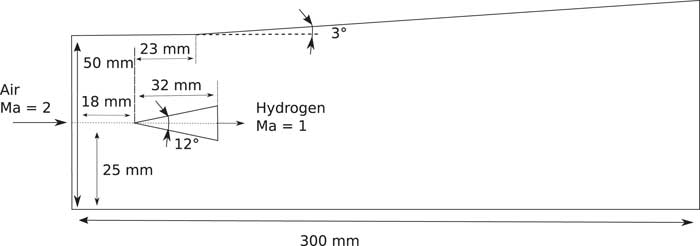
The DLR combustor experiment of Waidmann et al( Reference Waidmann, Alff, Brummund, Böhm, Clauss and Oschwald 34 ) is depicted in Fig. 11. Similar to the Burrows–Kurkov experiment, measurements have been taken in both a pure mixing and a combusting setting. The main geometry is notionally 2D; however, the use of porthole injectors on the rear of the strut sets up an inherently 3D flow field. Several 2- and 3D RANS studies of this combustor test case can be found in the literature( Reference Dharavath, Manna and Chakraborty 16 , Reference Oevermann 52 – Reference Kummitha 56 ) where each author introduces a TCI model. In spite of the three-dimensionality of the configuration, 2D studies are useful as a proof of concept for modelling techniques. Oevermann( Reference Oevermann 52 ) and Mura et al( Reference Mura and Izard 53 ) obtained reasonable results in their 2D studies. Following this approach, the present work considers the application of EDM on a 2D domain with single slot injector. It is expected that the 2D assumption will introduce a certain degree of error when making direct comparison to experiment. However, Gao et al( Reference Gao, Wang, Jiang and Lee 54 ) demonstrated little differences (≈50 K) in axial temperature profiles between 2D- and 3D simulations adopting a flamelet combustion model. Three-dimensional simulations of the present setup have to be considered for future work in order to quantify the errors introduced by a 2D assumption.
Schematic of the DLR combustor experiment( Reference Waidmann, Alff, Brummund, Böhm, Clauss and Oschwald 34 ). Not to scale.

3.2.1 Problem formulation
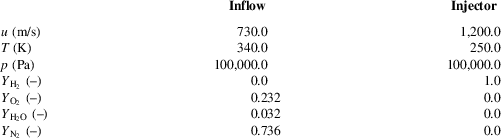
A structured grid was generated for the domain shown in Fig. 11. The distance between the supersonic inlet, with conditions given in Table 2, and the start of the strut is 18 mm and the total combustor length is 300 mm. Upper and lower walls are treated as inviscid which is an acceptable choice given the distant location with respect to the reaction zone. The strut walls are defined as adiabatic and a supersonic outflow is assumed. Given the relatively low stream temperatures in the combustor and the location of the reaction zone further downstream of the strut, the heat transfer to the strut walls is expected to be small supporting the adiabatic wall boundary condition setting. Turbulence quantities are taken similar to Oevermann( Reference Oevermann 52 ) and Mura et al( Reference Mura and Izard 53 ): for the free stream inflow I=0.3%, μ t /μ=675 and for the injector I=3.3%, μ t /μ=63.
Inflow and injector flow conditions for the DLR combustor experiment

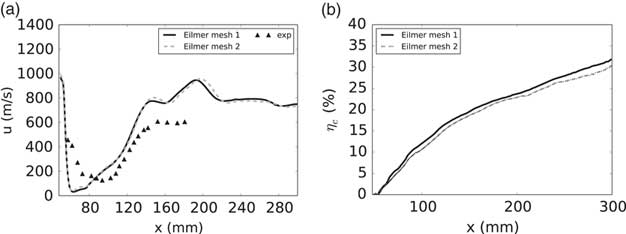
A mesh independence study has been performed with structured grids containing 117,000 (mesh 1) and 276,432 (mesh 2) cells. For this study, the EDM with setting A edm=4 and a combination Pr t =Sc t =0.9 was adopted. The result is shown in Fig. 12 for the horizontal velocity component along a line superimposing the symmetry axis of the strut. In the following discussions, the term centerline velocity will be used instead. Some small differences are observed in the recirculation regions behind the strut (x ≈70 mm) as well as further downstream in the combustor. However, for most of the profile, both meshes predict the same centerline velocity. Also shown in Fig. 12 is the combustion efficiency computed with Equation (10). The profiles are very similar with a maximum difference of 1.5% between the grids. Given the limited effect of the refinement (≈factor 2) on the solution, the coarser mesh is suitable to study the application of the EDM on the combustor. Therefore, the following discussion considers the first mesh.
Predictions of centerline velocity (a) and combustion efficiency (b) obtained with different mesh sizes.

3.2.2 Results
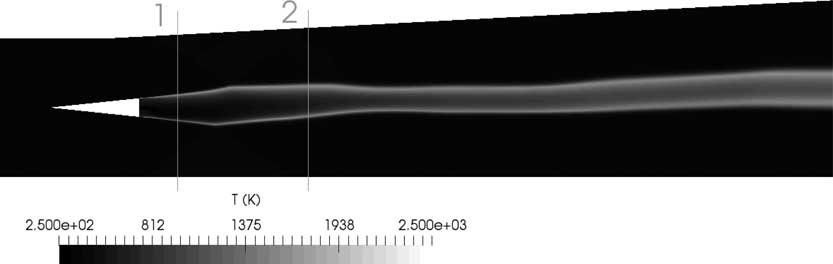
The DLR combustor test case has proven to be very challenging to predict in a 2D context. Multiple combinations of the different settings for A edm, Prt and Sct were explored and only a limited number of results will be discussed in this paper. Waidmann et al( Reference Waidmann, Alff, Brummund, Böhm, Clauss and Oschwald 34 ) collected, inter alia, data on axial velocity and temperature at the cross-sections marked with 1 and 2 in Fig. 13.
Temperature contour (A edm=4, Pr t =Sc t =0.9) with indication of the axial measurement locations considered in the present work.

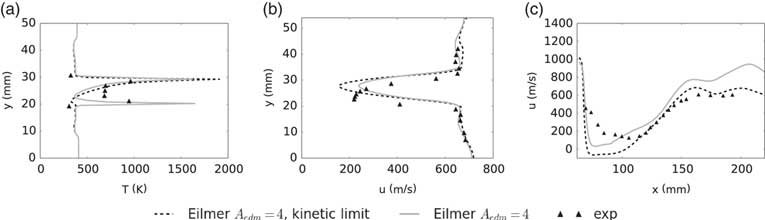
First, the effect of introducing a kinetic limit on the EDM reaction rate has been explored. Figure 14 shows its influence compared with some of the available experimental data for the EDM setting, A edm=4, and a turbulent setting of Pr t =Sc t =0.9 in accordance with Gao et al( Reference Gao, Wang, Jiang and Lee 54 ). Simulations with kinetic limit were initiated from the converged EDM result without limit as to avoid the need for a source of ignition given the low free-stream temperatures.
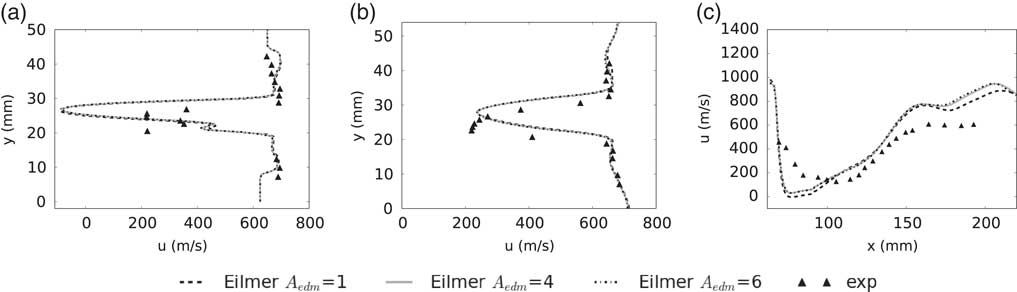
Effect of applying the kinetic limit on the temperature at axial location 1 (a), the velocity at axial location 2 (b) and the centerline velocity (c). A edm=4, Pr t =Sc t =0.9.

Axial velocity profiles did not show significant differences; however, the temperature profiles did. This behavior is observed in Fig. 14(b) where the axial velocity is presented at the second measurement location of Fig. 13. Applying the kinetic limit mostly affected the local minimum in axial velocity between the two shear layers but its position is not influenced by the modelling option. The EDM with kinetic limit shows an under-prediction of the minimum axial velocity whilst the classic EDM over-predicts the experimental value. Despite having similar minimum locations, the velocity profiles of the simulation are not aligned with experimental trends. It must be noted that even the more advanced CFD models( Reference Génin and Menon 57 – Reference Fureby, Fedina and Tegnér 59 ) do not yield a good agreement with the mean axial velocity at location 2, i.e. the minimum location is wrongly predicted. This observation demonstrates the challenging nature of this test case. It is not exactly clear what the reasons are for this but a possible cause could be inaccuracies in the recirculation regions prediction as pointed out by Genin and Menon( Reference Génin and Menon 57 ).
The numerical results of the axial temperature profile are strongly influenced by the kinetic limit. Predictions at the first measurement station shown in Fig. 13 are presented in Fig. 14(a). Applying the kinetic limit suppresses combustion in the lower recirculation region just downstream of the strut. This results in a single temperature peak which does not agree with the experimental data. The observation is explained by the low free stream temperature and the asymmetry in the geometry. The EDM results in peak temperature locations similar to experiments and the reference CFD. The structure of the recirculation regions is, however, different in the numerical simulation. Figure 14(c) shows the centerline velocity. The end of the strut is located at x=64 mm in this representation. As mentioned above, the structure of the recirculation regions behind the strut is different depending on whether EDM is used with a kinetic limit or not. The upper recirculation zone extends down to the centerline which is not experimentally observed, neither predicted by the standard EDM (see positive values for u in Fig. 14(c)). Further downstream the combustor, the velocity profile of the EDM with kinetic limit is in better agreement with the experimental data than the other profiles. The kinetic limit is not applied in the following discussion as the influence of this limit in the region close to the strut results in worse agreement with the experimental data.
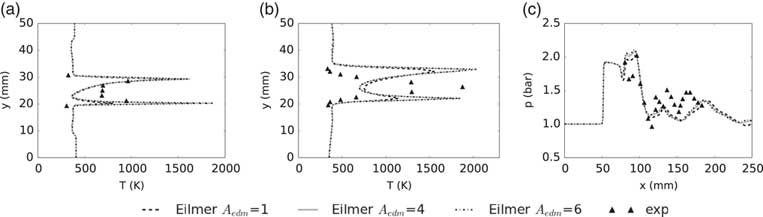
Second, the most appropriate setting for the A edm constant is now investigated. From the observations in the Burrows–Kurkov test case, the configuration is expected to have high values of ω in the shear layers induced by the strut with decreasing strength towards the end of the combustor. Figure 15 confirms this statement. Moreover, the higher ω values are present near the fuel injector. Experimentally, the flame is located in the vicinity of the injection point behind the strut. In contrast to Burrows–Kurkov, there is no significant runaway length, i.e. combustion does occur almost as soon as fuel and oxidiser mix. In terms of the EDM, given the high ω values behind the strut, a relatively low value of A edm should be applied. Too low a value would, however, negatively influence the combustion zone further downstream characterised by lower ω values. Figure 16 shows the mean temperature at locations 1 and 2 of Fig. 13 as well as along the lower combustor wall obtained with the same three settings of the EDM as in Burrows–Kurkov, namely A edm=1, 4 and 6. Figure 17 presents the velocity at the same locations 1 and 2 as above as well as the centerline velocity. The influence of A edm on the velocity is very limited: minimal at the axial measurement locations and slightly more pronounced along the centerline. There is an influence on the size of the upper recirculation zone directly behind the strut. Regarding the lower wall pressure, a different A edm setting does not strongly affect the profile. This can be understood from the fact that the width of the reaction zone along the combustor is not influenced by the combustion model which is shown in the temperature profiles. It is, however, influenced by the interaction between the shock waves and the turbulent shear layers, and consequently by the turbulence model. The wall pressure trends are similar, i.e. shock reflection locations, to the hybrid RANS/LES reported in the literature by Potturi and Edwards( Reference Potturi and Edwards 58 ) (see cases 1–4 in Fig. 12). The width of the reaction zone (Δy reac) predicted by Eilmer with different EDM settings is comparable to the experimental measurements. From Fig. 17(b), the CFD predicts a value for Δy reac of ≈15.5 mm and the experimental data a value of ≈13 mm.
Contour of ω for the DLR combustor experiment of Waidmann et al( Reference Waidmann, Alff, Brummund, Böhm, Clauss and Oschwald 34 ).

Effect of the model constant A edm on the temperature at axial locations 1 (a) and 2 (b), and on the wall pressure (c). Results obtained with Pr t =Sc t =0.9.

Effect of the model constant A edm on the velocity at axial locations 1 (a) and 2 (b), and on the centerline velocity (c). Results obtained with Pr t =Sc t =0.9.

At the first measurement location, the mean temperature follows the experimental trend well. Peak values in the two shear layers are strongly influenced by the A edm setting. It is difficult to state which setting is more appropriate as not enough experimental data points are available in the shear layer to shed light on the observed peak temperature values. It is inferred that a value for A edm higher than 1 and below 4 is required. Adopting A edm=1 results in an under-prediction of the peak mean temperature in the lower shear layer at the first measurement location. At the second location, the same effect of the EDM setting is observed: higher value coupled with increased peak temperature. In order to match the experimental peak, A edm should be set to ≈4. However, a double peak profile is predicted by the CFD which is not experimentally observed. Gonzalez-Juez et al( Reference Gonzalez-Juez, Kerstein, Ranjan and Menon 60 ) mentioned in a review paper that a similar observation has been reported in the literature in an LES study with the eddy break up (EBU) model for TCI treatment. The latter model is closely related to the EDM. Nevertheless, the observations are in accordance with the above-stated expectations of the EDM: in the vicinity of the strut (a region with higher values of ω) a lower A edm setting is more appropriate while further away (a region with lower values of ω) a higher A edm setting performs better. Overall the standard setting of 4 is a good compromise for the DLR combustor as it provides a reasonable comparison with the experimental data at the different locations inside the combustor.
3.3 Case 3: the HyShot II combustor
The HyShot II combustor was designed for a Mach 8 flight test experiment on supersonic combustion( Reference Karl, Hannemann, Mack and Steelant 35 , Reference Karl 36 ). Experimental campaigns have been undertaken in the HEG shock tunnel of the DLR with a 1:1 scale representation using hydrogen fuel. The configuration has been studied with different RANS approaches in the literature( Reference Karl, Hannemann, Mack and Steelant 35 – Reference Pecnik, Terrapon, Ham, Iaccarino and Pitsch 37 ). A detailed description of the ground test experiment is given by Karl( Reference Karl 36 ) and is considered for numerical study in the present work.
3.3.1 Problem formulation
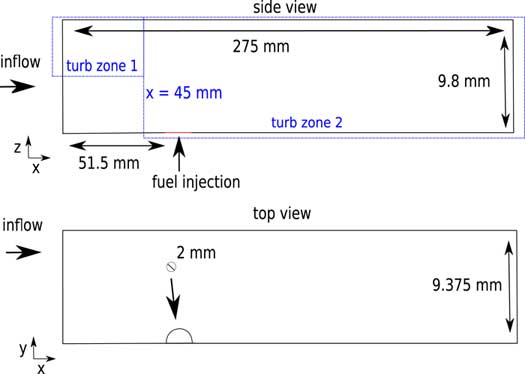
This simulation is performed in three dimensions. Only a part of the combustor, shown in Fig. 18, is considered for application of the EDM. It consists of half an injector and two symmetry planes. The considered computational domain size contains sufficient experimental data points in order to analyse the EDM and the effect of the model constant (A edm). The computational domain is discretised in ≈2.8 M hexahedral cells and an O-grid topology is adopted for the injector. Pecnik et al( Reference Pecnik, Terrapon, Ham, Iaccarino and Pitsch 37 ) obtained satisfactory reacting wall pressure traces with a structured grid consisting of 2.6 M cells. Moreover, the injector was modelled as part of the computational domain which extended to include a part of the nozzle. This suggests that the current mesh size of 2.8 M cells is a good starting point. In order to ascertain the suitability of the grid for the Eilmer CFD solver, future work should include a mesh independence study.
Schematic of the HyShot II combustor( Reference Karl, Hannemann, Mack and Steelant 35 ). Not to scale.

The injector is modelled as a supersonic inflow boundary with conditions: w=1206.7 m/s, p=263,720 Pa, T=249 K, I=5%, μ t /μ=10. The resulting equivalence ratio is 0.29. The upper and lower boundaries (z ordinates) are treated as viscous isothermal walls at a temperature of 300 K. Compressible wall functions of Nichols and Nelson( Reference Nichols and Nelson 61 ) are adopted so as to reduce the computational cost of the simulation due to grid requirements. The 2D CFD inflow conditions of Karl et al( Reference Karl, Hannemann, Mack and Steelant 35 , Reference Karl 36 ) are prescribed at the inlet of the 3D domain (same inflow for each lateral cell location) and correspond to averaged conditions: T=1300 K, p=130 kPa, u=1720 m/s and Mach=2.4. The boundary layer (BL) along the upper wall (cowl side) is assumed to be fully turbulent while a transition from laminar to turbulent flow takes place at the lower wall (injector side) around x=45 mm. This is accounted for in Eilmer by generating two turbulent zones across the width of the domain, shown in Fig. 18. Outside these zones the turbulent quantities (k,ω) are purely transported and do not affect the other governing equations.
Inviscid fluxes are treated with the AUSMDV and time stepping with a predictor–corrector scheme. Values for turbulent Prantl and Schmidt numbers are set to 0.9 and 0.7, respectively. Sensitivity studies to these parameters have been reported by Karl( Reference Karl 36 ) and Pecnik et al( Reference Pecnik, Terrapon, Ham, Iaccarino and Pitsch 37 ) with the Spalart–Allmaras and the k−ω SST turbulence model, respectively. It was observed by both authors that the resulting pressure traces with different model parameters remain between the experimental uncertainty of the measurements. Therefore, such a sensitivity with the k−ω 2006 model is not considered in the present work. Instead, the standard setting for these parameters is selected.
3.3.2 Results
Reacting simulations of the HyShot II combustor have been performed with the EDM. It was not possible to converge toward a steady-state. It is likely there is an inherent unsteadiness in the flow that has been resolved by the explicit time stepping, hence it is an unsteady (URANS) simulation. URANS requires small enough time steps in order to capture variations in mean flow properties due to the largest turbulent fluctuations. Karl et al( Reference Karl, Laurence, Martinez Schramm and Hannemann 62 ) reported a study of the unsteady shock train inside the HyShot II combustor. The authors applied URANS with a second-order accurate temporal discretisation scheme and physical time steps of 1e−7 s. The predictor–corrector scheme used in Eilmer is second-order accurate( Reference Barth and Deconinck 63 ) and time steps in current HyShot simulations were below 4e−9 s following the evaluation of the CFL criterion. Time steps in current work are orders of magnitude smaller than in the CFD simulations of Karl et al( Reference Karl, Laurence, Martinez Schramm and Hannemann 62 ). It can, therefore, be concluded that an inherent unsteadiness in the flow field is expected to be captured and that URANS is performed in the present work. Note that the non-reacting simulations did converge to a steady state. It is inferred that the unsteadiness originates due to the interaction between air flow and injected fuel (shear driven instability) and/or the combustion process. In order to enable comparison with experiments, the CFD data are time-averaged over two flow lengths once initial transients have passed which is suitable for design estimations.
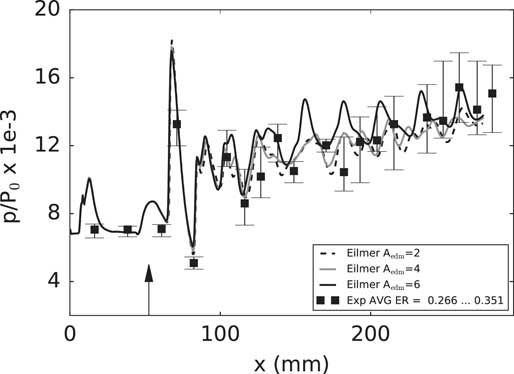
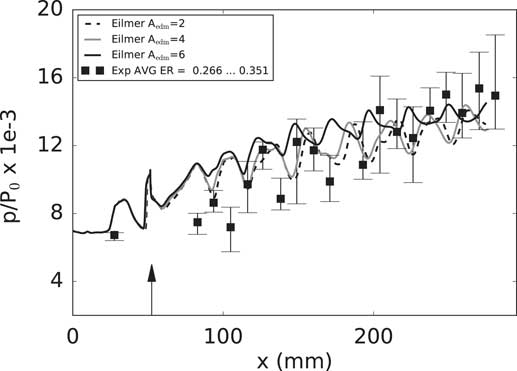
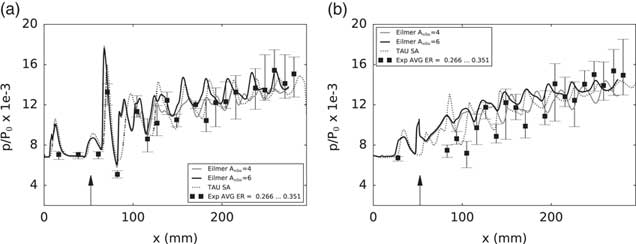
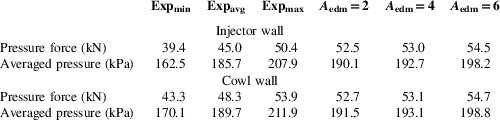
The effect of varying the value of A edm on the wall pressure is investigated in Figs 19 and 20. Increasing the value results in increased pressure values and an overall vertical shift of the profile. This effect is more pronounced when comparing the curves of A edm=4 and 6 with respect to the curves of A edm=2 and 4. On the injector side in Fig. 20, an upstream shift of the shock reflection positions is induced by an increased A edm value. The cowl wall pressure trace is in good agreement with the experimental data for any choice of A edm. On the injector side, the pressure traces are within the experimental uncertainty for most of the combustor length. Close to the axial injection location (≈52.5–120 mm), the EDM is unable to account for the experimental pressure variation. A similar observation is made for the CFD predictions obtained by Karl( Reference Karl 36 ) which are shown in Fig. 21(b). The reference CFD results are predicted by the Tau code with the Spalart–Allmaras turbulence model in conjunction with a no-model chemistry (modified Jachimowski mechanism) approach. The same Pr t and Sc t settings used in Tau-based analysis are used in this work. Note that Pecnik et al( Reference Pecnik, Terrapon, Ham, Iaccarino and Pitsch 37 ) showed more success in capturing the injector side wall pressure trace with a flamelet TCI model in conjunction with the k−ω SST turbulence model. On the cowl side (Fig. 21(a)), the EDM pressure trace demonstrates a similar trend to the reference CFD. In terms of shock strength, A edm=6 agrees better with Tau. The pressure profiles in Figs 19 and 20 have been integrated to obtain the pressure force and averaged pressure. The same averaging has been performed for the experimental values with results shown in Table 3. Given the limited amount of experimental measurements, the averaged quantities should be seen as relative indication rather than an absolute reference point. The Expmin and Expmax are calculated based on the error bars. On the injector side, the pressure force calculated with the different EDM simulations over predicts the experimental maximum. This result is probably due to the pressure prediction between ≈52.5 and 120 mm and the lack of experimental data in this region. Nevertheless, in terms of averaged pressure, simulations with different A edm settings are within the experimental bounds. On the cowl side, the same observation is made as for the injector side with regard to the averaged pressure values. The pressure force computed for A edm=2 and 4 are within the experimental bounds while it is overestimated for A edm=6.
Effect of A edm on the time-averaged pressure traces along the cowl wall at y=9.375 mm with P 0=17.73 MPa.

Effect of A edm on the time-averaged pressure traces along the injector wall at y=9.375 mm and P 0=17.73 MPa.

Pressure along the wall at y=9.375 mm with EDM and no-model reference CFD: (a) cowl side and (b) injector side. P 0=17.73 MPa.

Averaged pressure and pressure force predicted by the EDM for the HyShot II combustor

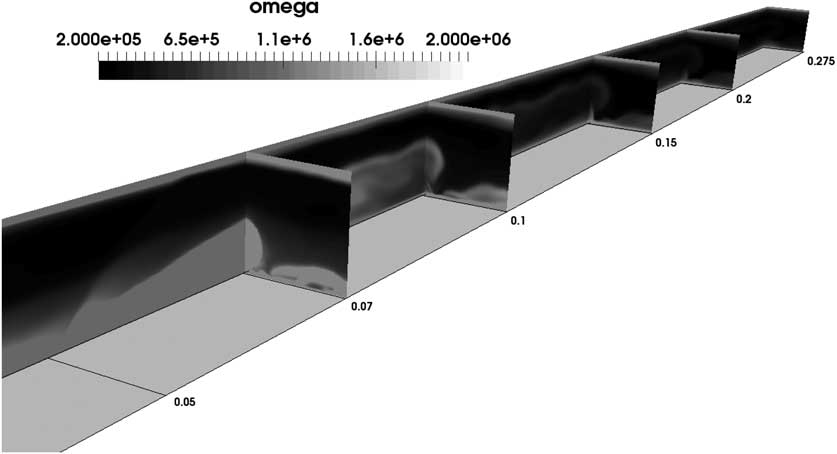
Regarding the use of the EDM for the HyShot II combustor the following conclusions are drawn. Based on the comparison in Table 3, it is inferred that the value of A edm should be kept below 6. The wall pressure traces in Figs 19 and 20 do confirm this statement. A higher setting would result in even higher peak pressure values which would not agree with experimental measurements until ≈200 mm downstream inside the combustor. Further downstream the strength of the combustion is less intense and the CFD predictions are near the lower part of the experimental uncertainty interval, especially on the cowl side. The observation can be explained with the contour of ω in Fig. 22. The turbulent dissipation rate is strong inside the barrel shock induced by fuel injection. This is shown in the different cross planes. However, moving downstream, the magnitude reduces considerably (see locations x=0.15, 0.2 and 0.275 m). As an indication, between locations x=0.15 and x=0.07, ω decreases by an order of magnitude (except for the boundary layer). In analogy with the Burrows–Kurkov and DLR configurations, a possibility would be to split the combustor in two zones with a higher A edm value in the downstream region. Overall, a setting A edm between 4 and 6 is advised for the HyShot II combustor.
Contour of ω for the HyShot II scramjet combustor.

4.0 DISCUSSION OF THE EDM PREDICTIONS
The experiment of Burrows–Kurkov, the DLR combustor and the HyShot II combustor have been selected in order to investigate the most suitable application of the EDM to supersonic combustion test cases.
In the first test case, the best agreement with several sets of experimental data at the exit of the combustor was achieved with a A edm setting of 6. The value is explained by the configuration with parallel injection of fuel and oxidiser which introduces an ignition delay. In order to capture a similar effect with the EDM, a kinetic limit can be introduced, however the influence is very localised to the near injector region and does not allow to account for a realistic ignition delay. The reaction rate computed with the EDM relies on the value of ω. Its value is high in the shear layer near the injector and decreases downstream of the combustor. In other words, in the region where no combustion takes place experimentally, based on the turbulence, the EDM will predict high reaction rates. In the downstream region, the opposite is true which explains the need for a high A edm value. An alternative to the kinetic limit has been explored in this work and consists of relying on an estimate of the ignition delay from a 1D chemical kinetics program. A comparison with experimental data demonstrated that the approach resulted in improved predictions and could be considered for the analysis of similar scramjet configurations. This was termed a zonal EDM approach.
The DLR test case involves fuel injection behind a strut. Application of the kinetic limited resulted in worse agreement with experimental data in the vicinity of the injector. Varying the EDM constant’s value did not strongly affect other quantities aside from the temperature. Just behind the strut, a value between 1 and 4 captures the experimental temperature profile. Further downstream, a value of 4 or higher is more appropriate. These settings are explained by a similar behavior of the turbulence model as in the Burrows–Kurkov test case, i.e. high ω values near the injector with decreasing downstream trend. Based on the DLR combustor results, we suggest a modification of the EDM which consist of a zonal dependency of the A edm value. Close to the point of injection, a lower (≈1–4) setting of the A edm constant could be used and further downstream a higher value (>4). Waidmann et al( Reference Waidmann, Alff, Brummund, Böhm, Clauss and Oschwald 34 ) discussed the main features inside a configuration such as the DLR combustor. The authors explain the presence of three distinct zones dominated by fundamentally different physics. First, there is an induction zone, just behind the strut, where the combustion is dominated by a diffusion process between the injected fuel and the vitiated air stream. It is followed by a transitional zone where large-scale structures develop. These structures originate in the shear layers between the air and the fuel stream due to the velocity difference and vorticity is produced. They are responsible for the entrainment of the oxidiser inside the reaction zone. In this zone, the combustion is dominated by convection instead of diffusion. Further downstream, a third zone is discerned where the turbulent eddies break down and the flow becomes more chaotic. Such information can be used for a better application of the EDM and the idea of a zonal EDM could apply to the different flow regimes. The extent of the three zones would have to be estimated and the A edm setting adapted. It was shown in the experiment of Burrows and Kurkov that even an estimate of the ignition delay is good enough in order to draw design conclusions with the EDM. The same comment can be made for the DLR combustor. Moreover, the zonal approach could as well be applied to the values of Prt and Sct.
The HyShot II combustor was selected as a third test case. An A edm setting of 4 provided reasonable predictions of wall pressure traces in comparison with experimental data. Similar to the previous test cases, high values of ω are observed near the point of injection with decreasing value downstream of the combustor. As with the previous test cases, a zonal use of the EDM could be an option to improve agreement with experimental observations. This can also include a variation for the values of Prt and Sct.
5.0 CONCLUSIONS
In this work, the EDM has been used in conjunction with Wilcox k−ω 2006 turbulence model for the study of three hydrogen-fuelled scramjet combustors. A different fuel injection strategy is applied in each of the test cases allowing a broader assessment of the EDM’s application. The designs of two of the test cases result in high combustor entrance Mach number (>2) and static temperature (>1000 K), typical for high flight Mach numbers (>8) while one test case was characterised by cold inflow.
The EDM requires the specification of a model constant A edm and the aim of the present work was to understand its most appropriate setting. In the case of parallel fuel injection, a significant ignition delay is present for which the standard application of the EDM, or the EDM with kinetic limit, is unable to account. By relying on an estimate of the ignition delay obtained from a 1D chemical kinetics program, the EDM predictions appear to be in very good agreement with experimental measurements. This indicates that past the point of ignition the combustion appears to be mixing-limited. Without an ignition delay estimate an A edm value of 6 resulted in the best agreement with experimental data while a value of 4 is preferred when an ignition delay is estimated. In the case of hydrogen fuel injection behind a strut, the EDM with kinetic limit failed to predict one of the reaction zones near the strut and was not considered in further simulations. Regarding the setting of the A edm constant, a value of 4 provided overall reasonable results. In the last case of transverse fuel injection, ignition occurs almost as soon as the reactants meet, hence mixing-limited combustion is prevalent. The wall pressure traces obtained with the EDM agreed well with experiments for the largest part of the combustor length. Some differences are observed at the injector wall, especially near the point of injection. An A edm constant value of 4 was identified as appropriate in simulating this combustor. In the discussion of the test cases, a zonal use of the EDM was identified as a viable approach to improve the predictive capability of the model and should be explored in future work. The zonal approach consists of varying the value of A edm across the combustor. It can also be taken further as to vary the setting of Prt and Sct. With careful calibration of model parameters and the possibility to use a zonal approach, the EDM has the potential to be used in the design of scramjet combustors with hydrogen fuel.
ACKNOWLEDGEMENTS
The authors would like to express their gratitude to Dr Peter Jacobs from the University of Queensland for the many discussions and suggestions during the realisation of this work. The authors would also like to thank Dr Sebastian Karl at DLR for providing the inflow conditions of the HyShot II combustor. This work was supported by the Royal Society of Edinburgh through the J.M. Lessells scholarship, the University of Strathclyde and the University of Glasgow through the Mac Robertson scholarship. Results were obtained using the EPSRC funded ARCHIE-WeSt High Performance Computer (www.archie-west.ac.uk). EPSRC Grant no. EP/K000586/1.