Implications
In organic egg production, the area provided by multi-tier aviaries is included when calculating the net indoor area available to the birds, leading to more birds being housed on the same floor area. Plumage condition, presence of breast redness and blisters, pecked tail feathers, perch use, and feed competition are affected through the simultaneous reduction in access to other resources, mainly perches, nests, and troughs. These concurrent constraints should be taken into consideration when housing more hens per indoor floor area in organic production.
Introduction
Many organic egg production systems use single-tier aviaries with access to perches, nest boxes, and an outdoor area. However, multi-tier aviary systems, where conveyor belts below the tiers allow the manure to be transported out of the aviary at regular intervals, are becoming more common. The area on the tiers can be included in the net area available to the animals (also referred to as usable area) when calculating maximum indoor stocking density in organic egg production, which is 6 hens/m2 (EC 889/2008 2008), thus allowing more hens per actual floor area of the house than in other systems. A multi-tier system is thus a poultry house where the usable area is not all at ground level (Expert Group for Technical Advice on Organic Production (EGTOP, 2012)). It should be noted that the number of levels the birds can access is usually higher than the number of tiers imply, as each tier may have more than one level. A detailed description of the use of multi-tier aviaries in organic egg production in Europe can be found in Steenfeldt and Nielsen (Reference Steenfeldt and Nielsen2015).
Until now, the scientific studies of the behaviour and welfare consequences of increased stocking densities in aviary systems have been done in conventional, single-tier systems (Nicol et al., Reference Nicol, Brown, Glen, Pope, Short, Warriss, Zimmerman and Wilkins2006; Zimmerman et al., Reference Zimmerman, Lindberg, Pope, Glen, Bolhuis and Nicol2006) and without access to outdoor areas (Carmichael et al., Reference Carmichael, Walker and Hughes1999; Moesta et al., Reference Moesta, Briese, Knierim and Hartung2008a and Reference Moesta, Briese, Knierim and Hartung2008b). Thus, little is known on the effects of increased indoor stocking densities in multi-tier systems on the behaviour and welfare of organic laying hens. An increased stocking density can be achieved by adding more birds, by reducing the available floor area, or both. We chose the former because this would be how organic egg producers in practice would increase their stocking density. The study was designed to investigate differences in behaviour, welfare and production level of organic laying hens in a multi-tier system with permanent access to a veranda and kept at stocking densities of 6, 9 and 12 hens/m2 available floor area (treatments D6, D9 and D12, respectively). In addition, the concurrent effects of reduced access to resources were assessed at the lowest stocking density by blocking access to the top tier as an additional fourth treatment (treatment D6x), also resembling the single-tier system currently used by many organic egg-producers. This allowed us to separate, at least to some degree, the relative effects of available floor area and reduced access to resources on the variables measured. Except for the stocking density in D12, the experiment followed the EU regulations on the keeping of organic laying hens (EC 889/2008 2008). In a preceding article (Steenfeldt and Nielsen, Reference Steenfeldt and Nielsen2015) we reported the results on egg production, laying behaviour, and use of veranda and outdoor area. In this article we present results on live weight changes, and various health measures, as well as the hens’ use of perches. The associated article (Steenfeldt and Nielsen, Reference Steenfeldt and Nielsen2015) should be consulted for a full evaluation of the consequences for production, behaviour and welfare of allowing more hens per available floor area in these types of organic egg production systems.
Material and methods
Below is a summary of the experimental design; the full description can be found in Steenfeldt and Nielsen (Reference Steenfeldt and Nielsen2015).
Animals and housing
Housing system and design
The study was conducted on a Danish commercial organic farm over two, 47-week periods, from May 2011 to March 2013. A multi-tier aviary system (Harmony Combo 2™ (two tiers), Landmeco, Ølgod, Denmark; www.landmeco.dk; Figure 1a) was installed on the concrete floor of a house in two rows (referred to as sections) running parallel along the length of the house (Figures 1b and 1c). The aviary system had a chain feeding system placed above grid flooring, under which automatic manure belts were installed, with three feeder chains and belts on each section (two on the lower tier, and one on the upper tier; Figure 1a). Nests for egg laying (open between 0400 and 1600 h) were placed above a conveyor belt in the middle of each section between the two tiers, with access from each side of a section. Nipple drinkers were evenly spaced on both sides of the nests along the length of each section. Each section had a total of 13 perches (metal tubes, diameter=3 cm), five of which were running along the very top of the section (top perches). Automatic manure belts were installed beneath the grid flooring, with three belts on each section (two on the lower tier, and one on the upper tier; Figure 1a). Rooms were identically lit with no dawn/dusk dimming. The initial lighting program was 11L : 13D, increasing gradually to 14L : 10D over the following 3 weeks, at which point the daily light period was kept at 0700 to 2100 h for the remaining period.
(a) Diagram (cross-section) of the multi-tier aviary system (Harmony Combo 2™, Landmeco, Ølgod, Denmark; www.landmeco.dk). In treatment D6x, access to the top tier (above the nests and drinking nipples) was blocked by netting; (b) diagram (side view) to scale of a room showing the position of the two multi-tier sections (A and B). Manure belt numbers are circled. Stippled vertical line on the left indicates curtain between veranda and outdoor area; (c) plan view to scale of two of the 12 rooms showing the two multi-tier sections (A and B) traversing the length of the house. The two pop-holes per room leading to the veranda are indicated. CF=chain feeders; G=grid flooring.

A veranda, sheltered from the outside by taut curtains, was established along the entire length of the building, to which the birds could gain access through pop-holes (Figures 1b and 1c). From the veranda, the birds had daily access to an outdoor area, except in extreme weather conditions.
The house and veranda were divided into 12 identical rooms (Figure 1c) by wooden walls, which prevented visual contact between hens in separate rooms. The floor area beneath each section was closed off during the entire experiment. The available floor area per room was 66 m2 (including the veranda). Each room had two pop-holes accessing the veranda. The outdoor areas differed in size according to treatment.
Birds and treatments
For each of the two experimental years, a flock of 6534 non-beak trimmed pullets (Hisex White, 18 weeks of age) were obtained from a commercial company (n=13 068 birds in the study). They had been reared in an organic system with access to both raised slats and outdoor areas from 9 weeks of age, and a daily roughage supply.
Four treatments were included in the experiment, three of which consisted of increasing indoor stocking densities (6 birds/m2 (D6), 9 birds/m2 (D9) and 12 birds/m2 (D12) available floor area). The remaining treatment (D6x) had the same stocking density as D6, but the top tiers of each aviary section were made inaccessible to the birds, thus reducing access to perches and feed troughs, and resembling the single-tier system currently used by many organic egg-producers. Each treatment was replicated three times in each flock, giving a total of six replicates per treatment.
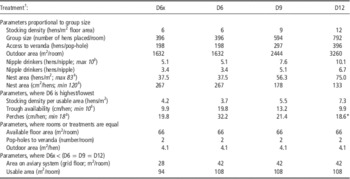
The differences in stocking densities were achieved by placing a different number of birds per room; this also resulted in other differences between treatments, such as nest area and perch length per hen (Table 1). For the treatments with full access to both tiers, the limiting factors for number of birds per room were perch and trough availability. Four perches were added to the rooms allocated to treatment D12 to ensure sufficient perch space per hen (Table 1).
Description and calculation of different housing dimensions and resources for the four treatments, grouped according to treatment differences

† D6x, D6, D9, D12: Letter D followed by a number refer to stocking density (6, 9 or 12 hens/m2 floor area), ‘x’ indicates that access to the top tier has been blocked.
‡ Minimum and maximum values from the EU regulations for organic laying hens (EC 889/2008 2008) and hens in alternative systems (EC 74/1999 1999 ) are indicated in italics.
* This includes four added perches on the first tiers in treatment D12 without which the availability would have been only 16.1 cm/hen.
Feed, roughage and water
All hens were offered a pelleted and crumbled organic compound layer diet with an average protein content of 205 g/kg dry matter (DM) and a metabolisable energy of 10.6 to 11.3 MJ/kg (see Steenfeldt and Nielsen (Reference Steenfeldt and Nielsen2015) for detailed chemical analyses) ad libitum during the experimental period from 18 to 65 weeks of age. The chain feeding system was activated at regular intervals five times per day from 0730 h (first feeding) until 2030 h (last feeding). It was not possible to register feed intake per room, and the amount fed was registered automatically on a daily basis for the whole flock. From week 30, the hens were offered free access to oyster shells from plastic sacks placed on the floor. Barley-pea silage was distributed daily (~30 to 50 g/hen) on the floor in the veranda. Water consumption (l/day) was automatically registered by a computer for the whole flock.
Measurements, data collection and analyses
Mortality, clinical examination and hen weight
Mortality was recorded daily on a room basis. For each flock, a sample of birds (n=50 and 30 for years 1 and 2, respectively) from each room were weighed individually upon arrival at 18 weeks of age. Twice in each flock (at 36 and 65 weeks of age) a sample of 30 hens were caught in each room, weighed individually, and clinically examined for signs of disease and injury, and the plumage quality was scored (except at 36 weeks in year 1). Plumage condition was assessed using a four-point scale from 0 (no damage) to 3 (almost or completely devoid of feathers). Originally this was to be carried out for different body areas, but as only the breast area showed consistent signs of wear, this area alone was scored. The presence of breast blisters and redness were also noted. Signs of feather damage on the neck and tail were observed (presence of broken feathers or featherless areas) and registered separately as binomial variables; based on the type of damage it was noted if the likely cause was pecking or wear. The incidence and severity of foot pad dermatitis were to be registered for both feet of each hen using the three-point scale by Ekstrand et al. (Reference Ekstrand, Algers and Svedberg1997). However, no foot pad dermatitis was observed, whereas several cases of bumblefoot were noted.
Chemical analyses of roughage and manure
The DM content of samples of barley-pea silage (n=2) and manure collected from individual manure belts (n=132; half from each year) was determined by drying at 103°C for 8 h. All samples were analysed for ash according to method 930.05 of the AOAC (Association of Official Analytical Chemists, 2000). The barley-pea silage was further analysed for nitrogen (Hansen, Reference Hansen1989), methionine, cysteine, lysine and threonine (EC 152/2009 2009), and for phosphorus by the colorimetric vanadomolybdate procedure (Stuffins, Reference Stuffins1967) and calcium according to method 975.03 (Association of Official Analytical Chemists, 2000). The content of non-starch polysaccharides (NSP) and lignin were analysed in the pea–barley silage according to the method described by Knudsen (Reference Knudsen1997). In addition, the manure samples were analysed for acid-insoluble ash to estimate sand content using a gravimetric method based on HCl treatment (McCarthy et al., Reference McCarthy, Aherne and Okai1974), and a sub-set (n=48) were also analysed for nitrogen and phosphorus content using the same methods as for silage.
Video recordings on top perches
The behaviour of the birds was recorded in each room by a video camera placed above the multi-tier section closest to the veranda (section A), allowing a view of at least one third of the length of the top perches in the three treatments with access to these (Supplementary Figure S1). In the first year, dust on the camera lenses made the recordings unusable, and regular cleaning was incorporated in the second year. For each video, exactly one-third of the length of the top perches were marked, and the number of birds perched within this area was counted at five time points (dawn, 0800, 1200, 1600 h and dusk) on three days (36, 42 and 50 weeks of age) in year 2. Dawn and dusk was defined as the first and last video frame, respectively, on which the birds were visible. Data were multiplied by 6 to reflect the total length of top perches on both tiers, and proportions adjusted to the exact number of birds in each room on the day of observation.
Manure weighing
In order to obtain a measure of the use of the aviary system and to supplement the video recordings of the use of top perches, we weighed the manure from the three manure conveyor belts in each section. This was done per room by calculating the time taken to empty each room based on the speed of the conveyor belt. The manure belts were emptied 12 or 24 h before the weighing, which started at 0800 h. For each of the six conveyor belts, a trough the width of the conveyor belt was placed on a custom-build scale at the end of the belt, the weigh scale was tared and the belt was started. The electronic display on the weigh scale was noted every 81 s thereby recording the accumulated amount of manure for each room. Weighing was carried out on 15 days (24 h), and three nights (12 h) across the two flocks. The amount of manure was adjusted for sand content (estimated from the chemical analysis of manure samples) to prevent potential bias caused by soil from the feet of the hens, of which more would be deposited on the manure belt closest to the outdoor area.
Statistical analyses
Data were analysed using Minitab (ver. 17, www.minitab.com) including all four treatments to allow direct comparisons between treatments with similar access to certain resources (see Table 1). A general linear model was fitted on a room basis to mortality and live weight gain, as well as hen live weight at each recording and breast plumage score at 65 weeks, with year/flock (n=2) and treatment (n=4) as fixed effects with their interaction. Breast plumage score at 36 weeks in flock 2 did not conform to variance analysis, and a Kruskal–Wallis test adjusted for ties was performed with subsequent pairwise Mann–Whitney testing of treatment effects. The effects of treatment on the incidence of other clinical variables (bumblefoot, breast blisters and redness, tail- and neck-feather damage) were tested using χ 2 analyses within year/flock at each recording. Behavioural observations in the second year on use of perches were analysed fitting day (n=3), treatment, and dawn/dusk (n=2) as fixed effects with all interactions. Kruskal–Wallis test adjusted for ties was performed on perching during the day with subsequent pairwise Mann–Whitney testing of treatment effects. Manure sample DM and sand content were analysed fitting room within treatment and with year/flock, treatment, and manure belt (n=6) as fixed effects with two-way interactions. Manure content of N and P were analysed fitting room within treatment, and year/flock, treatment, and manure belt (n=2) as fixed effects with all interactions. Manure weighings were analysed fitting week within year and room within treatment to account for repeated measures, and with treatment and year as fixed effects with their interaction. The Gaussian distribution of the residuals was tested by plotting these against fitted values and an Anderson-Darling normality test was applied to the residuals. Post-hoc comparisons were done using Tukey’s simultaneous tests.
Results
Hen live weights, mortality and morbidity
No significant effect of treatment was found on live weight at any time, but the two flocks differed with birds in the second year being slightly heavier when arriving at 18 weeks of age (F 1,936)=33.1; P<0.001) and this difference persisted at 36 weeks (F 1,696=8.1; P=0.005) and 65 weeks of age (F 1,695=33.0; P<0.001; Table 2). No significant effects were found on mortality, which averaged 3.2±0.18%, or on live weight gain, which averaged 515±8.0 g during the 47 weeks of egg production across flocks and treatments.
Overall mortality, as well as mean live weight, and breast plumage condition at 65 weeks for samples of hens in each flock/year

1 s.e.m.=pooled standard error of the mean.
2 At each time point sample size was 30 hens per room, except at 18 weeks in year 1, when 50 hens per room were weighed.
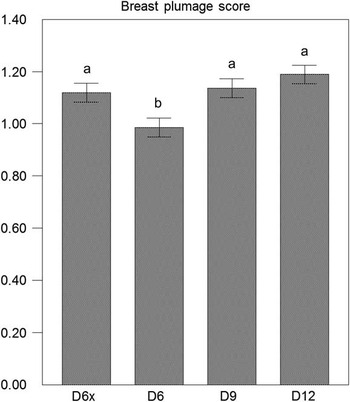
Breast plumage condition at the end of lay was significantly worse in flock/year 1, reflected in a higher plumage score (F 1,696=279.8; P<0.001; Table 2); and increased stocking density and fewer tiers both had a negative effect on breast plumage score (65 weeks: F 3,696=5.8; P=0.001; Figure 2). This was also found at 36 weeks in flock/year 2 (Kruskal–Wallis test: H=11.4; df=3; P=0.010) when treatment D6 had significantly lower breast plumage score (post-hoc Mann–Whitney treatment comparisons: D6 differs from each of the other treatments; 0.058⩾P⩾0.001). In flock/year 2 when breast plumage scoring was carried out at 36 and 65 weeks of age, a significant decrease in plumage condition was observed with time (0.20 v. 0.81 (±0.020), respectively, F 1,696=471.9; P<0.001).
Mean breast plumage score (±s.e.; 0=no damage) at 65 weeks for both years based on a sample of 30 birds per room for the four treatments. Bars with different letters differ significantly (P=0.001).

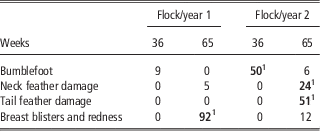
Table 3 show the incidence of various clinical variables at 36 and 65 weeks for each flock/year. Across flocks, the incidence of bumblefoot decreased with time, and was observed mainly in flock 2 at 36 weeks of age, but this did not differ between treatments (χ 2=1.6; df=3; P=0.664). Tail- and neck feather damage was seen in flock 2 at 65 weeks of age (Table 3) with fewer birds having tail-feathers damaged in treatment D6 than D12 (χ 2=28.8; df=3; P<0.001). Neck feather damage was observed more often in treatments D6x and D12 (χ 2=18.2; df=3; P<0.001); the five incidents seen in flock 1 were all in treatment D12. In flock 1, a similar effect was observed in the incidence of breast blisters and redness, with significantly more cases at 65 weeks in treatments D6x and D12 (χ 2=8.5; df=3; P=0.036). In year 2, dirty plumage was observed in 19 cases (5.3%) and egg duct infection in 22 cases (6.1%) at 65 weeks of age across treatments.
Incidence (cases/360 hens) of bumblefoot, feather damage and breast blisters for samples of 30 hens per room at 36 and 65 weeks in each flock/year

1 Numbers in bold were analysed by χ 2 for effects of treatment.
Roughage and feed intake
The chemical analyses of the roughage (barley–pea silage) showed a DM of 26% and a protein content of 184 g/kg DM. The content of NSP was 377 g/kg DM, and soluble NSP as a percentage of total NSP was 13%. The lignin content was high, being 106 g/kg DM giving a total content of dietary fibre of 483 g/kg DM. These values are comparable with analyses of barley–pea silage used in other studies (Steenfeldt et al., Reference Steenfeldt, Kjaer and Engberg2007). It was not possible to measure roughage intake, but most of the silage disappeared from the veranda area where it was distributed.
The consumption of feed was very similar in the two experimental years, with a daily average of 118 g/hen and 120 g/hen across treatments in years 1 and 2, respectively. In both years the feed intake increased gradually as the hens got older, with an average daily intake of 95 g/hen at 18 weeks of age, increasing to 126 g/hen at 65 weeks of age. Data on water consumption fluctuated greatly, due to registration malfunction and the presence of rain puddles in the outdoor area giving the birds alternative access to water at times. These data were therefore not analysed further.
Use of perches
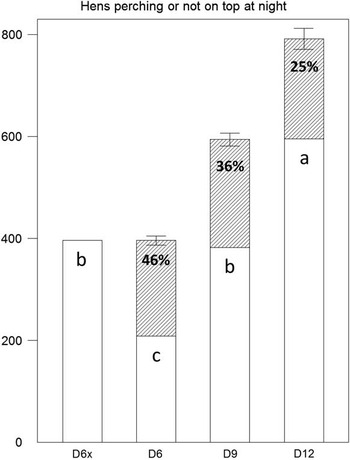
For treatments D6, D9, and D12, the number of birds observed on the top perches during the day was relatively low (median [Q1,Q3]=0 [0, 12]; mean±s.e.=7±1.2) compared to at dawn and dusk (median [Q1,Q3]=204 [183, 243]; mean±s.e.=208±7.5). No effect of treatment was found on the number of birds observed perching on the top perches at dawn and dusk (F 2,27=0.7; P=0.504), resulting in an average perching density on top at night of 11.8 cm/bird across the three treatments. Number of birds not able to perch on top therefore differed between treatments (F 3,39=97.2; P<0.001), as did the percentage of birds in each treatment using the top-perches at night (F 2,27=19.7; P<0.001; Figure 3). No significant differences were found between dawn and dusk, or between days of observation for either of these variables. During the day, more birds perched on top at 0800 h (Mann–Whitney: P⩽0.05) than at 1200 and 1600 h (13, 6 and 2 (±1.5), respectively; Kruskal–Wallis: H=11.9; df=2; P=0.003), and more birds perched on top in treatment D12 (Mann–Whitney: P⩽0.002) than in D6 and D9 (4, 5 and 14 (±1.5), respectively; Kruskal–Wallis: H=16.4; df=2; P<0.001).
Mean number of hens (±s.e.) perching (hatched bars) or not perching (white bars) on top at night in each treatment. Bars with different letters differ significantly (P<0.001). The percentage of hens perching is indicated for each treatment with access to perches (i.e. not treatment D6x).

Manure analysis
Chemical analysis of manure samples showed a large effect of manure belt with manure on the top belts having the lowest DM percentage (F 5,102=54.3; P<0.001), and sand content (F 5,104=112.4; P<0.001; Table 4). These sand content values were used to adjust the data on manure weights (see also ‘Material and methods’). Significant interactions between year and treatment were found in DM percentage (F 3,102=4.6; P=0.004) and sand content (F 3,104=3.5; P=0.017); however, this was due to minor changes in the order of treatments within year. Overall there was a slightly higher DM percentage in the first year (35.5 v. 34.8; F 1,102=4.5; P=0.037), and treatments D6 and D9 had higher values for these two variables than treatment D12 (Table 5).
Mean dry matter (DM) and sand content (%) of manure sampled from the six manure belts

1 See Figure 1b for the position of the manure belts. The lay-out of the Table corresponds to a side-view of the rooms with the veranda on the left.
2 s.e.m.=pooled standard error of the mean.
abcdFor each variable means with different superscripts differ significantly (P⩽0.034).
Mean dry matter (DM) and sand content (%) of manure samples, as well as N and P (%) in faecal DM adjusted for sand for the four treatments

1 D6x, D6, D9, D12: Letter D followed by a number refer to stocking density (6, 9 or 12 hens/m2 floor area), ‘x’ indicates that access to the top tier has been blocked.
2 s.e.m.=pooled standard error of the mean.
abcFor means within DM and sand content, different superscripts indicate significant differences between treatment (P⩽0.003). For means within P, different superscripts indicate significant differences between treatments by year (P⩽0.031).
xyFor means within N different superscripts indicate a tendency to differ (0.10>P>0.05)
The percentage of N in manure DM (adjusted for sand) differed between the years (5.2 v. 5.6 (±0.05) for years 1 and 2, respectively; F 1,24=27.2; P<0.001). No differences were found between the two sampling locations (manure belts 3 and 6; see Figure 1b), but there was a significant effect of treatment (F 3,24=3.1; P=0.047), with a tendency for treatment D6 to have the lowest N-values (Table 5). For P in manure DM (adjusted for sand), a small, but significant overall difference between the two sampling locations were found (1.67 v. 1.73 (±0.01) % for manure belts 3 and 6, respectively; F 1,22=10.6; P=0.004). A significant interaction for P percentage was also found between flock/year and treatment (F 3,22=6.8; P=0.002; Table 5), with treatment D6 showing the lowest value, especially within the second year.
Manure weights
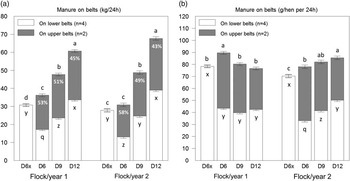
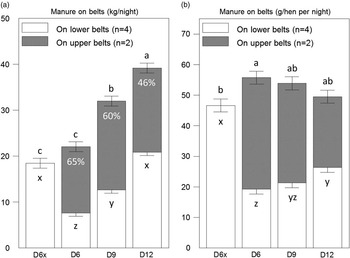
The total amount of manure deposited on the belts over 24 h differed significantly between treatments (F 3,151=655.2; P<0.001), but with a significant interaction with flock/year (F 3,151=18.9; P<0.001; Figure 4a). The amount of manure on the belts roughly reflected the group size, as only few differences were found when calculating the amount per hen, and these varied between years (F 3,149=24.3; P<0.001; Figure 4b). For treatments with access to the two upper belts, more manure was deposited here (relative to the number of belts) and this proportion was higher for treatment D6 than D12 (F 2,110=29.8; P<0.001; Figure 4a). No treatment interaction with year was found on manure deposited during the night with a significant increase with group size (F 3,19=79.4; P<0.001; Figure 5a). Across treatments, 64±1.3% of the manure on the belts was deposited during the night. The proportion of manure deposited at night on the upper belts was significantly smaller for treatment D12 (F 2,14=38.2; P<0.001), whereas treatments D6x and D12 deposited similar amounts on the lower belts (F 3,19=68.3; P<0.001; Figure 5a), resulting in a large difference between the lower belts for these two treatments when calculated per hen (F 3,19=62.1; P<0.001; Figure 5b). This would indicate that not all hens were able to spend the night on the aviary system in D12 (see also Figure 3). During the night, the amount of manure on the two belts under the top perches was significantly greater for treatments D9 and D12 (14.4, 19.3 and 18.3 kg, respectively for D6, D9 and D12; F 2,14=12.6; P=0.001). Thus, this amount of manure did not correspond to the mean number of hens observed on the top perches at night, which was similar among the three treatments (Figure 3a).
(a) Total amount of manure (kg adjusted for sand) and (b) amount (g) per hen on lower and upper belts over 24 h for the four treatments in each flock/year. The percentage on upper belts is indicated for treatments D6, D9 and D12. For each figure within each flock/year, bars with different letters differ significantly (a) abcd P<0.001; xyzq P⩽0.031; (b) abc P⩽0.005; xyzq P⩽0.083.

(a) Total amount of manure (kg adjusted for sand) and (b) amount (g) per hen on lower and upper belts during the night for the four treatments. The percentage on upper belts is indicated for treatments D6, D9 and D12. For each figure, bars with different letters differ significantly (a) abc P⩽0.001; xyz P<0.001; (b) ab P⩽0.034; xyz P⩽0.024).

Discussion
The current study aimed to investigate health, welfare and production consequences of increasing stocking density (6, 9 or 12 hens/m2 floor space) in organic egg production. It is not possible to change stocking density without changing at least one of its two components, either group size or room size. We chose to increase group size and keep the lay-out of the rooms the same, as this reflects better what happens in practice when stocking density is increased. This obviously creates additional differences between the treatments, most importantly the availability of nests, food troughs, nipple drinkers, and perches. However, we included a fourth treatment (D6x) in which hens kept at the lowest stocking density were barred access to the top tier, allowing us to disentangle – to a certain extent – the confounding effects of some of these additional treatment differences.
Health
Mortality in the present study (3%) was relatively low. Others have reported mortality levels of 3% to 8% in multi-tier aviaries (Abrahamsson et al., Reference Abrahamsson, Fossum and Tauson1998), but at higher stocking densities (17 hens/m2) and without outdoor access. Most studies on mortality do not include multi-tier systems with outdoor access (Michel and Huonnic, Reference Michel and Huonnic2004; Fossum et al., Reference Fossum, Jansson, Etterlin and Vågsholm2009; Lay et al., Reference Lay, Fulton, Hester, Karcher, Kjaer, Mench, Mullens, Newberry, Nicol, O’Sullivan and Porter2011). As a comparison, the median mortality in free-range and organic flocks in Denmark is 8% to 9% (E-kontrollen, 2013).
One of the benefits of a multi-tier system is the greater opportunity to hide or get away from aggressive or feather pecking conspecifics (Rodenburg et al., Reference Rodenburg, Tuyttens and Sonck2005). No outbreaks of feather pecking per se were detected in the present study, but the damage seen on tail feathers resembled that arising from feather pecking, whereas the neck feather damage was indicative of wear. The best plumage and the lowest incidence of pecked tail feathers were found in treatment D6. This is likely due to less competition for access to resources such as food and perches, but also a larger usable area in all three dimensions. In a floor system with access to perches, Nicol et al. (Reference Nicol, Gregory, Knowles, Parkman and Wilkins1999) found the highest incidence of feather pecking in the largest groups when comparing 72, 168, 264 and 368 hens per group (equivalent to 6, 14, 22 and 30 hens/m2). Although feather pecking is not socially facilitated, that is non-pecking hens do not start to feather peck because others do, a feather pecking hen in a larger group can do more damage simply because there are more hens to peck (Rodenburg et al., Reference Rodenburg, Tuyttens and Sonck2005). Nevertheless, Carmichael et al. (Reference Carmichael, Walker and Hughes1999) compared stocking densities from 10 to 19 birds/m2 at constant group sizes (n=300) and found only low levels of aggression and plumage damage and no differences in these measures among stocking densities. In the present study the daily access to forage is likely to have contributed to the absence of severe feather pecking and the low mortality, as also found by Steenfeldt et al. (Reference Steenfeldt, Kjaer and Engberg2007). Hens with access to an outdoor area have been found to show less aggressive pecking and feather pecking (Shimmura et al., Reference Shimmura, Suzuki, Hirahara, Eguchi, Uetake and Tanaka2008). Although all our hens had outdoor access, birds remained more inside in the larger groups (Steenfeldt and Nielsen, Reference Steenfeldt and Nielsen2015), thereby increasing the risk of being pecked. Inactive birds are also more at risk of being feather pecked (Riber and Forkman, Reference Riber and Forkman2007).
In the present study, breast redness and blisters were less common in hens in the D6 and D9 treatments, as was wear on the neck feathers. The former may reflect a higher level of activity for birds with the least constraints on access to space in three dimensions, as increased stocking density has been found to decrease locomotion (Appleby et al., Reference Appleby, Hughes and Hogarth1989; Channing et al., Reference Channing, Hughes and Walker2001). Neck feather wear may have reflected the increased competition for food in treatments D6x and D12 (see below). Foot pad dermatitis was so low as not to be registered, which is rare in organic production (for a review, see van de Weerd et al., Reference van de Weerd, Keatinge and Roderick2009). No causal factors were apparent for the higher incidence of bumblefoot in the second year.
Behaviour
Use of aviaries and perches
One of the benefits of a multi-tier aviary system is the access to all three dimensions of the available space, which increase movement and consequently bone strength (Nørgaard-Nielsen, Reference Nørgaard-Nielsen1990; Michel and Huonnic, Reference Michel and Huonnic2004). Carmichael et al. (Reference Carmichael, Walker and Hughes1999) found that of the space available to them in all three dimensions, the hens used about 80% of the pen volume independent of stocking density. However, hens do not spread themselves across the available area evenly, and Channing et al. (Reference Channing, Hughes and Walker2001) found that local densities varied between 9 and 41 hens per m2 at a mean stocking density of 18.5 hens per m2. In the present study, differences were found between treatments D6x and D6 in a number of measures (e.g. plumage score, breast blisters/redness, amount of manure on belts), indicating that increased vertical space affected the health and behaviour of the hens in a positive way, and independent of floor density. These two treatments also differed in trough space and perch length per hen, and these concomitant disparities may have contributed to the observed effects.
The top perches were used at maximum capacity during the night in all the groups which had access. The preference for the top perches led to an observed density of birds (12 cm/hen) higher than necessary given the availability of perches elsewhere. This confirms the preference of hens to roost on perches high above the ground (Olsson and Keeling, Reference Olsson and Keeling2000), which multi-tier aviary systems offer the possibility to do. Unsurprisingly, increasing stocking densities lead to more hens unable to find a perching place on top (Odén et al., Reference Odén, Keeling and Algers2002). In the present study, the number of hens unable to find a roosting place on top did not differ between teatments D6x and D9. This shows that an increase in stocking density from 6 to 9 hens per m2 floor area does not prevent more hens from top roosting than is usually seen in single-tier systems where equivalent top perches are not available.
We wanted to substantiate our video observations of perching by weighing the manure deposited underneath the top perches during the dark period. However, given that the same number of birds was observed on the top perches in all three treatments, the amount of manure should have been the same. The finding that more manure was found in treatments D9 and D12 may reflect the increased competition for the preferred top perches in these groups, with more birds trying to get access leading to a higher turn-over and more excreta being posited (Hart, Reference Hart1963) as the birds settled down for the night. Unfortunately, the video recordings were not sufficiently clear to enable precise scoring of disturbances among birds.
Access to food and water
Odén et al. (Reference Odén, Keeling and Algers2002) looked at multi-tiered systems with 10 to 19 hens per m2, and found that some hens appeared less able to access the food although at least 12.5 cm trough space was available per hen. Experience with multi-tier systems as pullets, especially with large vertical distances between food and water sources, can ensure a better adaptation to these systems during lay (Gunnarsson et al., Reference Gunnarsson, Yngvesson, Keeling and Forkman2000; Colson et al., Reference Colson, Arnould and Michel2008); the hens used in the present experiment had been reared in a system with vertical structures.
Higher stocking densities limit access to the trough, thus preventing birds from feeding simultaneously (Carmichael et al., Reference Carmichael, Walker and Hughes1999). In the present experiment, treatments D6x and D12 both had the least amount of trough space (10 cm per bird). This would have increased competition for access to food, in particular each time the chain feeders ran, as was also found by Carmichael et al. (Reference Carmichael, Walker and Hughes1999). One indication of this could be the increased wear on the neck feathers seen in these treatments. Also, the manure belts ran underneath the chain feeders, and another sign of increased competition comes from the manure weights. The amount of manure found on the lower belts during the day was considerably higher for treatment D6x than D6. This could indicate that hens in D6x spent more time during the day on the aviary system than D6, the latter also having the most wear of the outdoor area. Hens void more when feeding and when excited (Hart, Reference Hart1963) and the increased manure may reflect more agonistic interactions when access to feed is reduced to the minimum. Manure analyses results also reflected the differences between treatments in trough and perch access, with higher sand and DM content as well as lower N and P values in manure from treatment D6. The latter were not artefacts of differences in moisture or sand content, as the results were similar without these adjustments. The lower competition for feed in D6 may have prevented spillage, decreasing the amount of undigested food landing on the manure belt, thus resulting in lower values of N and P in the samples collected. Alternatively, just as stressed broilers have reduced nitrogen retention (Bonnet et al., Reference Bonnet, Geraert, Lessire, Carre and Guillaumin1997), the increased access to resources in general for treatment D6 may have led to reduced stress and less nitrogen excreted.
It is notable, that all access to resources (except floor space in D12) in the present experiment was within the minimum allowable in EU organic production. This could indicate that current EU minimum regulations are not set at a level which prevents adverse effects on health and behaviour. However, this experiment was not designed to test the minimum limits of access to resources other than floor space.
Conclusions
Increasing the stocking density in organic egg production systems using multi-tier aviaries did not significantly affect hen live weight, mortality, and foot health at indoor stocking densities ranging from 6 to 12 hens per m2. However, a large number of variables (plumage condition, presence of breast redness and blisters, pecked tail feathers, as well as perch use and feed competition) were indirectly affected by the increase in stocking density through the simultaneous reduction in access to other resources, mainly perches and troughs. The welfare of the hens was mostly affected by these associated constraints, despite all of them being within the allowed minimum requirements for organic production in the EU. Although these welfare consequences were assessed to be moderate (health measures, feed competition) to minor (perch use), it is important to take into account the concurrent constraints imposed on access to other resources if higher stocking densities are used in organic production. Results on laying behaviour, use of veranda and outdoor area are reported in Steenfeldt and Nielsen (Reference Steenfeldt and Nielsen2015)
Acknowledgements
The authors are grateful for the hospitality and collaboration of Arend (André) M. Hingstman, who owns and runs the organic egg production farm on which the study was carried out. They also thank Erik L. Decker, Henrik K. Andersen, Carsten K. Christensen, and Leif Rasmussen for their indispensable technical and practical assistance. This project was funded by Aarhus University and the Danish Ministry of Food, Agriculture and Fisheries.
Supplementary material
To view supplementary material for this article, please visit http://dx.doi.org/10.1017/S1751731115000725