INTRODUCTION
Fasciolosis is a worldwide distributed parasitic disease affecting a wide range of mammalian species, mainly ruminants, but also humans. In animals it causes significant reductions in productive parameters such as a decrease of body weight, milk production and liver condemnation at abattoirs. The causative agent, Fasciola hepatica, is a helminth parasite which can be found infecting animals in many countries throughout Europe, America and Oceania. In Africa and Asia F. hepatica overlaps with the species Fasciola gigantica. The prevalence of fasciolosis is increasing in certain parts of the world due to different causes such as climate change (Rojo-Vázquez et al. Reference Rojo-Vázquez, Meana, Valcárcel and Martínez-Valladares2012) and/or man-made environmental modifications (Martínez-Valladares et al. Reference Martínez-Valladares, Robles-Pérez, Martínez-Pérez, Cordero-Pérez, Famularo, Fernández-Pato, González-Lanza, Castañón-Ordóñez and Rojo-Vázquez2013b ).
The knowledge of the amount of the genetic variability is of crucial importance because since Darwin it is known that evolution and adaptation depends on the existence of heritable variability within a species to generate the differences between ancestral and descendant populations (Charlesworth and Charlesworth, Reference Charlesworth and Charlesworth2009). On the other hand, the distribution of the genetic diversity into and between populations allow us to infer the level of genetic flow, the effective population size, the mating system or the inbreeding level, among other characteristics (Allendorf et al. Reference Allendorf, Luikart and Aitken2013). These data can be used to construct models in order to predict the infection capacity of specific genotypes (Vázquez-Prieto et al. Reference Vázquez-Prieto, González-Díaz, Paniagua, Vilas and Ubeira2014). Therefore, the study of genetic variability of strains infecting the farm animals is essential to improve the understanding of parasite epidemiology and the control disease.
Up to date, several methods have been carried out to characterize genetically F. hepatica and determine its variability. Among them, Semyenova et al. (Reference Semyenova, Morozova, Chrisanfova, Asatrian, Movsessian and Ryskov2003) have described the random amplified polymorphic DNA (RAPD), which is based on the use of a single oligonucleotide with an arbitrary sequence that hybridizes with DNA; however, this technique has low specificity and reproducibility. Also Walker et al. (Reference Walker, Prodöhl, Fletcher, Hanna, Kantzoura, Hoey and Trudgett2007) used restriction fragment length polymorphisms (RFLP) to determine the genetic variability of different isolates of F. hepatica. There are different studies in which other techniques were described such as polymerase chain reaction (PCR) amplification of simple sequence repeat (SSR) (Hurtrez-Bousses et al. Reference Hurtrez-Bousses, Durand, Jabbour-Zahab, Guegan, Meunier, Bargues, Mas-Coma and Renaud2004), detection of sequence-related amplified polymorphism (SRAP) (Alasaad et al. Reference Alasaad, Li, Lin, Martín-Atance, Granados, Díez-Baños, Pérez and Zhu2008; Li et al. Reference Li, Dong, Zhang, Lin, Wang, Qian, Lun, Song and Zhu2009), use of allozyme markers (Vázquez-Prieto et al. Reference Vázquez-Prieto, Vilas, Mezo, González-Warleta, Ubeira and Paniagua2011) or sequence analysis of genomic and mitochondrial gene markers (Teofanova et al. Reference Teofanova, Kantzoura, Walker, Radoslavov, Hristov, Theodoropoulos, Bankov and Trudgett2011; Farjallah et al. Reference Farjallah, Slimane, Piras, Amor, Garippa and Merella2013; Martínez-Valladares and Rojo-Vázquez Reference Martínez-Valladares and Rojo-Vázquez2014).
Alternatively, Zietkiewicz et al. (Reference Zietkiewicz, Rafalski and Labuda1994) developed a PCR based on the amplification of inter-microsatellites markers. Inter-simple sequence repeats (ISSRs) are a type of DNA marker which involves the use of microsatellite sequences, repetition of a di-, tri- or tetranucleotide, as primers in the PCR (Gupta et al. Reference Gupta, Chyi, Romero-Severson and Owen1994; Zietkiewicz et al. Reference Zietkiewicz, Rafalski and Labuda1994). The resulting bands are sequences of genome between two identical microsatellite primers with an opposite orientation on the DNA strand (Zietkiewicz et al. Reference Zietkiewicz, Rafalski and Labuda1994). The ISSR technique is known to generate a large number of polymorphic bands. Moreover, this technique overcomes the technical limitations of RFLP and RAPD.
ISSR-PCR has already been used for others authors to study the genetic variability in parasites such as Trichinella (Fonseca-Salamanca et al. Reference Fonseca-Salamanca, Nogal-Ruiz, Benito, Camachot and Martínez-Fernández2006), Trypanosoma evansi (Njiru et al. Reference Njiru, Constantine, Gitonga, Thompson and Reid2007) and Schistosoma japonicum (Zhao et al. Reference Zhao, Li, Zou, Mo, Yuan, Lin, Weng and Zhu2009). However, the present study is the first report that uses this technique to study the genetic variation of different populations of F. hepatica from different geographical locations.
MATERIALS AND METHODS
Fasciola hepatica populations and DNA extraction
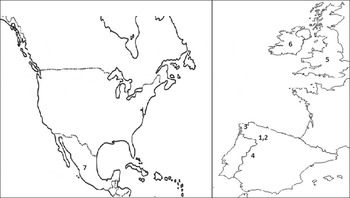
A total of 40 F. hepatica adults were collected from the livers of infected hosts belonging to the following geographical locations (Fig. 1): Sp1 (Toral de los Guzmanes, León; Spain), Sp2 (Torina, León; Spain), Sp3 (La Coruña; Spain), Sp4 (Cáceres; Spain), Eng (Shrewsbury/South Gloucester strain, Ridgeway Research Ltd Company; UK), Ir (Ireland) and Mex (México). The number of adults used per location is shown in Table 1. Individual flukes were washed extensively in physiological saline, identified morphologically to genus and species according to existing keys and descriptions (Yamaguti, Reference Yamaguti1958).
Locations of different populations of F. hepatica. 1: Sp1. 2: Sp2. 3: Sp3. 4: Sp4. 5: Eng. 6: Ir. 7: Mex.

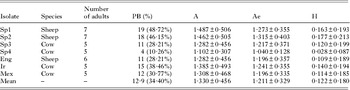
Number and percentage (%) of polymorphic bands (PB), number of alleles per locus (A), effective number of alleles per locus (Ae) and Nei's genetic diversity (H) per population

Total genomic DNA was extracted from a single piece of adult using the commercial kit SpeedTools Tissue DNA Extraction Kit (Biotools). DNA samples were resuspended in 60 μL of buffer BBE (5 mM Tris/HCl, pH 8·5) and stored at −20 °C until use.
ISSR-PCR amplification
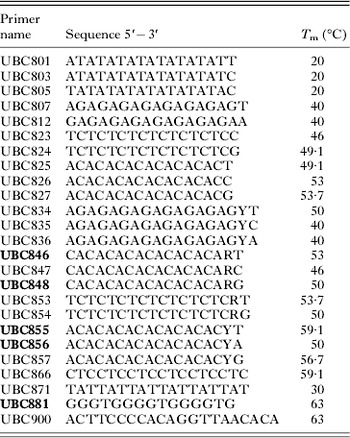
For ISSR-PCR analysis, 25 primers randomly selected from the University of British Columbia primer set #9 (UBC) (Table 2) were screened using seven pools of DNA from each population. Only the five primers which produced clear and reproducible bands (UBC846, UBC848, UBC855, UBC856 and UBC881) were selected (Fig. 2). Then, the ISSR-PCR was carried out with all individual samples of each population and with the five selected primers to construct a matrix in function of the presence or absence of bands.
ISSR-PCR with the selected primers. UBC846 (lanes: 1–7), UBC848 (lanes: 8–14), UBC855 (lanes: 15–21), UBC856 (lanes: 22–28) and UBC881 (lanes: 29–35). For each primer, seven pools of DNA from each location were used in the following order: Sp1, Sp2, Eng, Sp4, Sp3, Ir and Mex. M, marker.

Primers randomly selected from UBC (University of British Columbia) primer set #9

In bold letters, the primers selected for the study. Y=C/T. R=A/G.
The reaction mixture (20 μL) contained 0·4 μL Taq polymerase, 0·2 mm deoxynucleotide triphosphate (dNTP's), 1·5 μ m buffer+MgCl2, 0·5 μ m primers and 1 μL DNA diluted ten times of each individual of each population. The thermocycler used (Bio-Rad) was set to 2 min at 95 °C, followed by 40 cycles each of 30 s at 95 °C, 30 s at annealing temperature indicated in Table 2 for each primer and 90 s at 72 °C and finally an extension step at 72 °C for 10 min. The amplification products were analysed by electrophoresis in 1·5% agarose TBE (Tris base, boric acid and EDTA) gel, stained with GelRed and visualized by ‘Image Lab’ statistical software (Bio-Rad) to determinate the reproducible bands in each individual.
All amplifications were carried out in triplicate with the aim to confirm the results.
Data analysis
A matrix was constructed from amplified fragments in function of the presence (1) or absence (0) of bands. The fragments showing differences among samples were referred to as polymorphic bands (Li et al. Reference Li, Dong, Zhang, Lin, Wang, Qian, Lun, Song and Zhu2009). By the software POPGENE (1·32) (Yeh et al. Reference Yeh, Yang, Boyle, Ye and Mao1997) several variability parameters were estimated, such as the number and percentage of polymorphic bands, the number of alleles per locus (A), the effective number of alleles per locus (Ae), the Nei's genetic diversity (H), the total genetic diversity (Ht), the intrapopulation genetic variability (Hs) and the interpopulation differentiation (Gst). For the analysis of interpopulation relationships, Nei's distances were calculated and the resulting matrix was used to construct a dendrogram by UPGMA cluster analysis. Also, a bootstrap analysis (using 1000 replicates) was carried out by Phylip software package v3.69 (Felsenstein Reference Felsenstein2005) to confirm the robustness of the results. In order to visualize the genetic relationships among all samples, the Jaccard similarity index was estimated between all pairs, and a principal coordinate analysis (PCA) was performed by means of GenAIEx 6·501 (Peakall and Smouse, Reference Peakall and Smouse2012).
RESULTS
With the aim to determine the intra-specific variability of F. hepatica, five ISSR primers from UBC (UBC846, UBC848, UBC855, UBC856 and UBC881) were selected. These primers generated 13, 6, 5, 7 and 8 bands, respectively, 39 in total (average of 7·8 bands per primer), ranging from approximately 200 to 1000 bp (Fig. 2). Of these, 28 were polymorphic bands (71·79%) considering all the parasite populations. Per location, the number and percentage of polymorphic bands ranged from 10·26% in Sp4 to 48·72% in Sp1. Other parameters related with the variability within populations (A, Ae and H) are shown in Table 1.
The structure of variability among the studied adults from different populations was estimated by the parameters Ht, Hs and Gst (total, intrapopulations and interpopulations variability, respectively). The results were: Ht = 0·267, Hs = 0·121 and Gst = 0·547.
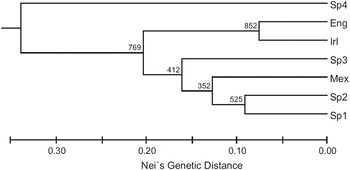
Data generated from ISSR-PCR, in function of the presence (1) or absence (0) of bands, resulted in a matrix of Nei's genetic distances. This was used to construct the UPGMA dendrogram (Fig. 3). According to the dendrogram, the adults from the Midwest of Spain (Sp4) were clearly different from the rest of samples. Within the cluster where most of the populations were present, small genetic distances were observed between some geographically close populations, Eng and Ir, on the one hand, and Sp1, Sp2, Sp3, from the Northwest of Spain, jointly with Mex, on the other (Fig. 3). We also analysed the Nei's distance taking into account the host of each sample, and this case the values ranged from 0·091 to 0·230 in sheep and from 0·150 to 0·337 in cattle.
Dendrogram constructed by the unweighted pair group method analysis (UPGMA), showing the genetic relation between the populations of the study. The numbers next to the nodes indicate the bootstrap values using 1000 replicates.

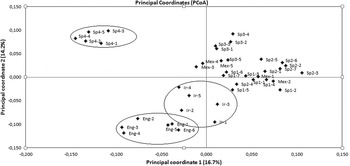
Additionally, the genetic relationships between all F. hepatica adults were determined by a PCA after calculating the Jaccard similarity index. As it is shown in Fig. 4, all adults from Sp4 were situated separately in a different group. Moreover, there is no differentiation between the adults from the populations Sp1, Sp2, Sp3 and Mex.
PCA plot (PC1 vs PC2) based on the Jaccard similarity index among all samples.

DISCUSSION
The ISSR-PCR has been described as an alternative for polymorphism studies (Zietkiewicz et al. Reference Zietkiewicz, Rafalski and Labuda1994). When ISSR markers are compared to others of similar characteristics, such as RAPDs or SRAPs, some advantages are noticeable. Thus, RAPDs reproducibility is considered poor, and they need a significant laboratory work to standardize protocols in order to obtain reliable results (Teofanova et al. Reference Teofanova, Hristov, Yoveva, Rdoslavov and Caiskan2012), while ISSRs are quite reproducible due to the use of longer primers allowing for higher annealing temperatures than those of RAPDs (Kojima et al. Reference Kojima, Nagaoka, Noda and Ogihara1998). On the other hand, SRAPs show less polymorphism than ISSRs due to the fact that SRAPs focus on genic regions. To detect as much genetic variability as possible, SRAPs are usually analysed in denaturing acrylamide gels, and in many cases the resulting banding pattern is very complex and difficult to score (Alasaad et al. Reference Alasaad, Li, Lin, Martín-Atance, Granados, Díez-Baños, Pérez and Zhu2008; Li et al. Reference Li, Dong, Zhang, Lin, Wang, Qian, Lun, Song and Zhu2009).
In this study we have used the ISSR-PCR technique for the first time in order to estimate the genetic diversity of F. hepatica adults from different geographical locations. The importance of population genetic structure studies lies in achieving an efficient management of the parasitic disease, specially nowadays, when the prevalence of the infection by F. hepatica is increasing in certain parts of the world (Rojo-Vázquez et al. Reference Rojo-Vázquez, Meana, Valcárcel and Martínez-Valladares2012; Martínez-Valladares et al. Reference Martínez-Valladares, Robles-Pérez, Martínez-Pérez, Cordero-Pérez, Famularo, Fernández-Pato, González-Lanza, Castañón-Ordóñez and Rojo-Vázquez2013b ) and resistant isolates to anthelmintics are appearing in different countries (Moll et al. Reference Moll, Gaasenbeek, Vellema and Borgsteede2000; Mooney et al. Reference Mooney, Good, Hanrahan, Mulcahy and de Waal2009; Martínez-Valladares et al. Reference Martínez-Valladares, Famularo, Fernández-Pato, Castañón-Ordóñez, Cordero-Pérez and Rojo-Vázquez2010, Reference Martínez-Valladares, Cordero-Pérez and Rojo-Vázquez2013a ; Olaechea et al. Reference Olaechea, Lovera, Larroza, Raffo and Cabrera2011).
After carrying out the ISSR-PCR in 40 adult specimens from seven different locations, some parameters related with the genetic variability within each isolate have been calculated. In this case, the total number of polymorphic bands reported in the present study was high (71·79%), meaning that this technique can yield a significant number of polymorphic markers that can be useful in Fasciola population studies. However, when individual populations are considered, the level of polymorphic bands is quite lower, ranging between 10·26% in Sp4 and 48·72% in Sp1. This relatively low range of genetic diversity within populations, with a mean of 34·40%, implies that a large proportion of variation resided among populations. Similar results were published by Zhao et al. (Reference Zhao, Li, Zou, Mo, Yuan, Lin, Weng and Zhu2009) when the ISSR-PCR was used to study the genetic variability of three populations of S. japonicum and found a total of 74·77% of polymorphic bands, ranging from 19·63 to 64·49%. However, when these authors compared two different species, S. japonicum and S. mansoni, the total percentage of polymorphic bands was significantly higher, 98·13%. On the other hand, the value of A, or the number of alleles per locus, was also the highest in Sp1 and the lowest in Sp4. The value of Ae considers not only the real number of alleles in the populations (A), but also whether they present an even distribution. When A and Ae present the same values, the population has reached the maximum genetic variability (heterozygosity) taking into account its allelic diversity. In this study, all populations showed values of Ae lower than A, which indicates that the populations have not reached the maximum variability possible because one the alleles was more frequent than the other in the polymorphic loci. According to all these parameters, Sp4 presents the lowest level of diversity. No individuals with repeated multilocus genotypes were found in any population, thus there was no need to consider the presence of clones and the effects they have on the genetic variability parameters.
In our study, the population differentiation or Gst was 0·547, indicating that 54·7% of the genetic variation is due to differences between populations vs to 45·3%, due to differences between individuals in each population. This result points out a high level of genetic structuration, which is also reflected in the values of Nei's genetic distances, ranging from 0·091 to 0·337. The population Sp4 is the main contributor to the high value of population differentiation because of its unique characteristics; when the analysis was carried out excluding this population, the Gst value lowers to 0·308.
In any case, this result contrasts with that obtained by Vázquez-Prieto et al. (Reference Vázquez-Prieto, Vilas, Mezo, González-Warleta, Ubeira and Paniagua2011), which studying three Spanish populations from cattle using allozyme markers, reported a level of population differentiation of 0·006, and a range of Nei's genetic distances between 0·003 and 0·010. A low level of population differentiation (0·078) was also found by Morozova et al. (Reference Morozova, Ryskov and Semyenova2002) using RAPDs markers. These important differences between studies could be due to the fact that the samples of the study carried out by Vázquez-Prieto et al. (Reference Vázquez-Prieto, Vilas, Mezo, González-Warleta, Ubeira and Paniagua2011) were collected within a specific region of the Northwest of Spain (Galicia), and all the samples of Morozova et al. (Reference Morozova, Ryskov and Semyenova2002) were isolated from to the same Ukrainian cattle population.
On the other hand, Vilas et al. (Reference Vilas, Vázquez-Prieto and Paniagua2012) also studied F. hepatica populations from cattle and sheep in this same region of Spain (Galicia), than Vázquez-Prieto et al. (Reference Vázquez-Prieto, Vilas, Mezo, González-Warleta, Ubeira and Paniagua2011), although in this case sampling a higher number of populations and using allozyme and microsatellite markers at the same time. The range of variation of Nei's genetic distance calculated between populations was 0·023–0·094 in cattle and 0·033–0·156 in sheep and the Fst (equivalent to Gst) values were 0·087 and 0·170 for cattle and sheep, respectively. These authors suggested that parasites of sheep appear to show significantly more structured variation at the infrapopulation level. However, the range of Nei's distance found in our study for sheep (0·091–0·230) was lower than for cattle (0·150–0·337), between 0·091 and 0·230, showing less structured variation. In addition, in their study the expected heterozygosity (H) was 0·411 and 0·360 on average in cattle and sheep, respectively, while in our study, it ranged between 0·109 and 0·177 (excluding Sp4). The higher level of genetic diversity in the study of Vilas et al. (Reference Vilas, Vázquez-Prieto and Paniagua2012) can be mainly attributed to the fact that the analysed markers cannot be considered as a random sample of loci: firstly, the chosen isozymatic loci were those previously known as polymorphic in their populations, and secondly, they used microsatellite markers which usually are highly polymorphic detecting many alleles per locus; whereas the ISSR-PCR detected two alleles based on the presence or absence of band, and all the loci were scored, whether or not polymorphic.
Using SRAP markers, Alasaad et al. (Reference Alasaad, Li, Lin, Martín-Atance, Granados, Díez-Baños, Pérez and Zhu2008) studied the F. hepatica genetic variability by analysing Spanish samples from several different hosts and geographical localities and described a low level of genetic variation in F. hepatica. This observation may be because the SRAP markers target sequences belonged to coding regions of the genome and these regions have lower mutation rates due to their functional constraints (Crow, Reference Crow2000). The authors also related this observation to the cycle of Fasciola spp., which would act against speciation processes, decreasing at the same time their genetic variability and allowing the infection for new host species (Vara-Del Río et al. Reference Vara-Del Río, Villa, Martinez-Valladares and Rojo-Vázquez2007). Supporting this hypothesis, Alasaad et al. (Reference Alasaad, Li, Lin, Martín-Atance, Granados, Díez-Baños, Pérez and Zhu2008) could not find any association between F. hepatica genetic characteristics and their hosts and/or region.
In the present study, both UPGMA (Fig. 3) and PCA analysis (Fig. 4) grouped populations into similar clusters, which showed a fair accordance. Both methods showed a clear genetic differentiation of Sp4, and a clustering of the samples related to their geographical origin. Thus, the three samples from the North West of Spain (Sp1, Sp2 and Sp3), and those from Ireland (Ir) and Great Britain (Eng) cluster in the same groups. The genetic relationships between samples from Sp1, Sp2 and Sp3 are less clear, as can be inferred from the low bootstrap values of the groups shown in Fig. 3 (a method to establish the robustness of the clusters), and from PCA analysis (Fig. 4) that showed intermixed some of the samples from this populations. Similarly to Alasaad et al. (Reference Alasaad, Li, Lin, Martín-Atance, Granados, Díez-Baños, Pérez and Zhu2008), but in contrast with Vilas et al (Reference Vilas, Vázquez-Prieto and Paniagua2012), no association between F. hepatica genetic characteristics and their hosts have been found in this study.
From the grouping analysis, the position of two populations, Sp4 and Mex, deserves further comments. There are several reasons that could explain the fact that the samples from Sp4 are genetically different from the rest of the Spanish populations. Regarding the strain Sp4 located in Cáceres (in the Midwest of Spain), it is possible that the strain had entered into Spain from the North of Africa during the period of Moorish rule with infected cattle. We are aware of the native Spanish population of cows that have African origin (Beja-Pereira et al. Reference Beja-Pereira, Caramelli, Lalueza, Vernesi, Ferrand, Sampietro, Casoli, Goyache, Royo, Conti, Lari, Martini, Ouragh, Magid, Atash, Boscato, Triantophylidis, Ploumi, Sineo, Mallegni, Taberlet, Erhardt, Bertranpetit, Barbujani, Luikart and Bertorelle2006), as it is confirmed by mitochondrial studies. On the other hand, the genetic differentiation of Sp4 can be associated with a reproductive isolation of the strain due to the low density of the parasites in that area, restricting the possibilities of exchanging genetic material with other strains.
On the order hand, the results of the PCA show that there is no differentiation between the adults from Sp1, Sp2, Sp3 and Mex, in agreement with the low bootstrap values calculated in the UPGMA analysis between the Spanish and Mexican populations. This similarity between samples from different locations can be explained by a common origin, since cattle and sheep were repeatedly introduced in America during the colonization leading to a rapid spreading of the parasite from Spain to Mexico by means of infected animals.
Concluding remarks
In the present study, we have used for the first time the ISSR-PCR to study the genetic diversity of F. hepatica populations from different countries – Spain, UK, Ireland and Mexico. This technique provided us with a high number of polymorphic markers and showed that the genetic diversity is structured, being the intrapopulation variability at the same level that the interpopulation differentiation. All populations grouped separately from one population from de Midwest of Spain. Within the cluster where most of the adults are present, small genetic distances were observed between some geographically close populations, UK and Ireland, on the one hand, and the rest populations from Spain and Mexico, on the other.
ACKNOWLEDGEMENTS
The authors thank Dr Manga-González (Instituo de Ganadería de Montaña de León, Spain) her collaboration for collecting the samples, and especially Dr Quiroz-Romero (National Autonomous University of Mexico, Mexico), Dr McCarthy (University College Dublin, Ireland), Dr Paz-Silva (University of Santiago de Compostela, Spain) and Dr Valcárcel (CISA, Spain) for providing the F. hepatica adults.
FINANCIAL SUPPORT
This study has been funded by the national project INIA-MEC, RTA2010-00094-C03-02. The work of María Martínez-Valladares has been supported by a postdoctoral Jae-Doc contract from the Consejo Superior de Investigaciones Científicas (CSIC) and co-funded by the European Social Fund.