Introduction
There is unequivocal evidence that nicotinic acetylcholine receptors are found in the inner retina of virtually all species, and it is generally believed that such receptors are found on bipolar, amacrine, and ganglion cell processes (Zucker & Yazulla, Reference Zucker and Yazulla1982; Keyser et al., Reference Keyser, MacNeil, Dmitrieva, Wang, Masland and Lindstrom2000; Liu et al., Reference Liu, McGlinn, Fernandes, Milam, Strang, Andison, Lindstrom, Keyser and Stone2009). Acetylcholine, itself, has been localized to starburst amacrine cells (Masland & Mills, Reference Masland and Mills1979) of which there are two populations in most retinas (Masland et al., Reference Masland, Mills and Hayden1984). One population has its cell bodies in the inner nuclear layer, and the other in the ganglion cell layer. Starburst amacrine cells also contain gamma- aminobutyric acid (GABA), and the starburst cells have been shown to play a critical role in mediating direction-sensitive (ds) responses in certain ganglion cells (Caldwell et al., Reference Caldwell, Daw and Wyatt1978; Yoshida et al., Reference Yoshida, Watanabe, Ishikane, Tachibana, Pastan and Nakanishi2001).
Present evidence indicates that GABA inhibition of bipolar cell terminals presynaptic to the ds-ganglion cells as well as direct inhibition of the dendrites of the ds-cells mediates the ds-responses (Fried et al., Reference Fried, Munch and Werblin2002). Acetylcholine is also released by the starburst cells (O’Malley et al., Reference O’Malley, Sandell and Masland1992), but what role acetylcholine plays remains unknown. Ariel and Daw (Reference Ariel and Daw1982) showed many years ago that physotigmine, an antagonist to acetylcholinesterase, when applied to ds-cells of the rabbit retina increased the activity of the cells to light stimuli but did not affect the direction-sensitivity of the cells. That is, the response to a moving stimulus in the preferred direction was enhanced by the increased acetylcholine, and although some response in the null direction could now be elicited, it was a weaker and smaller response than that elicited by stimuli moving in the preferred direction. When GABA antagonists were applied to ds cells, on the other hand, direction sensitivity was essentially lost; responses to stimuli moving in the null direction were virtually the same as those moving in the preferred direction (Caldwell et al., Reference Caldwell, Daw and Wyatt1978). Earlier studies (Masland & Ames, Reference Masland and Ames1976) had shown that acetylcholine increased basal levels of ganglion cell activity, as well as the responses of the cells to light, in agreement with the Ariel and Daw study. Together, the studies suggested that acetylcholine acts to enhance or bias ganglion cell activity but not to impart ds.
At the present time, the effect of acetylcholine on bipolar cells is unknown. Some experiments have examined the effects of acetylcholine, nicotine, and nicotine antagonists on the electroretinogram (ERG) b-wave that arises mainly from ON-bipolar cells (see Robson & Frishman, Reference Robson and Frishman1999), but the results are somewhat contradictory and equivocal. In 1996, Jurklies et al. showed that cholinergic agonists enhanced the b-wave particularly under photopic conditions. However, mecamylamine, a nicotinic antagonist, initially decreased photopic b-wave amplitudes at low concentrations but enhanced b-wave amplitudes at high concentrations. Voltage–intensity curves were not determined; most of the records shown were obtained with a single light intensity in either the dark or the light-adapted state.
In a more recent paper (Varghese et al., Reference Varghese, Reid, Hartmann and Keyser2011), the effects of nicotine were studied in humans who were given nicotine gum 30 min before ERG testing. Under scotopic conditions, the nicotine caused a decrease in b-wave amplitude, and in one set of experiments, the nicotine caused a decrease of b-wave amplitude under photopic conditions. In another set of experiments, there appeared to be an increase in the amplitude of the b-wave under photopic conditions. The amplitude changes were small, and no effects of nicotine on the a-wave (photoreceptor responses) were observed.
Here we have exposed zebrafish larvae to various concentrations of nicotine (5–40 µM) and measured V–log I curves over 5–6 log units of intensity in both control and in mutant fish that have no cone function. Zebrafish larvae are cone dominant at early stages of development, and abundant rods only appear by 2–3 weeks of age. However, small rod responses at low light intensities can be detected in control animals as well as in mutant animals without cone function. Thus, we were able to separate clearly the effects of nicotine on rod and cone b-wave function in zebrafish larvae 5-days old.
Materials and methods
Zebrafish maintenance
Zebrafish were maintained on a 14-h light (1.2 × 10² µW/cm2 at 500 nm) and 10-h dark cycle (Westerfield, Reference Westerfield2000). All experiments were performed on AB wild-type strain larvae at 5 dpf, and on no optokinetic response f (nof) mutants (Brockerhoff et al., Reference Brockerhoff, Rieke, Matthews, Taylor, Kennedy, Ankoudinova, Niemi, Tucker, Xiao, Cilluffo, Fain and Hurley2003) of the same age. Zebrafish larvae were obtained by matings in our laboratory colony and maintained according to standard procedures (Westerfield, Reference Westerfield2000). All procedures and experimental protocols were in accordance with the guidelines of the European Communities Directive (86/609/EEC, 2003/65/EC and 2010/63/EU) and conformed to NIH guidelines.
Drug treatment
Nicotine hydrogen tartrate salt was purchased from Sigma-Aldrich (N5260, Sigma-Aldrich, St. Louis, MO). Stock solutions of 1 mM were diluted in fish water to achieve final concentrations. Animals were exposed to 5, 10, 20, and 40 µM nicotine from the 21 somite stage (19.5 hpf) to 5 dpf or for 24 h beginning on day 4 pf. Groups of 50 embryos maximum were exposed in a petri dish. The medium with nicotine was renewed every 8 h to maintain a constant concentration. Results obtained from embryos in different petri dishes were always consistent. Untreated embryos were used as control specimens.
Electroretinography
All ERG recordings were performed using the isolated eye preparation as previously described (Wong et al., Reference Wong, Gray, Hayward, Adolph and Dowling2004; Emran et al., 2007; Emran et al., 2010). Using a binocular microscope for positioning of the larvae, one eye was removed using a fine tungsten wire loop, placed on 4% agarose, and superfused with Ringer’s solution containing nicotine. The Ringer’s solution was maintained at pH 7.8 by continuously gassing it with approximately 97% O2 and 3% CO2. For ERG measurements of dark-adapted animals, the eye surgery was performed under dim red (670 nm) light. Responses were recorded as previously described (Emran et al., 2007). The isolated eye was placed with the cornea facing up at the center of the stimulus light (diameter 5 mm) from a halogen light source. The light source had a maximum intensity of 5.3 × 10⁴ µW/cm2 at 500 nm, through a UV blocking filter. The light beam was attenuated with neutral density filters. Responses were recorded by placing an electrode with a tip diameter of 15–30 µm under the lens and close to the surface of the retina using an anterior transscleral approach. The reference electrode was placed within the agarose in the recording chamber. Using custom written software in IGOR Pro (Wave Matrics), three to six consecutively elicited ERGs were typically averaged in response to 1 s flashes of light presented at 8-s intervals. ERGs were amplified at 1000 total gain and low pass filtered at 300 Hz. The b-wave amplitudes were measured from the trough of the a-wave (when observed) to the peak of the b-wave.
Statistics
Results are expressed as mean ± S.E.M. Statistical analysis was performed with GraphPad Prism 4 (GraphPad Software Inc., San Diego, CA).
Results
Effects of nicotine on wild-type larvae
The ERG records the summed electric field potential of the retina in response to light flashes and is a sensitive physiological tool to assess radial retinal cell function (i.e., photoreceptor and bipolar cells) (Dowling, 2012). In zebrafish larvae, the ERG is dominated by a prominent b-wave that reflects mainly the responses of ON-bipolar cells (Wong et al., Reference Wong, Gray, Hayward, Adolph and Dowling2004). The b-wave largely masks the response of the photoreceptors; the a-wave is not generally seen unless bright flashes are used. We treated AB strain larvae with different concentrations of nicotine ranging from 5 to 40 µM and used 1-s light stimuli. We elicited ERG responses over an intensity range of 5–6 log units.
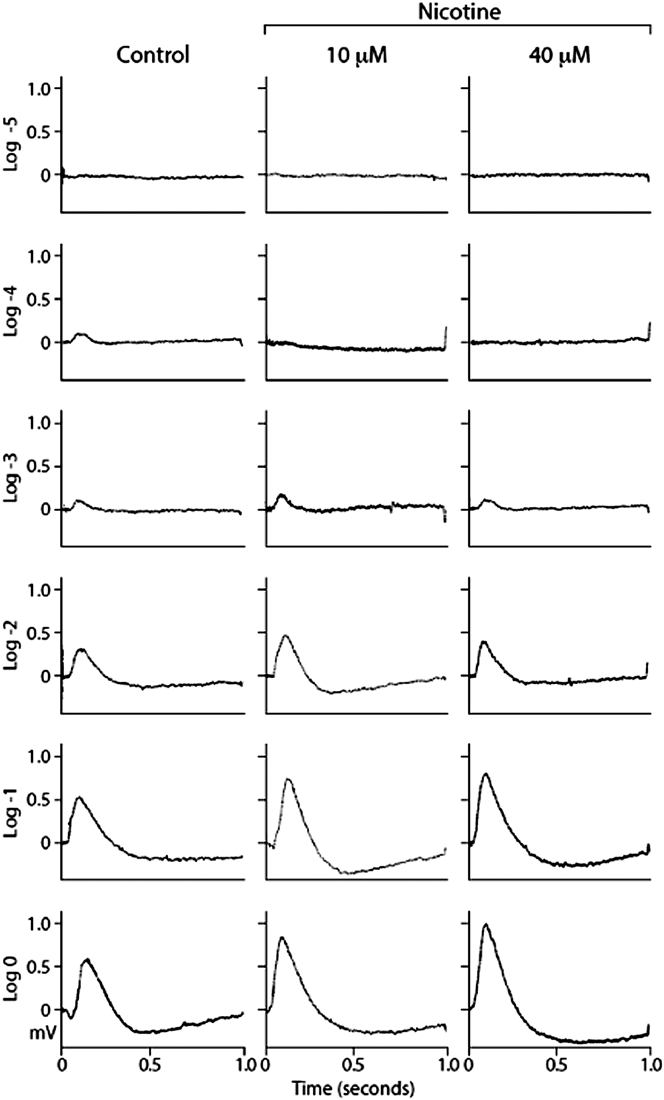
In control animals (Fig. 1), we observed a clear b-wave response at log I = −4, and with increasing flash intensities, the b-wave grew larger reaching a peak amplitude with the brightest light tested (log I = 0). In control animals, an a-wave was not observed except with the brightest flash (log I = 0).
Representative ERG traces from a control eye and eyes from animals exposed to nicotine at concentrations of 10 and 40 µM [all the animals were 5-day postfertilization (pdf)]. The ERGs were elicited over a range of light intensities (log I = −5 to 0), and the scale to the left of each set of traces is in millivolts (mV). Note that at log I = −4, only the control eye gave a substantial response, whereas at all intensities at and above log I = −2, the responses of the drug-treated animals were substantially larger than the control responses. The light stimuli lasted for 1 s and came on at time = 0.

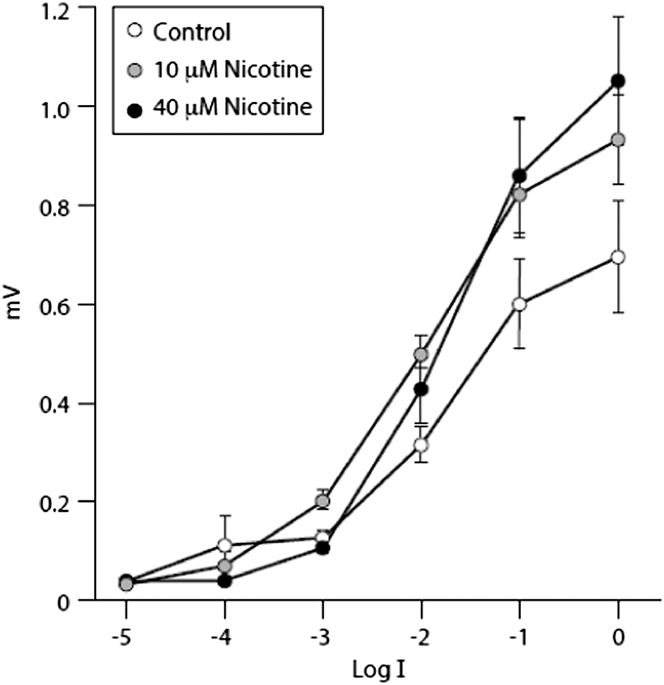
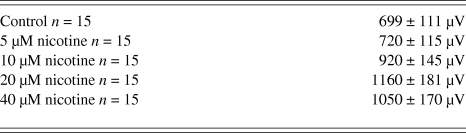
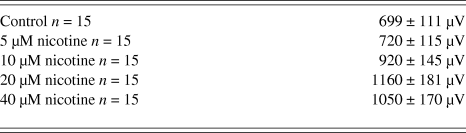
In response to all concentrations of nicotine applied, two consistent changes in the ERG were noted (Figs 1 and 2). First, with a dim flash (log I = −4), there was a decrease or loss of the b-wave. With brighter flashes (log I = −2 and greater), the b-wave amplitude was increased, and at the highest doses (20 and 40 µM) of nicotine, the increase was striking. Maximum response amplitudes at log I = 0) are listed in Table 1. Although b-wave amplitudes were enhanced at all light-intensities (except for the dimmest intensities), there was no significant change in the b-wave sensitivity to light. In other words, the V–log I curves remained essentially in the same place on the intensity axis at all nicotine concentrations. These effects of nicotine were similar whether the fish were exposed to nicotine for 1 (not shown) or 4 days (Figs. 1 and 3).
Voltage–intensity curves for the ERG b-wave recorded from eyes of control animals and those exposed to 10 and 40 µM nicotine at 5 dpf. The nicotine caused a decrease in the b-wave response at log I = −4 but a substantial increase in the b-wave amplitude at intensities of log I = −2 and above. After exposure to 20 and 40 µM nicotine, maximum b-wave amplitudes were over 1 mV. n = 15 for all data points. Error bars are standard errors of the mean (±S.E.M.).
Maximum b-wave amplitudes elicited with a flash intensity of log I = 0 in fish exposed to nicotine for 4 days
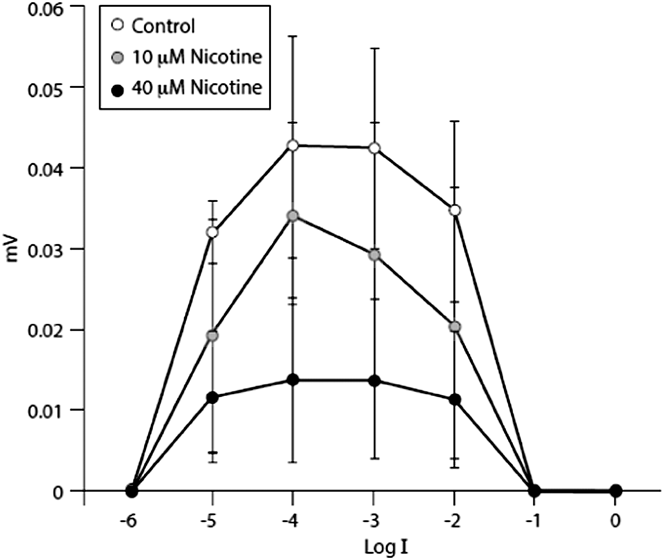
ERG b-wave intensity response curves recorded from the eyes of nof mutant fish that have no cone function. All animals were 5 dpf, and n = 10. When fully dark-adapted small responses could be recorded at log I = −5, −4, and −3 (up to ∼40 µM), but response amplitudes at log I = −2 were decreased. At log I = −1 and 0, no responses could be recorded presumably due to rod saturation. After nicotine treatment, all elicited responses were smaller in amplitude. Error bars are standard errors of the mean (±S.E.M.; see text).
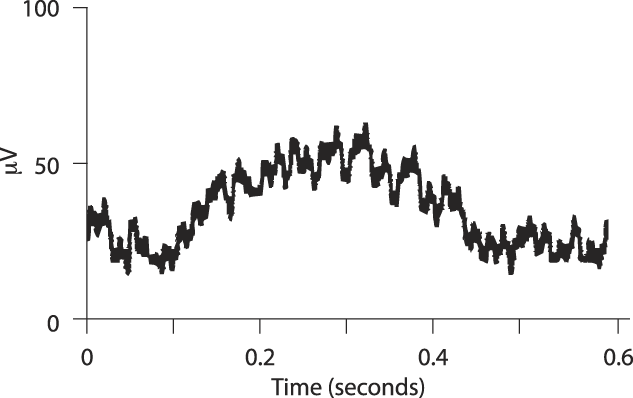
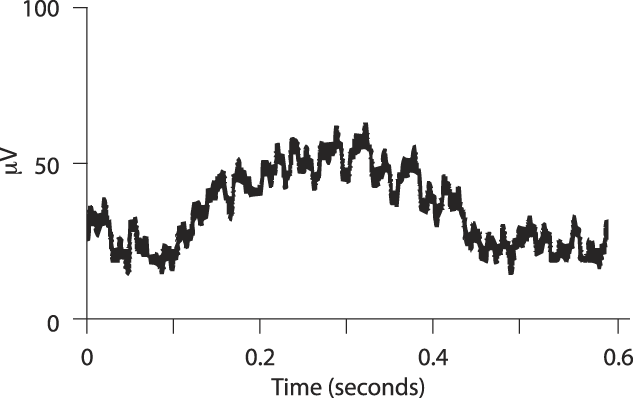
ERG response recorded from a dark-adapted untreated nof mutant eye at an intensity of log I = −4. A small a-wave is followed by a 40–50 μV b-wave. The light stimulus was 1 s long and came on approximately 60 ms before time = 0. The peak of the b-wave occurred at about 350 ms after the stimulus light came on.
The largest increase in amplitude was observed following the 20 µM dose of nicotine and was an increase of 66%. At a concentration of 40-µM nicotine, the maximum amplitude often decreased somewhat, suggesting that 20-µM nicotine may be the saturating concentration. However; the stimulus interval may have been too short (8 s) at log I = 0 to allow complete recovery from the previous flash. Interestingly, whereas an a-wave is usually readily observed with bright stimuli in control fish, a-waves were seldom seen after nicotine treatment (Fig. 1). Examination of b-waves elicited with bright stimuli in nicotine-treated animals showed that the latency of the b-wave decreased after nicotine treatment suggesting that the absence of an a-wave in these recordings is not due to an effect of nicotine on the a-wave, but further masking of the a-wave by a faster and larger b-wave. Indeed, measurements (n = 5) of b-wave latency elicited with the brightest flash (log I = 0) after treatment with 40-µM nicotine showed a decrease of b-wave latency of about 65% (140 to 97 ms).
We interpret our data to mean that nicotine substantially enhances cone b-wave activity and quickens it but may depress rod b-wave responses. However, as noted earlier, zebrafish larvae are highly cone dominant, and rod responses are difficult to isolate because of the very large cone responses. Therefore, we turned to a mutant (nof) fish that has no cone function to better evaluate the effects of nicotine on the rod-driven b-wave.
Effects of nicotine on the nof mutant
The nof mutant has a point mutation in the second intron of the α-subunit of the cone transducin (Tcα) gene, rendering it nonfunctional. All four types of cones in nof have undetectable levels of the Tcα protein. Not surprisingly, nof cones do not respond to photopic light stimulation (Brockerhoff et al., Reference Brockerhoff, Rieke, Matthews, Taylor, Kennedy, Ankoudinova, Niemi, Tucker, Xiao, Cilluffo, Fain and Hurley2003), but this enables recordings from the relatively few rods that exist at this point in zebrafish development.
In nof mutants, it is possible to record slow small b-wave responses over a range of 4 log units (log I = −5 to −2) (Fig. 3). The maximum amplitude is about 40 µV, and that is observed at a light intensity of log I = −4. Fig. 4 shows the response recorded from a nof mutant eye that was untreated. A small a-wave followed by a b-wave is evident in the recording. At light intensities brighter than log I = −3, the b-wave response declines in amplitude and at log I = −1 or 0, no b-wave at all is recorded (Fig. 3), perhaps due to rod saturation. The use of much longer interstimulus intervals than 8 s might have allowed the recording of responses at the brighter light intensities.
With a nicotine concentration of 5 and 10 µM, a decrease in b-wave amplitude was observed at all light intensities, but because of the small rod response amplitudes in nof animals, the data are not significant (P = 0.61 and 0.46, respectively). However, at a concentration of both 20 and 40 µM nicotine, the decrease in b-wave amplitude is significant (P = 0.05 and 0.04, respectively). Indeed, the decrease in average b-wave amplitude is about 69% at a concentration of 40 µM nicotine. Interestingly, nicotine again had essentially no effect on b-wave sensitivity in the nof mutant; the V–log I curves did not shift along the intensity axis with increasing concentrations of nicotine (Fig. 3).
Discussion
Our results clearly show that nicotine enhances greatly cone-driven b-wave amplitudes in larval zebrafish but significantly depresses rod-driven b-wave amplitudes. These results clarify and extend the earlier results in rabbits (Jurklies et al., Reference Jurklies, Kaelin-Lang and Niemeyer1996) and humans (Varghese et al., Reference Varghese, Reid, Hartmann and Keyser2011) that suggested nicotine may enhance the b-wave under photopic conditions and decrease the b-wave under scotopic conditions. Whereas nicotine greatly altered both cone- and rod-driven b-wave amplitudes, it did not affect the sensitivity of the responses. In other words, the V–log I curves of both the cone- and rod-driven b-wave responses remained in the same position on the intensity axis. Thus, nicotine alters the amplitude of b-wave responses but not the sensitivity of the responses to any great extent regardless of nicotine concentration.
In mammals, there are generally separate cone and rod bipolar cells (but see Pang et al., Reference Pang, Gao, Lem, Bramblett, Paul and Wu2010) and nicotine could have opposing effects on these two classes of ON-bipolar cells. In zebrafish, however, whereas there are bipolar cells that receive input only from cones, all the bipolar cells that receive rod input also have cone input (Li et al., Reference Li, Tsujimura, Kawamura and Dowling2012). However, of the four mixed rod-cone bipolar cells in zebrafish, one has the great majority (6 times) of its input from rods; the others have more (1.5–4 times) input from cones than rods. Also, all the rod-dominated bipolar cells are ON-cells, whereas most of the bipolar cells receiving mixed rod-cone input are OFF-cells or ON–OFF cells. It may be that the rod dominant mixed bipolar cell is the main contributor to the scotopic b-wave in zebrafish, and it is this cell whose activity is strongly depressed by nicotine, whereas the other ON-bipolar cells give a mixed or no response to nicotine. In nof mutants, the mixed rod-cone bipolar cells receive no cone input.
As yet, no one has reported nicotine receptor currents recorded from bipolar cells in any species. On the other hand, several anatomical studies have provided evidence that nicotine receptors and their subunits are present on bipolar cells in various retinas, including goldfish, rabbit, and primate (Zucker & Yazulla, Reference Zucker and Yazulla1982; Yamada et al., Reference Yamada, Dmitrieva, Keyser, Lindstrom, Hersh and Marshak2003; Dmitrieva et al., Reference Dmitrieva, Strang and Keyser2007; and see Liu et al., Reference Liu, McGlinn, Fernandes, Milam, Strang, Andison, Lindstrom, Keyser and Stone2009 for a review). Our results suggest that examining the effects of nicotine on bipolar cells will be worthwhile and of interest.
It is unclear how nicotine affects b-wave amplitudes. Assuming that the b-wave in zebrafish directly reflects ON-bipolar cell responses, our data suggest that nicotine increases the light response in cone ON-bipolar cells but decreases the light response in rod ON-bipolar cells, but how this is mediated is unclear. Bipolar cell light responses are believed to be generated in the outer plexiform layer (OPL), as a result of synaptic input onto the bipolar cells from the photoreceptors. In larval zebrafish, Arenzana et al. (Reference Arenzana, Clemente, Sanchez-Gonzalez, Porteros, Aijon and Arevalo2005) have observed processes containing choline acetyltransferase (ChAT) in the OPL, and it may be that these processes are the source of the acetylcholine that affects the bipolar cells. The processes containing ChAT gradually disappear as the larvae mature, and in the adult zebrafish processes containing ChAT are found only in the IPL. An obvious question is what effects acetylcholine has on b-waves in the adult zebrafish retina. As noted earlier, nicotine enhances ganglion cell responses to light, and our results may suggest that part of this enhancement could be caused by enhanced cone ON-bipolar cell responses to light under photopic conditions at least in larval fish.
With regard to the role of acetylcholine in retinal function, we can add little. Whereas zebrafish do appear to have direction-selective ganglion cells as well as starburst amacrine cells, the details of the anatomy and physiology of the cholinergic system in the zebrafish inner plexiform layer (IPL) are not well worked out. Some immunohistochemical staining of cholinergic processes in zebrafish suggest more complexity in terms of strata in the IPL to which the cholinergic processes contribute (Yazulla & Studholme, Reference Yazulla and Studholme2001). That is, in most species examined, cholinergic processes are observed only in strata 2 and 4 in the IPL, but in zebrafish, cholinergic processes are observed in strata 1 and 5 as well. What this means is not understood.
As noted in the Introduction section, acetylcholine does not appear to play a significant role in mediating direction-selectivity in ganglion cells, although it is present in and released by the starburst amacrine cells. But the exact role in the adult retina is still unknown. A role for acetylcholine in the developing retina is clear, however, and that is to mediate the spontaneous waves of ganglion cell activity that propagate across the retina before the retina is light-sensitive (Feller et al., Reference Feller, Wellis, Stellwagen, Werblin and Shatz1996). During development, conventional synapses, typical of amacrine cell synapses, are seen in the IPL before there are any light evoked responses (McArdle et al., Reference McArdle, Dowling and Masland1997), and it is likely these synapses are between amacrine cells and between amacrine and ganglion cells. Initially, the waves are mediated exclusively by acetylcholine, but later glutamate also contributes to wave generation. It is believed that these waves are critical for the development and refinement of ganglion cell projections to higher visual centers. So, for example, if retinal activity is stilled in an eye by pharmacological manipulation, the segregation of eye-specific input to the lateral geniculate nucleus is disrupted (Shatz & Stryker, Reference Shatz and Stryker1988) and it is believed that this relates to the absence of the waves. With regard to wave generation, the presumption is that uncorrelated spontaneous activity in amacrine cells converges onto ganglion cells, producing correlated activity in groups of ganglion cells (Feller et al., Reference Feller, Butts, Aaron, Rokhsar and Shatz1997).
With time, the waves disappear, as light-driven responses appear during development, so that such waves are not observed in the adult retina. But what role acetylcholine plays in the adult retina remains an enigma. As noted in the Introduction section, acetylcholine does appear to bias activity levels in ganglion cells, and this might be its major role. If so, our results suggest that not only is this biasing mediated by the starburst cells synapsing directly on ganglion cells and other amacrine cells, but also, perhaps, onto the bipolar cells.
Acknowledgments
Supported in part by a grant from the National Eye Institute, EY00811, from the Massachusetts Lions Eye Research Fund and Junta de Catilla y León PIRTU (ORDEN EDU/1486/2008).