Introduction
The rising societal and environmental costs of fossil fuels have driven a resurgence of intense research into artificial photosynthesis.[Reference van de Krol1–Reference Wang, Pierre, Kibria, Cui, Han, Bevan, Guo, Paradis, Hakima and Mi5] Solar-driven water splitting using light-absorbing semiconducting electrodes can delineate a possible route toward solar-to-chemical fuel conversion.[Reference Du, Yang, Mayer, Hoyt, Xie, McMahon, Bischoping and Wang6] Extensive ongoing research in this direction has outlined critical scientific problems that entail urgent resolution through combined theoretical and experimental efforts.[Reference Iqbal, Hossain and Bevan7–Reference Nellist, Laskowski, Lin, Mills and Boettcher11] Nevertheless, inadequate understanding of the complex processes governing semiconductor photocatalysis significantly impedes progress toward cost competitive unassisted solar water splitting.[Reference Nellist, Laskowski, Lin, Mills and Boettcher11] Thus, device models exploring the mesoscopic charge transfer processes driving photocatalysis at semiconductor–liquid (SL) junctions can deliver fundamental insights into these processes and may provide more efficient photoelectrochemical (PEC) device designs.
The modeling of mesoscopic phenomena at SL junctions comprises a long-standing problem in modern photoelectrochemistry.[Reference Reichman12–Reference Cass, Duffy, Peter, Pennock, Ushiroda and Walker14] In recent years, however, the development of numerical techniques, which provide an enhanced understanding of the photocatalytic process at SL junctions, has gained a considerable amount of attention. This includes, but is not limited to the calculation of steady-state band diagrams,[Reference Cendula, Tilley, Gimenez, Bisquert, Schmid, Grätzel and Schumacher15] transient analysis of PEC device behavior,[Reference Barnes, Anderson, Durrant and O'Regan16] modeling of surface-state dynamics,[Reference Iqbal, Hossain and Bevan7] complete solution of combined drift-diffusion equations,[Reference Iqbal and Bevan17] and the simulation of electrocatalyst-coated photoelectrodes.[Reference Mills, Lin and Boettcher18] In general, mesoscopic charge transport in an SL junction can be self-consistently calculated by solving the coupled Poisson-continuity equations.[Reference Iqbal and Bevan17] However, to capture the photocurrent (J ph) and the photovoltage (V ph) (two of the most commonly measured quantities in typical PEC experiments),[Reference Dotan, Mathews, Hisatomi, Grätzel and Rothschild19] it is also imperative to setup appropriate boundary conditions. For instance, the interfacial photocurrent (J ph) at a photocatalytic SL junction (a boundary point) is usually computed by assuming the presence of a pseudo-Schottky contact at the interface.[Reference Cendula, Tilley, Gimenez, Bisquert, Schmid, Grätzel and Schumacher15, Reference Iqbal and Bevan17, Reference Shi, Herraiz-Cardona, Bertoluzzi, Lopez-Varo, Bisquert, Park and Gimenez20] Yet, similar boundary conditions are needed for Poisson's equation to capture V ph, but this crucial issue has not received proper attention in the literature. As described by Thorne et al.[Reference Thorne, Li, Du, Qin and Wang9] and Dotan et al.,[Reference Dotan, Mathews, Hisatomi, Grätzel and Rothschild19] the photovoltage (V ph) generated at an SL junction shifts the photocurrent toward the cathodic direction (for a photoanode) or anodic direction (for a photocathode) to facilitate unassisted solar water splitting. Likewise, due to its tendency to flatten the bands of semiconducting electrodes, the accurate determination of V ph is also important to precisely extract and understand the band-diagram electrostatics of PEC devices.[Reference Du, Yang, Mayer, Hoyt, Xie, McMahon, Bischoping and Wang6, Reference Thorne, Li, Du, Qin and Wang9, Reference Iqbal and Bevan17]
As part of an ongoing effort to understand the mesoscopic phenomena occurring in photocatalytic SL junctions, we previously presented a comprehensive analysis of the discretized drift-diffusion equations to theoretically extract measurable quantities (such as the photovoltage, onset, and saturation of photocurrent, etc.)[Reference Iqbal and Bevan17] and a comprehensive analysis of the surface-state dynamics at an SL junction under dark current conditions.[Reference Iqbal, Hossain and Bevan7] The purpose of our present work is to emphasize the significance/importance of choosing appropriate boundary conditions when modeling the photovoltage in PEC devices––a critical ingredient often ignored in the SL junction modeling literature. When combined with the governing drift-diffusion equations, these boundary conditions can self-consistently capture both the photocurrent and photovoltage. Special attention is given to outline how the typical theoretical results from our approach can be directly translated into experimental procedures and measurements. Furthermore, it is also demonstrated that our theoretical approach can be directly correlated with experimental transient absorption (TA) spectra analysis of semiconductor/metal oxide photoanodes performing solar-assisted water oxidation.
Method
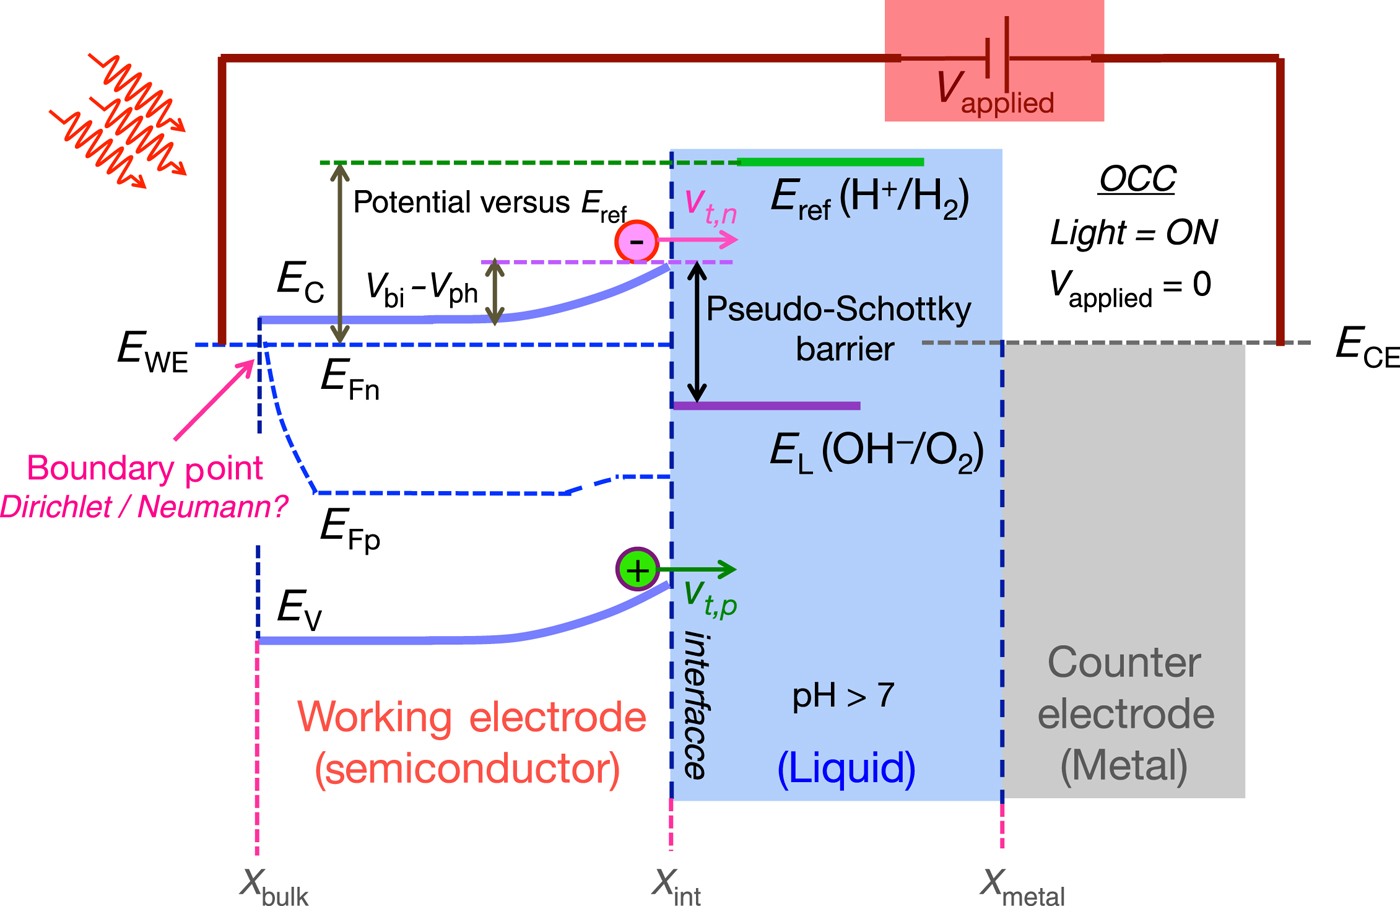
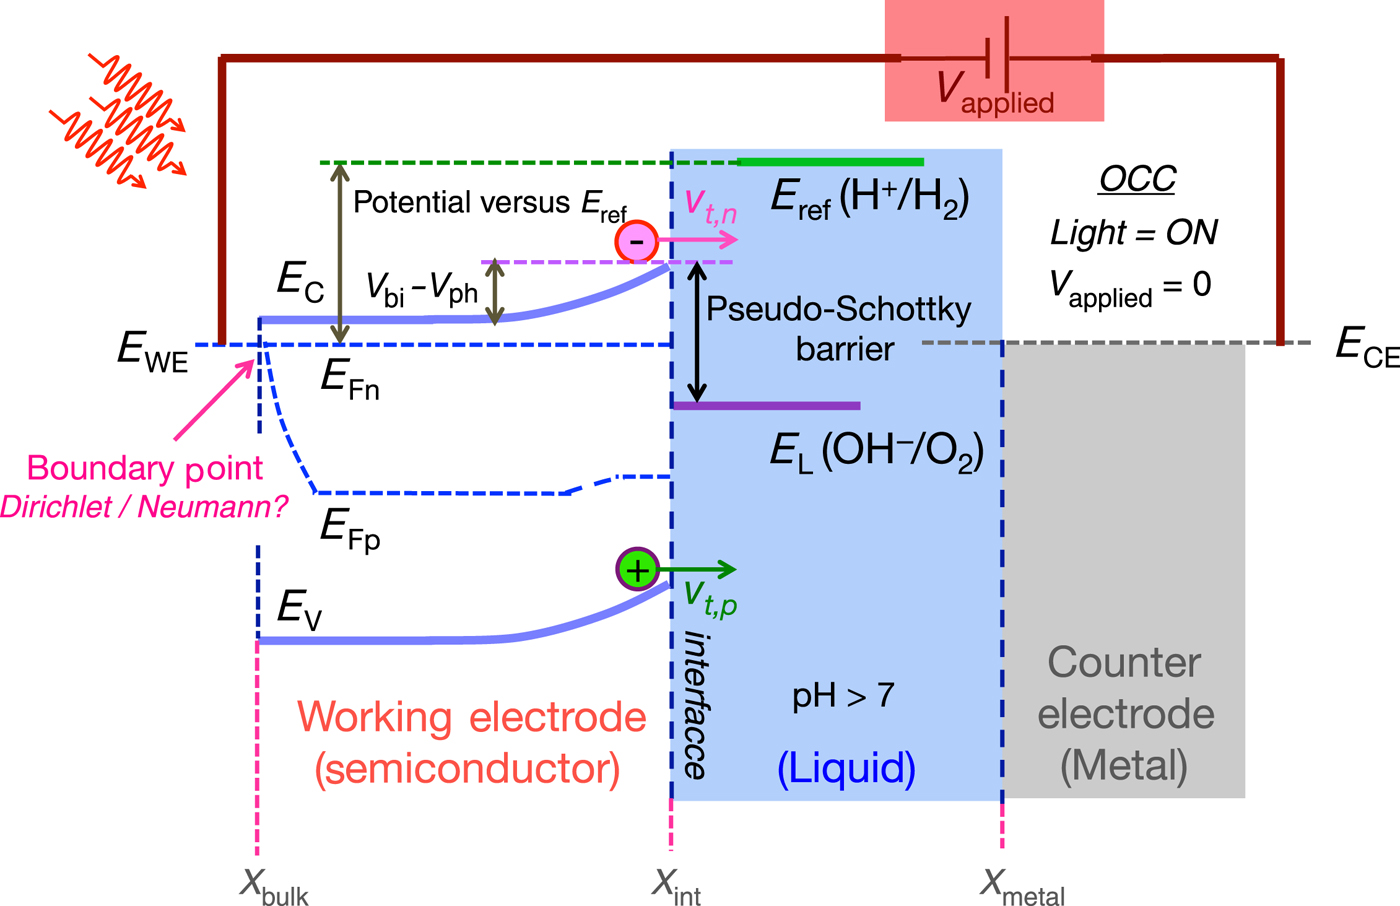
To begin with, let us briefly revisit the standard band-diagram alignment of a typical PEC setup (see Fig. 1), where the photocatalytic interface between the semiconducting photoanode (n-type) and an aqueous solution (pH > 7) is utilized to perform the solar-assisted water oxidation reaction.[Reference van de Krol1, Reference Cendula, Tilley, Gimenez, Bisquert, Schmid, Grätzel and Schumacher15] In addition, Fig. 1 also demonstrates the basic configuration of a standard PEC experimental setup.[Reference van de Krol1] As illustrated, a semiconductor electrode constitutes the working electrode (WE), whereas a metal counter electrode (CE) is required to complete the circuit.[Reference van de Krol1, Reference Bockris, Reddy and Galboa-Aldeco21] All the relevant energy levels in the system are referred with respect to the energy of a reference electrode (E ref). In our present work, we have considered a reversible hydrogen electrode (RHE) as the reference electrode.[Reference van de Krol1] Moreover, the PEC setup in Fig. 1 also allows the application of external excitation in the form of solar irradiation and/or externally applied potential source (denoted by V applied).[Reference Cendula, Tilley, Gimenez, Bisquert, Schmid, Grätzel and Schumacher15]
Typical band-diagram alignment of an illuminated semiconductor photoanode (n-type) in contact with an aqueous solution (pH>7). All important energy levels are drawn for clarity. In this case, the energy of the reversible hydrogen electrode (RHE) is taken as the reference (E ref). In PEC experiments, the potential of the working electrode (photoanode in our case) or E WE is measured with respect to E ref, whereas the metal counter electrode (operating at energy E CE) is required to close the path of electron/hole flow. Under solar irradiation, the photoanode demonstrates splitting of electron (E Fn) and hole (E Fp) quasi-Fermi levels and the band bending is reduced by the amount of generated photovoltage (V ph). The built-in potential at dark and the applied external bias are represented by V bi and V applied, respectively. Here, the PEC setup is illustrated for V applied = 0 with solar irradiation (illuminated OCC). A few important points along the space vector (x bulk, x int, and x metal) are also shown for convenience of the discussion.
With the PEC set-up in hand, we now configure the governing equations with appropriate boundary conditions so that experimental trends of J ph and V ph can be reliably replicated in our calculations. Now, the electron and hole continuity equations inside a semiconductor can be expressed as[Reference Pierret22–Reference Schroeder25]
 $$\displaystyle{1 \over q}\displaystyle{{dJ_{\rm n}} \over {dx}} + G_{\rm n} - R_{\rm n} = 0,$$
 $$- \displaystyle{1 \over q}\displaystyle{{dJ_{\rm p}} \over {dx}} + G_{\rm p} - R_{\rm p} = 0.$$
Here J n and J p respectively represent electron and hole currents throughout the semiconducting electrode. Other parameters include electron generation (G n) and recombination (R n) rates and hole generation (G p) and recombination (R p) rates, electron charge q, and space vector x. At an SL junction, as presented in Fig. 1, electronic conduction only exists inside the semiconductor electrode, whereas the electrolyte is characterized by ionic conduction.[Reference Bockris, Reddy and Galboa-Aldeco21, Reference Memming26] Thus, the pair of continuity equations [Eqs. (1) and (2)] are to be solved only inside the WE with boundary conditions located at x = x bulk and x = x int. Now, the boundary conditions on continuity equations at the bulk of the photoanode (x = x bulk) are merely set equal to the bulk concentrations of electrons (n bulk) and holes (p bulk) and thereby, are considered as Dirichlet type.[Reference Iqbal and Bevan17, Reference Shi, Herraiz-Cardona, Bertoluzzi, Lopez-Varo, Bisquert, Park and Gimenez20, Reference Vasileska, Stephen and Klimeck23] However, the appropriate boundary conditions for Eqs. (1) and (2) at the SL interface (x = x int) can be determined by comprehending that an ideal SL interface exhibits pinning of both the conduction band edge (E C) and valence band edge (E V) with respect to the liquid Fermi level (E L).[Reference Memming26, Reference Sato27] Due to this characteristic band-level pinning of the semiconductor bands, it is customary to consider that an ideal SL interface closely mimics the properties of a conventional metal–semiconductor (MS) Schottky junction.[Reference Iqbal and Bevan17, Reference Shi, Herraiz-Cardona, Bertoluzzi, Lopez-Varo, Bisquert, Park and Gimenez20] Consequently, the interfacial currents due to hole  $(J_{{\rm p} \vert {\mathop{\rm int}}} )$ and electron (J n|int) transfers at SL junctions can also be expressed similarly to those representing the interfacial currents at MS Schottky junctions and are given by[Reference Iqbal and Bevan17, Reference Crowell and Sze28]
 $$J_{{\rm p \vert int}} = qv_{{\rm t,p}} \left( {\,p_{\rm s} - p_{{\rm s}0}} \right),$$
 $$J_{{\rm n \vert int}} = - qv_{{\rm t,n}} \left( {n_{\rm s} - n_{{\rm s0}}} \right).$$
At an anodic SL junction, v t,p represents the transfer velocity of valence band holes to the liquid, leading to the desired oxidation reaction of OH − species.[Reference Iqbal and Bevan17, Reference Shi, Herraiz-Cardona, Bertoluzzi, Lopez-Varo, Bisquert, Park and Gimenez20] Similarly, the conduction band electron transfer velocity is modeled by v t,n, representing the undesired counter-reaction (reduction of O2).[Reference Iqbal and Bevan17, Reference Kumar, Santangelo and Lewis29] Here, n s0 and p s0 are the equilibrium concentrations of electrons and holes at the interface and n s and p s are the non-equilibrium concentrations of electrons and holes at the interface, respectively. However, an SL junction can deviate from the ideal Schottky-type behavior (constant height of the Schottky barrier) via unpinning the semiconductor bands if the charging/discharging process of surface states start to occur.[Reference Iqbal, Hossain and Bevan7, Reference Memming26] In this regard, an adaptive Schottky contact with varying barrier height, as presented in our earlier work,[Reference Iqbal and Bevan17] is required to represent the SL interface. Finally, J n|int and J p|int (necessary to reliably capture the photocurrent) serve as the Neumann-type boundary conditions for Eqs. (1) and (2), respectively, at the photocatalytic SL interface (x = x int).[Reference Iqbal and Bevan17, Reference Shi, Herraiz-Cardona, Bertoluzzi, Lopez-Varo, Bisquert, Park and Gimenez20] The discretization technique of the continuity equations coupled with pseudo-Schottky-type boundary conditions has already been presented in our earlier work to which the reader is referred.[Reference Iqbal and Bevan17]
Now, to compute the electrostatic potential (φ) that spans over the entire SL junction, Poisson's equation must be solved together with the continuity equations [Eqs. (1) and (2)].[Reference Iqbal and Bevan17, Reference Vasileska, Stephen and Klimeck23] Fundamentally, φ arises due to exposed charges at the SL interface––denoted by the sum of the charge density in the semiconductor (ρ sc) and liquid (ρ L).[Reference Iqbal, Hossain and Bevan7, Reference Memming26] Here, we have incorporated a varying dielectric constant (ε) in Poisson's equation to solve for the electrostatic potential inside the entire span of the anodic SL junction, expressed as[Reference Iqbal, Hossain and Bevan7]
 $$\varepsilon \displaystyle{{d^2 \varphi \;} \over {dx^2}} + \displaystyle{{d\varphi \;} \over {dx}}\displaystyle{{d\varepsilon} \over {dx}} = - \left[ {\rho _{{\rm sc}} + \rho _{\rm L}} \right].$$
By solving the Poisson equation in this manner, we ensure that the potential drop inside the liquid (comprised mostly by the Helmholtz layer potential)[Reference van de Krol1, Reference Memming26] is allowed to evolve under the circumstances of surface-state charging, applied external excitations, and semiconductor doping.[Reference Iqbal, Hossain and Bevan7] Therefore, the SL contact is modeled as an adaptive Schottky contact capable of capturing both pinning and unpinning of semiconductor bands at the interface––an important prerequisite to simulate various oxide semiconductors (e.g., hematite, TiO2, BiVO4) used in photocatalysis.[Reference Iqbal and Bevan17]
Now, our implementation of Poisson's equation assumes two boundary conditions located at x = x bulk and x = x metal (see Fig. 1). The search for correct boundary conditions on φ is steered by: (1) the existence of the unique solution and (2) the band-flattening process (under illumination) that occurs at the bulk of the semiconductor. To guarantee a unique potential solution, we set φ at x = x metal to some pre-defined value (for instance, the value of the local vacuum level), which imposes a Dirichlet boundary condition. Conversely, the appropriate boundary condition (Dirichlet/Neumann) at x = x bulk will be examined in this work by correlating theoretical calculations with the experimental procedures and trends.
Results
As a model system, we have considered an n-type hematite-based water-splitting photoanode performing water oxidation.[Reference Le Formal, Pastor, Tilley, Mesa, Pendlebury, Grätzel and Durrant30–Reference Tilley, Cornuz, Sivula and Grätzel33] Hematite (α-Fe2O3) has been widely investigated for solar-assisted water splitting due to its inexpensive elemental constituents and suitable band gap (1.9–2.2 eV).[Reference van de Krol1, Reference Sivula, Le Formal and Grätzel34] In our simulation, we assumed a hematite photoanode with a band gap (E G) of ~2.1 eV, immersed in an aqueous solution of pH = 13.6.[Reference Le Formal, Pastor, Tilley, Mesa, Pendlebury, Grätzel and Durrant30] The donor concentration of the photoanode (N D) is also set to ~1020 cm−3 in accordance with the values reported in the literature.[Reference Le Formal, Pastor, Tilley, Mesa, Pendlebury, Grätzel and Durrant30, Reference Tilley, Cornuz, Sivula and Grätzel33] For convenience, our calculated energy band diagrams for the hematite photoanode are drawn with respect to the reversible hydrogen electrode (RHE), which is located −4.44 eV below the standard vacuum-level reference commonly found in the device physics literature.[Reference van de Krol1, Reference Bockris, Reddy and Galboa-Aldeco21]
The first part of our analysis is aimed at numerically capturing the photovoltage at the illuminated hematite photoanode. This explores, as presented in the Method section, the impact of the chosen boundary condition (Dirichlet- or Neumann-type) for Poisson's equation at x = x bulk, upon the band-flattening process and charge transfer rates due to incident solar irradiation. That being said, the nature of this boundary condition should be such that the calculated electrostatics can effectively capture the evolution of φ (equivalent to semiconductor band bending) under any form of external excitation.[Reference Dotan, Mathews, Hisatomi, Grätzel and Rothschild19] However, to analyze the band diagram under dark and illumination, we only consider the open-circuit condition (OCC)––characterized by a net zero current flow, within a dark or illuminated hematite photoanode.[Reference Sato27]
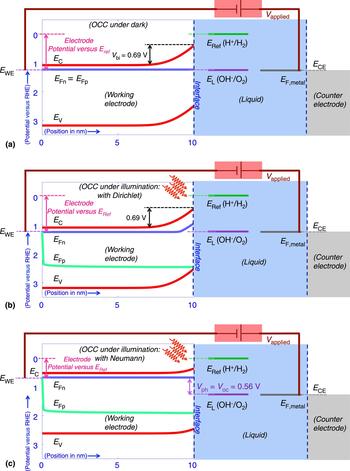
Figure 2(a) displays the calculated band diagram of the hematite photoanode at the dark OCC (also known as the “equilibrium” condition). Importantly, the electrode considered in this study is assumed to be robust against corrosion and only allowed to exchange electrons/holes with OH−/O2 redox species.[Reference Iqbal and Bevan17, Reference Kumar, Santangelo and Lewis29] This assumption, in other words, means that the liquid Fermi level (E L) is solely determined by the energy of the OH−/O2 redox species.[Reference Cendula, Tilley, Gimenez, Bisquert, Schmid, Grätzel and Schumacher15] Consequently, as clearly shown in Fig. 2(a), the electrode–electrolyte system, when situated in the dark, demonstrates equilibrium through perfectly aligning the electron (E Fn) and hole (E Fp) Fermi levels with E L (at 1.23 V versus RHE) when V applied = 0.[Reference Iqbal and Bevan17] Our results show that under the dark OCC, the hematite surface is depleted from electrons (majority carrier) and characterized by a built-in potential (V bi) of ~0.69 V. However, this OCC picture of the hematite photoanode when dark can be replaced by non-equilibrium OCC if the electrode is set to solar irradiation.[Reference Dotan, Mathews, Hisatomi, Grätzel and Rothschild19] This, in turn, is regularly detected via different “flat-band” experiments in the form of semiconductor band flattening due to V ph generation.[Reference Chen, Dinh and Miller35] Therefore, it is fundamentally imperative that any numerical technique applied to an SL junction correctly captures the band-flattening process.
(a) Calculated band diagram of hematite photoanode at the dark OCC. The PEC system demonstrates perfect alignment of all the Fermi levels and thus illustrates the junction at equilibrium characterized by V bi ~0.69 V. (b)–(c) Calculated band diagrams of the hematite photoanode under ~0.33 sun of solar irradiation. Depending on whether (b) Dirichlet- or (c) Neumann-type boundary condition is applied on the electrostatic potential at x = x bulk, the band diagram may (Neumann) or may not (Dirichlet) capture the band-flattening process brought by the illumination.
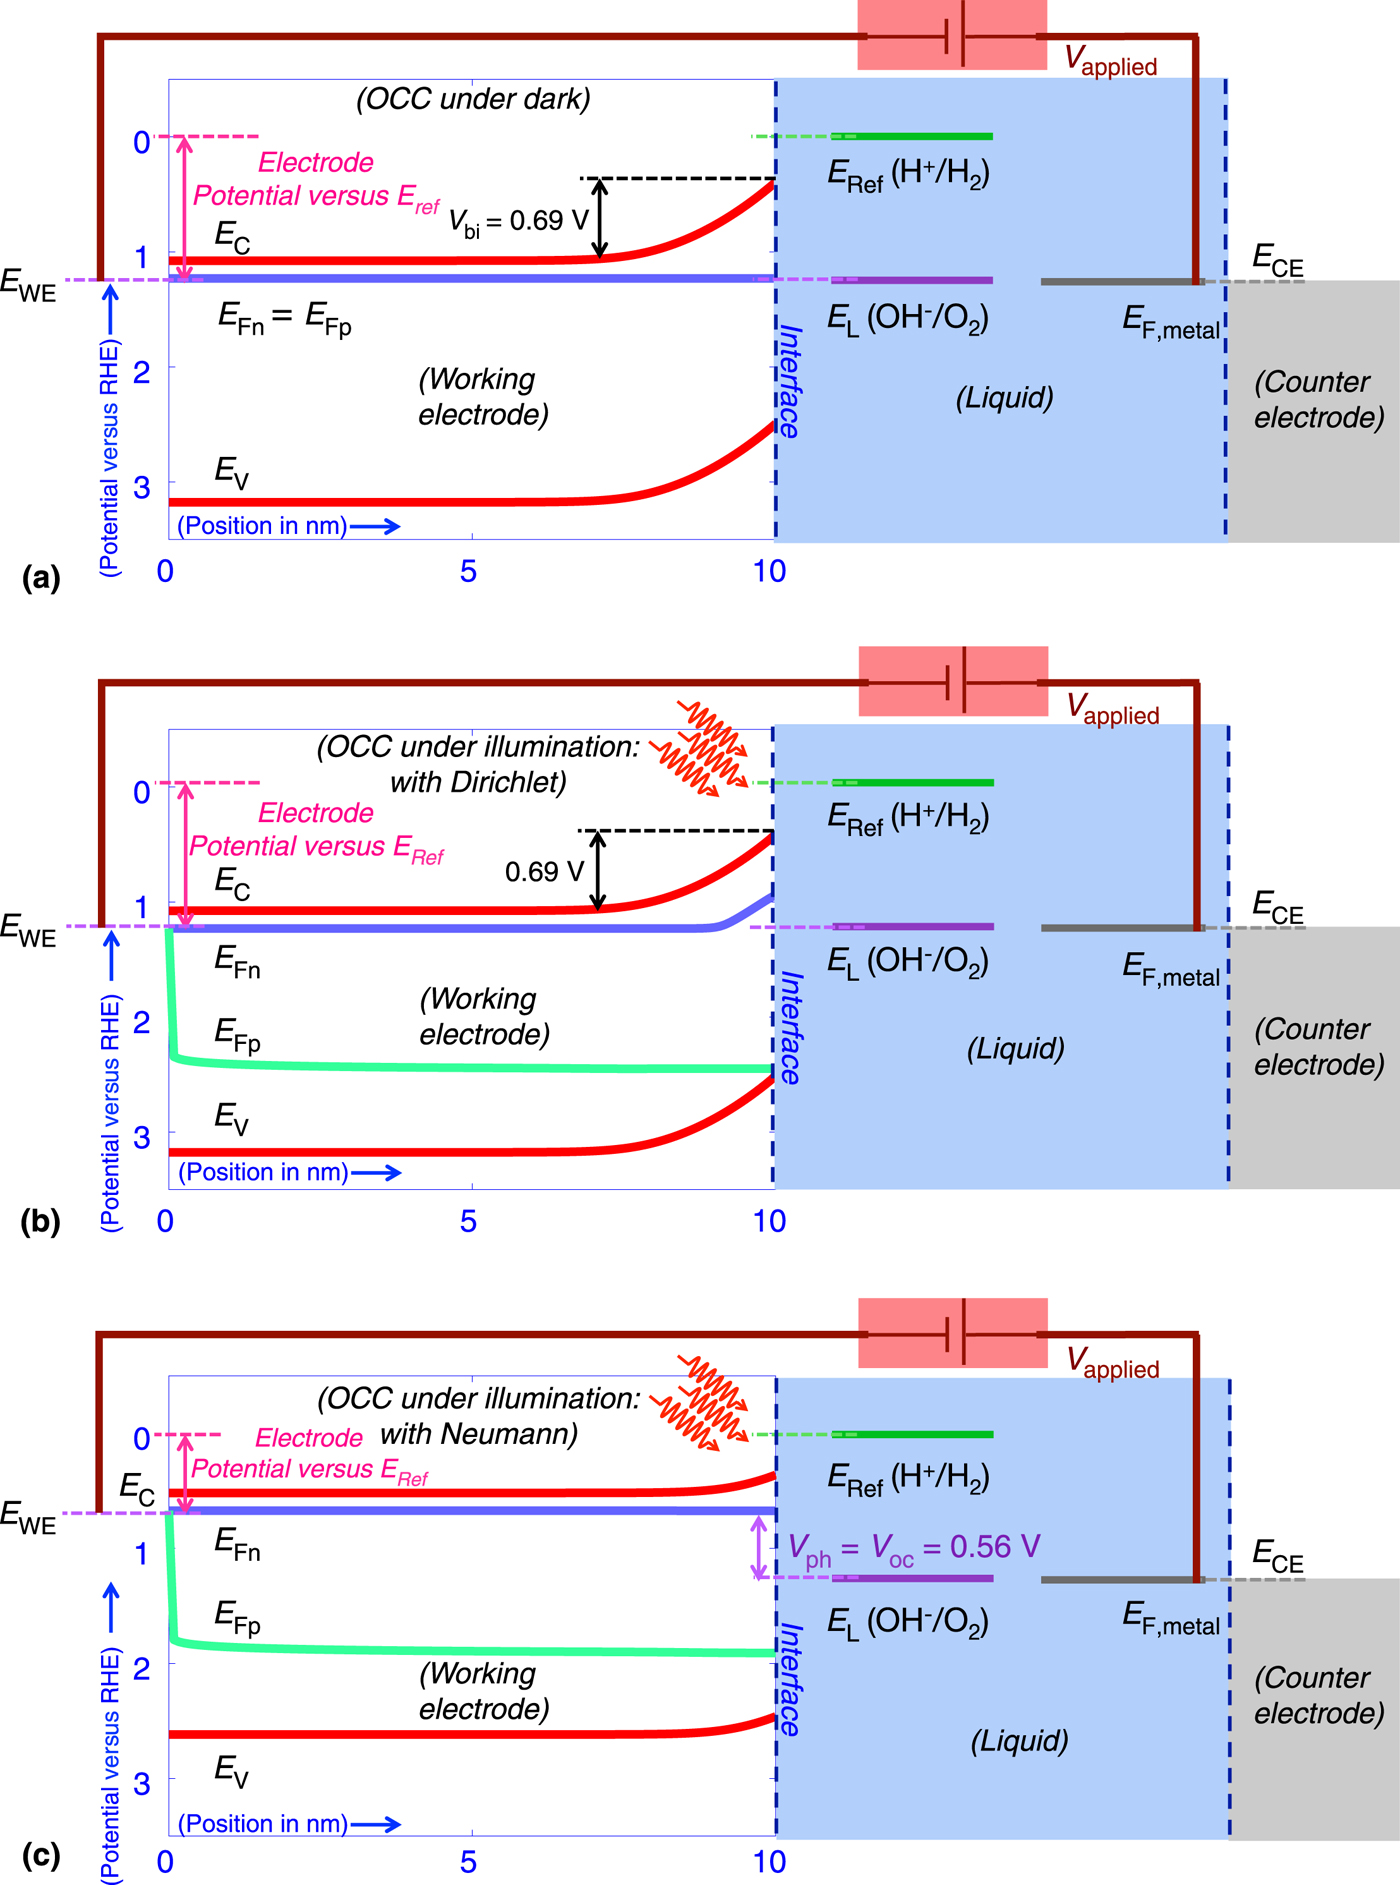
In order to self-consistently capture V ph at the illuminated OCC, we separately used both Dirichlet- and Neumann-type boundary conditions on φ at x = x bulk and calculated the band alignments [shown in Fig. 2(b)–2(c), respectively]. Here, the photoanode is theoretically set to ~0.33 sun of solar irradiation, whereas the absorption coefficient (α) of hematite is considered to be ~1.5 × 10⁷ m−1.[Reference Cendula, Tilley, Gimenez, Bisquert, Schmid, Grätzel and Schumacher15, Reference Le Formal, Pastor, Tilley, Mesa, Pendlebury, Grätzel and Durrant30] We also considered the hole transfer velocity (v t,p) ~10−9 ms−1, typical for hematite photoanode due to its extraordinarily sluggish hole transfer rate.[Reference Iqbal and Bevan17] Moreover, to optimize the hole-driven oxidation reaction at the hematite interface, we deliberately made the hematite interface opaque to electron transfer by reducing the electron transfer velocity (v t,n) to zero.[Reference Kumar, Santangelo and Lewis29] Utilizing this computational set-up, the calculated band diagram with a Dirichlet boundary condition imposed on φ at x = x bulk is unable to capture the band-flattening process; this is demonstrated by the equal amount of band bending (~0.69 V) calculated for the hematite electrode under solar irradiation [see Fig. 2(b)]. Nevertheless, the quasi-Fermi levels of electrons and holes are separated to accommodate photogenerated electron–hole pairs. As a consequence of the vanishing interfacial electron transfer, the electron quasi-Fermi level moves toward the conduction band and is depicted as a rise in interfacial electron concentration. As explained in Ref.,[Reference Iqbal and Bevan17] these photogenerated electrons [if not recombined in the space-charged region (SCR)] should migrate toward the bulk of the electrode and induce V ph that acts as a forward potential by flattening the semiconductor bands. However, the desired migration of the electrons (majority carrier) and thus the band flattening due to solar irradiation can only be captured when a Neumann-type boundary condition is imposed on φ at x = x bulk [see Fig. 2(c)]. In this case, the hematite photoanode generates a photovoltage of ~0.56 V by efficiently separating the photogenerated electrons and holes created in the space-SCR. As expected, the quasi-Fermi level of electron remains flat at ~0.67 V versus RHE and is also elevated compared with the dark resting potential of the hematite photoanode (~1.23 V versus RHE). Now, the band flattening due to solar irradiation is commonly measured/estimated as the amount of shift in OCC brought about by photoexcitation.[Reference Thorne, Li, Du, Qin and Wang9] This has been well documented both theoretically (by Salvador[Reference Salvador36]) and experimentally (by Wang and co-workers in a series of papers[Reference Du, Yang, Mayer, Hoyt, Xie, McMahon, Bischoping and Wang6, Reference Thorne, Li, Du, Qin and Wang9]) for hematite-based photoanodes. Following a similar procedure, our calculation of the band flattening (~0.56 V) is comparable with the experimentally determined range of band flattening (0.24–0.8 V) exhibited by hematite photoanodes.[Reference Du, Yang, Mayer, Hoyt, Xie, McMahon, Bischoping and Wang6, Reference Thorne, Li, Du, Qin and Wang9] However, the numerical estimation of this band-flattening process has not been captured in the existing SL junction simulation literature due to: (1) the consideration of the Dirichlet boundary condition on φ at x = x bulk[Reference Anz and Lewis13–Reference Cendula, Tilley, Gimenez, Bisquert, Schmid, Grätzel and Schumacher15, Reference Shi, Herraiz-Cardona, Bertoluzzi, Lopez-Varo, Bisquert, Park and Gimenez20]; and (2) the assumption of only minority carrier modulation at the illuminated electrodes.[Reference Cendula, Tilley, Gimenez, Bisquert, Schmid, Grätzel and Schumacher15] Nevertheless, the impact of different types of boundary conditions in simulating state-of-the-art solid-state devices constitutes an old problem, which has been explored thoroughly in the solid-state device physics literature.[Reference Vasileska, Stephen and Klimeck23–Reference Schroeder25] However, this problem has not been well explored in the photocatalytic device literature. Importantly, capturing this critical band-flattening process (equivalently, V ph) profound impacts upon the computed photocurrent at the SL junctions––an issue that we will explore next.
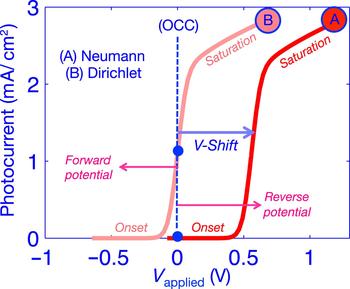
A pivotal ingredient of our present work is the calculation of the photocurrent following the “standard” experimental steps albeit using a purely theoretical platform,[Reference Dotan, Mathews, Hisatomi, Grätzel and Rothschild19] these steps include: (1) resting the electrode in the dark equilibrium (OCC under dark); (2) placing the electrode only under solar irradiation (illuminated OCC); and (3) imparting the electrode with both photoexcitation and an applied reverse bias (V applied > 0). Up to now, we have discussed steps (1) and (2) and have determined that a Neumann boundary condition must be imposed on φ at x = x bulk to produce V ph (or the band flattening, as shown in Fig. 2). Now, the photocurrent can be computed as J ph = Jn|int + J p|int [Eqs. (3) and (4)] using the self-consistent solution of the carrier concentrations obtained by solving the coupled Poisson-continuity equations. Figure 3 presents calculations of the photocurrent at a hematite electrode and explicitly delineates the significance of placing appropriate boundary conditions on φ at the semiconductor bulk.
Calculated photocurrents using Neumann- (marked by A) and Dirichlet-type (marked by B) boundary conditions on  $ \varphi $ at x = x bulk. Here, J ph is plotted as a function of the applied external potential, where V applied = 0 denotes the open-circuit potential (OCC). J ph computed with a Neumann condition theoretically imitates the experimental procedure to generate practical current–voltage curve (dark OCC
 $ \to $ illumination OCC → V applied > 0), and hence in accordance with the perception of hematite band bending and interfacial hole transport. However, J ph computed with a Dirichlet condition fails to produce a photovoltage and is unable to provide a point-by-point match with the experimental trend.
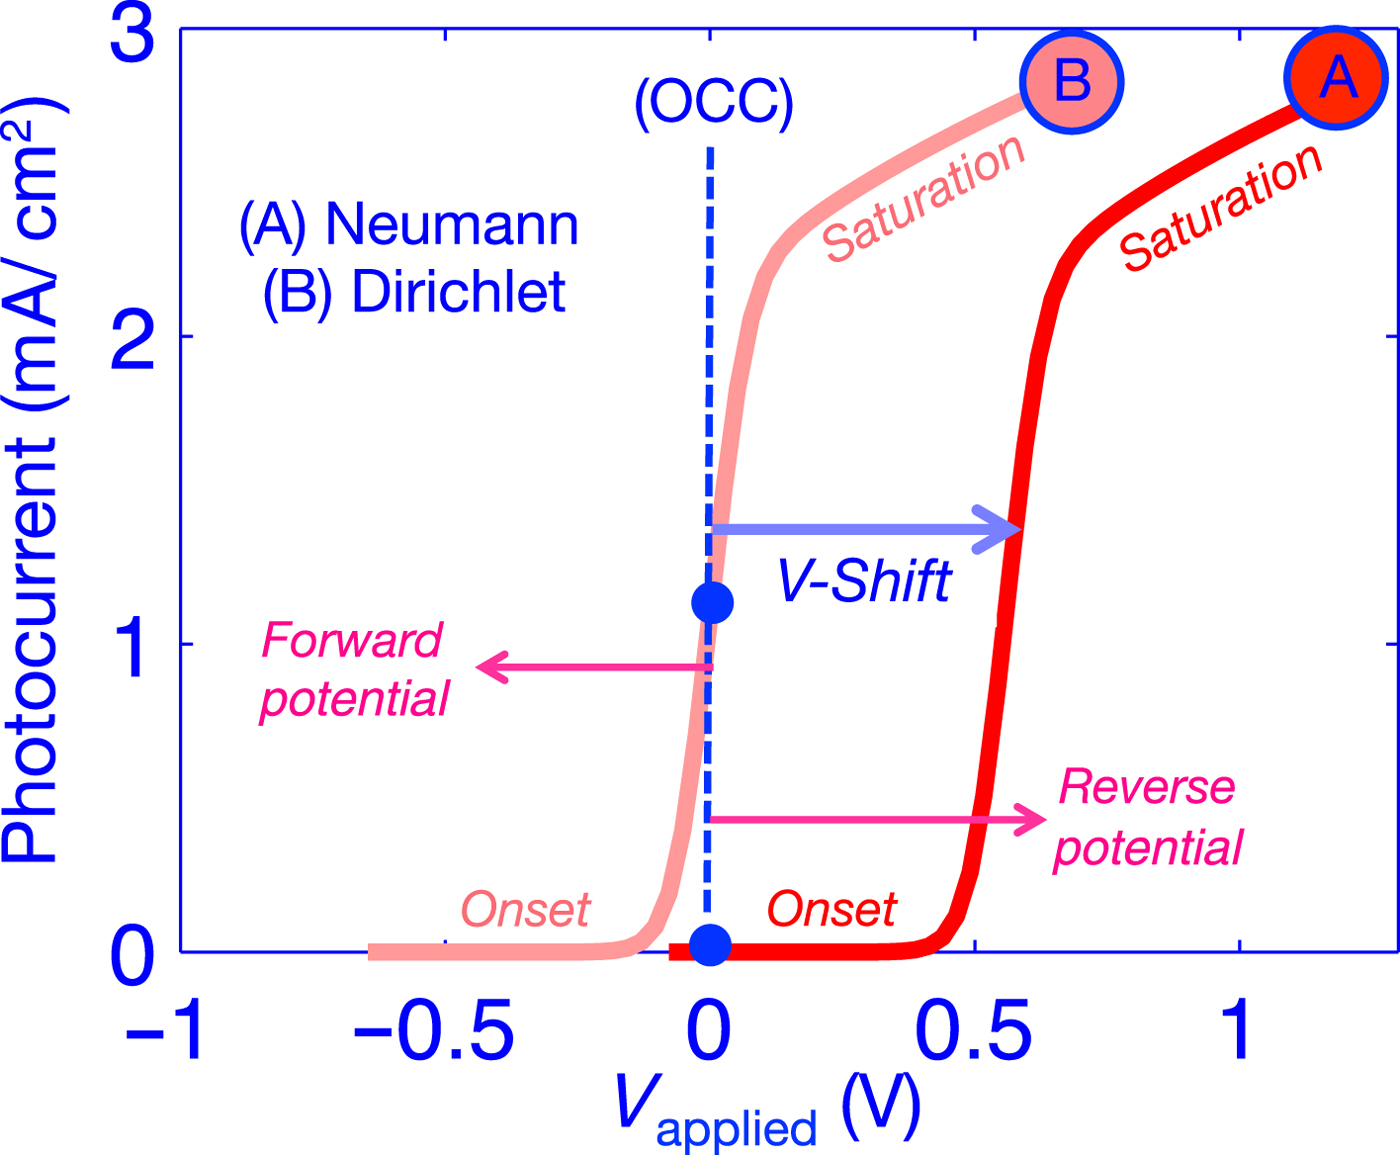
To understand, let us consider curve A in Fig. 3, representing the photocurrent calculated using a Neumann boundary condition. At the illuminated OCC (V applied = 0), J ph is negligible (~6.2 × 10⁻⁹ mAcm−2) and essentially considered as zero. The reason J ph becomes non-zero albeit very small in value is directly linked with the extraordinary sluggish rate of interfacial hole transfer. However, with fast v t,p, p s approaches p s0 and can make J p|int → 0 or J ph → 0. As discussed earlier [see Fig. 2(c)], band flattening of the hematite electrode elevates the electron quasi-Fermi level (~0.67 V versus RHE) and the electrode is operated close to the flat-band potential (V FB~0.54 V versus RHE)[Reference Le Formal, Pendlebury, Cornuz, Tilley, Grätzel and Durrant31] with a significantly low SCR electric field and high SCR/bulk recombination. At this point, in a practical PEC set-up, a reverse potential (V applied > 0) is applied on the photoanode to gradually increase the SCR electric field in order to suppress the recombination.[Reference Iqbal and Bevan17, Reference Dotan, Mathews, Hisatomi, Grätzel and Rothschild19] In our simulation, the application of reverse potential on hematite electrode (operating in sub-onset region) also increases photocurrent by suppressing detrimental recombination processes. Critical operating points on J ph can be marked as onset (small reverse bias), transition region (moderate reverse bias) and saturation (high reverse bias). Interestingly, curve A in Fig. 3 depicts the photocurrent computed using an identical procedure to that applied in experiments. Here, photocurrent onset occurred at 0.4 V of reverse bias, transition region spans within a reverse bias from 0.4 to 0.72 V, and finally, saturation occurs at reverse bias >0.72 V. Moreover, a photocurrent onset at 0.4 V of reverse bias (V applied = 0.4 V) can be translated into an onset potential of ~1.07 V versus RHE, which falls very close to the experimentally determined onset of hematite photoanode at 1.1 V versus RHE.[Reference Le Formal, Pastor, Tilley, Mesa, Pendlebury, Grätzel and Durrant30]
However, when the photocurrent is computed with a Dirichlet boundary condition on φ at x = x bulk, one is unable to reproduce a step-by-step match with the practical J ph curve. As presented in Fig. 3, curve B produces a significantly high photocurrent (~1.1 mAcm−2) at the illuminated OCC, such that OCC falls in the transition region of the photocurrent. This again can be linked with the absence of band flattening brought about by the solar irradiation when a Dirichlet boundary condition is applied. To tune the electrode inside the sub-onset region, in this case, the hematite photoanode requires a forwardly applied potential that can flatten the bands, which physically generated by the photoexcitation in a real system (not by a forward external bias).[Reference Thorne, Li, Du, Qin and Wang9, Reference Sato27] Consequently, curve B results in the photocurrent onset at 0.18 V forward bias, the transition region from 0.18 V forward bias to 0.14 V reverse bias and saturation at a reverse bias of 0.14 V and beyond. Thus, despite the fact that the photocurrent presented by curve B appears to be similar to the experimental photocurrent, it nevertheless miscalculates the band bending demonstrated by an illuminated hematite electrode and fails to replicate the experimental procedure. It is also imperative to understand that practical electrodes can exhibit reduced/inefficient band flattening due to the detrimental events such as surface/bulk recombination,[Reference Du, Yang, Mayer, Hoyt, Xie, McMahon, Bischoping and Wang6, Reference Thorne, Li, Du, Qin and Wang9, Reference Klahr, Gimenez, Fabregat-Santiago, Hamann and Bisquert10] which can impede the V ph generation process. In addition, intermediate trap-states at the fluorine-doped-tin-oxide/hematite (FTO/hematite) interface can limit the practical band flattening at hematite electrodes.[Reference Rioult, Magnan, Stanescu and Barbier37] The impact of surface/bulk recombination and the FTO/hematite interface on PEC performance has both been experimentally investigated in the literature.[Reference Zandi and Hamann4, Reference Du, Yang, Mayer, Hoyt, Xie, McMahon, Bischoping and Wang6, Reference Thorne, Li, Du, Qin and Wang9, Reference Klahr, Gimenez, Fabregat-Santiago, Hamann and Bisquert10, Reference Rioult, Magnan, Stanescu and Barbier37] Nonetheless, while modeling these practical semiconducting electrodes utilized in PEC applications, one must consider floating boundary condition on φ at x = x bulk. This is because a Dirichlet boundary condition is unable to capture the band flattening no matter how inefficient the V ph generation process is. Moreover, the information regarding band bending is critical to the operation of PEC devices, as it is directly translated into mesoscopic charge transfer kinetics and provides valuable insights into SCR/bulk recombination and interfacial carrier transport. As our final goal, we now wish to address to what extent we can theoretically extract these charge transfer properties and correlate them with experimental results.
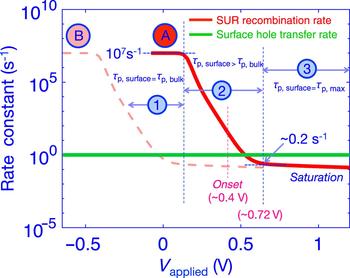
In PEC experiments, a common procedure for evaluating the complex charge transfer kinetics present is to probe the minority carrier (holes in n-type hematite) relaxation time via TA spectra analysis.[Reference Le Formal, Pastor, Tilley, Mesa, Pendlebury, Grätzel and Durrant30, Reference Barroso, Pendlebury, Cowan and Durrant32] For instance, TA spectra analysis of a hematite photoanode by Le Formal et al.[Reference Le Formal, Pendlebury, Cornuz, Tilley, Grätzel and Durrant31] suggests that the rapid (picosecond to millisecond) recombination of the photogenerated holes effectively limits the PEC performance and can be suppressed under anodic bias (bias applied toward reverse direction). This observation is also supported by Barroso et al.,[Reference Barroso, Pendlebury, Cowan and Durrant32] where part of the TA spectra demonstrates micro to millisecond decay and linked with the trap-assisted SCR recombination. In general, rapidly occurring hole recombination is attributed to the “fast-decay” portion of the TA spectrum.[Reference Le Formal, Pendlebury, Cornuz, Tilley, Grätzel and Durrant31] In accordance with Ref.,[Reference Le Formal, Pastor, Tilley, Mesa, Pendlebury, Grätzel and Durrant30] we also considered that fast hole relaxation occurs at a lifetime (τ p,bulk) of 0.1 µs. Figure 4 shows the calculated rate of interfacial recombination (k rec) with respect to the rate of interfacial hole transfer (k trans) assuming both Neumann (curve A) and Dirichlet (curve B) boundary conditions on φ at x = x bulk. In this computation, the rate of interfacial/SCR hole recombination is calculated as k rec(x) = R p(x)/p(x) and the rate of interfacial hole transfer is assumed to be ~1 s−1, which is in accordance with the literature[Reference Iqbal and Bevan17, Reference Le Formal, Pendlebury, Cornuz, Tilley, Grätzel and Durrant31] and can be computed using k trans(x int) = L trans/v t,p [with a hole transfer distance (L trans) of 1 nm]. Now, as presented by curve A (with Neumann boundary condition) in Fig. 4, close to the illuminated OCC (when V applied is at a low reverse potential), the photocatalytic interface is characterized by extraordinarily high recombination (marked as region 1). In practice, this situation is directly correlated with a hematite photoanode operating close to the flat band condition and thereby unable to produce a sufficiently lengthened SCR that separates electrons and holes. This observation can be further supported by our simulated band diagram [see Fig. 2(c)] and the negligible calculated photocurrent throughout the sub-onset portion of the photocurrent (see curve A in Fig. 3). Therefore, we can correlate region 1 of Fig. 4 with the rapid recombination of the photogenerated holes giving rise to the fast-decay (≤0.1 µs) portion of the TA spectrum.[Reference Le Formal, Pendlebury, Cornuz, Tilley, Grätzel and Durrant31, Reference Barroso, Pendlebury, Cowan and Durrant32] In this region, interfacial recombination occurs at a timescale equal to the minority carrier lifetime (τ p,bulk).[Reference Barroso, Pendlebury, Cowan and Durrant32] As illustrated in Fig. 4, if τ p,surface represents the interfacial hole lifetime, subsequently region 1 is characterized by τ p,surface = τ p,bulk.
Comparison of the calculated rate of recombination and rate of interfacial hole transfer in an illuminated hematite photoanode with both Neumann (marked by A) and Dirichlet (marked by B) boundary conditions. For curve A, the entire region 1 and part of region 2 are situated in the sub-onset regime of the photocurrent (compare curve A in Fig. 3). In this case, the interfacial hole transfer is suppressed by a high rate of recombination. These holes are detected experimentally as fast-decay holes in TA spectra analysis of hematite electrodes. Nevertheless, the lifetime of interfacial holes improves with the application of a reverse potential. It is only in region 3, where the interfacial hole transfer becomes comparable or outperforms the hole recombination process and the holes are detected as long-lived holes in TA spectra analysis. With improper Dirichlet condition (curve B), this entire process is unphysically shifted toward applied forward potentials and a direct correlation between theoretical and experimental results cannot be drawn.
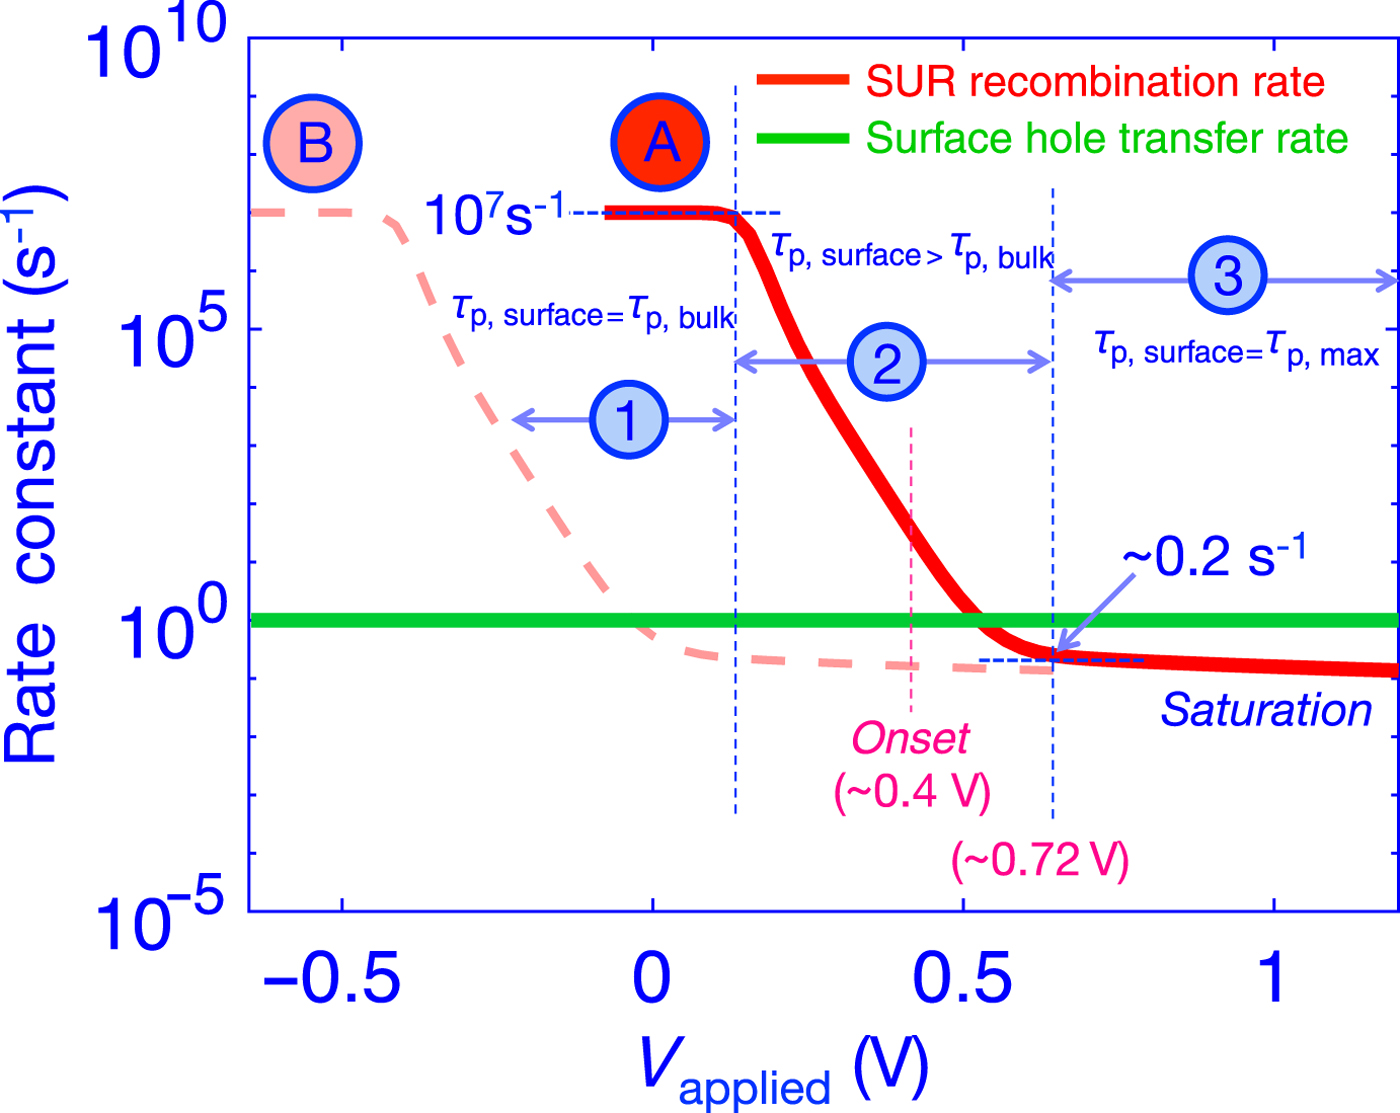
Now, starting from this sub-onset picture of photocatalytic hole transport, the interfacial hole lifetime at a hematite photoanode can be improved by applying potential in the reverse direction (marked as region 2).[Reference Le Formal, Pastor, Tilley, Mesa, Pendlebury, Grätzel and Durrant30, Reference Le Formal, Pendlebury, Cornuz, Tilley, Grätzel and Durrant31] Nevertheless, the photocurrent will still remain small, as the photogenerated holes are being transferred too slowly that these carriers are still prone to interfacial/SCR recombination. However, under the application of large reverse bias, the effects of interfacial hole lifetime improvement start to translate into a photocurrent. This marks the situation in region 3 when the rate of interfacial/SCR recombination is substantially retarded by the comparable or superior interfacial hole transfer rate (due to the strong field-separating carriers).[Reference Le Formal, Pastor, Tilley, Mesa, Pendlebury, Grätzel and Durrant30, Reference Barroso, Pendlebury, Cowan and Durrant32] Photogenerated holes under this condition are usually detected as “long-lived” holes in an experimental TA analysis. As the photogenerated holes become less vulnerable to unwanted recombination, the photoanode exhibits a higher yield of solar-to-chemical fuel conversion, which is clearly revealed by the saturation of the photocurrent under high reverse bias in Fig. 3.[Reference Barroso, Pendlebury, Cowan and Durrant32] All of these results were obtained with Neumann boundary conditions applied to φ at x = x bulk (curve A), when improper Dirichlet conditions are applied, this entire process is unphysically shifted toward applied forward potentials (as shown in Fig. 4, curve B), and again, a direct correlation between theoretical and experimental results (in this case, TA spectra analysis) cannot be made. Dirichlet conditions, therefore, incorrectly predict the applied potential needed to drive photocatalysis and miss the important physical interaction between the photovoltage and the applied potential in the practical operation of PEC devices.
Conclusion
In this work, we have presented a scientific discussion on the significance of utilizing appropriate boundary conditions in the mesoscopic modeling of photocatalytic SL interfaces. Our approach considered the bulk semiconductor bands as floating (Neumann boundary condition) in order to respond to the band-flattening process due to illumination. It was shown that to capture photovoltage formation, one must use a Neumann boundary condition for the electrostatic potential at the semiconductor bulk when solving the coupled Poisson-continuity equations self-consistently. With the corollary, that if a Dirichlet boundary condition is assumed at the semiconductor bulk, then the photovoltage is not captured. From this comparison of electrostatic boundary conditions, with and without a photovoltage, it was further demonstrated that the incorporation of the appropriate boundary conditions is essential to obtaining a direct point-to-point match between the photocurrent observed practically and the photocurrent obtained theoretically (with meaningful applied external potentials). Moreover, use of the correct boundary conditions was also linked with obtaining an accurate band-diagram alignment (taking band flattening under illumination into account). Throughout this implementation, it was also imperative to assume that the prototype SL interface acted as a pseudo-Schottky contact for interfacial electron and hole transfer.[Reference Iqbal and Bevan17] Finally, the intriguing scope of exploring the dynamics of interfacial/SCR recombination relative to the kinetics of interfacial charge transfer was also explored. This theoretical probing of interfacial charge transfer process was correlated with the practical hole relaxation experiments such as TA spectra analysis. Thereby, the method presented here offers intriguing results that provide improved ties to experimental methodologies. Overall, this work underscores the importance of proper boundary conditions (and the consequence of improper boundary conditions) when modeling the mesoscopic phenomena at the photocatalytic SL interfaces.
Acknowledgment
The authors acknowledge financial support from the NSERC of Canada and FQRNT of Québec and the computational resources provided by the Canadian Foundation for Innovation, CalculQuebec, and Compute-Canada.