Introduction
The seasonal distribution of human births has been widely studied in many countries and has been found to vary from country to country. Many demographers have focused on the United States, and have documented that the American monthly distribution of fertility has a minor peak in the spring and a major peak in the autumn. For example, Levine et al. (Reference Levine, Mathew, Chenault, Brown, Hurtt, Bentley and Working1990) showed that, in Texas, approximately 60% of the population is born in the autumn and summer, while only 40% are born in the winter and spring. In Australia, the major birth-month peak occurred in September in the early 1960s, but the peak moved to February and March in the late 1970s (Mathers & Harris, Reference Mathers and Harris1983). Becker (Reference Becker1981) found that twice as many births occurred in the winter than in the summer in Matlab, Bangladesh, which is a marked pattern.
Studies based on large samples in Asian countries seem to show similar seasonal patterns of births. For example, using three waves (1992, 1998, 2005) of National Family Health Survey (NFHS) data with more than 100,000 observations, Lokshin and Radyakin (Reference Lokshin and Radyakin2009) found that, in India, most people are born in August and October, with proportions of 10% and 11%, respectively, of the number of total births in a single year, while the least number of births occur in January, accounting for approximately 6% of the total births in a single year. Abeysinghe (Reference Abeysinghe1991) studied the seasonality of Chinese births using data from Chinese individuals living in Indonesia, Malaysia, Hong Kong and Singapore and documented that the largest proportion of Chinese births occurred in October and November. He noted that Chinese culture may be the cause of this seasonality.
As Lam and Miron (Reference Lam and Miron1991) concluded, the seasonality of human births cannot be due to a single reason. The possible explanations for the seasonal patterns of human births that have been put forward can be separated into biological and behavioural factors. Demographic studies have demonstrated that a fickle external environment, such as temperature (Becker, Reference Becker1981) and rainfall (Philibert et al., Reference Philibert, Tourigny, Coulibaly and Fournier2013), can affect the seasonal distributions of births by affecting fecundity and fetal loss. Some demographers have tried to study the seasonal fluctuation of human births from a global point of view and have found that the peak month of births seems to differ across latitudes (James, Reference James1990). Based on this phenomenon, it is natural to conclude that there is a link between human births and photoperiod. As a result, some studies have investigated this problem and have found that fertility increases with a longer photoperiod (Wehr, Reference Wehr1998; Bronson, Reference Bronson2004; Cumming, Reference Cummings2010). However, studies of biological factors are always limited by the trade-off between convincing results and a large sample because the effects of customs and habits must be excluded; however, when focusing on a small town in which people share the same customs, the data are not always large enough to study the effect of climate change. For this reason, data from mainland China provides a good sample for the study of biological factors. The mainland Chinese population is large and, compared with countries with the same scale of data, its customs are relatively similar throughout.
Coital frequency has been demonstrated to be influenced by behavioural factors such as festivals, marriage and the social characteristics of individuals. Cesario (Reference Cesario2002) systematically studied the ‘Christmas Effect’ on human births using data from the UK. Greksa (Reference Greksa2004) proposed the ‘wedding hypothesis’ using evidence in the Old Order Amish. Using data from two rural Chinese counties, Pasternak (Reference Pasternak1978) found that the main influence on birth was the reliability of the food supply, which was more important than time of marriage or the factors of temperature, rainfall or workload.
The basic method that is always used in these related studies is the analysis of monthly birth data, and this was the method used in the present study. Employing a large sample from the Chinese National Census, the study created a unique time series of monthly births in mainland China. The decomposition of the time series data allowed the extraction of a pure seasonal pattern. Finally, more detailed analyses by province and social group examined possible reasons for how the seasonal distributions of the births were formed.
From a public health perspective, research on the seasonality of births provides a reference for government policies to address certain diseases. Wellings et al. (Reference Wellings, Macdowall, Catchpole and Goodrich1999) showed that unsafe sexual activities have a major peak around Christmas in Britain, which may increase the potential risk of HIV and abortions. The current study shows that in China, the Spring Festival is related to the main peak of conception; thus, it is reasonable to infer that more unsafe sexual activities occur during the time of the Spring Festival than during other seasons. As a result, the government can predict the peak of HIV risks, abortions and births based on the timing of domestic holidays to make better arrangements for medical resources and to avoid possible shortages of immunization medicines. Moreover, using population-based data from the Civil Registration System in Denmark, Mortensen etal. (Reference Mortensen, Pedersen, Westergaard, Wohlfahrt, Ewald and Mors1999) found that the risk of schizophrenia is significantly associated with the season of birth; in their study, the highest risk was found for births in February and March, while the lowest risk was found for births in August and September. The long-term effect of birth season on some diseases cannot be neglected in such a large country such as China. In this sense, determining the birth season patterns is necessary for making medical and health policies.
Methods
Data
Chinaʼs Fifth National Population Census (FNPC) was organized by the Chinese National Census Office and carried out in October 2000; the respondents comprised all individuals from 31 provinces who were Chinese nationals residing in mainland China. The 1% micro-sub-sample of the FNPC was employed, which includes information for approximately 11 million individuals. In addition to individuals’ year and month of birth, personal and family characteristics were extracted from the FNPC, including the residentʼs province and rural/urban classification. Using the respondents’ personal ID codes, individuals could be matched with their parents to determine the effect of parental educational attainment. Information for those born far earlier than the study period was comparatively ‘blurred’ and unnecessary in the research, so the focus was only on individuals born between 1976 and 1995, a time span of 20 years, including 3.9 million individuals with their parents’ information.
To compare the seasonal distribution of births in mainland China with that of the United States, which much previous research has focused on, birth-month data from the 2000 Decennial Census were employed, which was closest to the studyʼs focus period. A total of 75 million observations were accounted for in the subsequent time series analyses.
Analysis
Decomposition of time series
The decomposition of time series data is a commonly used method in time series analysis. Monthly births for mainland China and the United States were decomposed into the yearly ‘trend’, ‘seasonality’ and ‘remainder’ using the following additive model:
 $${Y_t} = {\rm{Tren}}{{\rm{d}}_t} + {\rm{Seasonalit}}{{\rm{y}}_t} + {{\mathop{\rm Remainder}\nolimits} _t}$$
where Yt is the number of births in month t. In equation (1), the year trend is defined as a moving average of every 12 months as follows:
 $${\rm{Tren}}{{\rm{d}}_t} = {1 \over {12}}\sum\limits_{i = - 6}^6 {{Y_{t + j}}} $$
The seasonal pattern was estimated by the classic decomposition method, which simply calculates an average of the de-trended value for each season (here, it is each month). Finally, the ‘remainder’ is given by:
 $${Y_t} - {\rm{Tren}}{{\rm{d}}_t} - {\rm{Seasonalit}}{{\rm{y}}_t}.$$
Month-length-corrected birth amplitudes
Because the monthly fluctuation of births partially comes from the fluctuation of month length itself, following the methods of He and Earn (Reference He and Earn2007) and Dorelien (Reference Dorélien2016), month-length-corrected birth amplitudes were calculated using the following three equations:
 $${\bar X_i} = {1 \over {12}}\sum\nolimits_{j = 1}^{12} {{X_{ij}}} $$
 $${C_{ij}} = {{({\rm{Days\,in}}\,{\rm{year}}\,i)/12} \over {{\rm{Days}}\,{\rm{in}}\,{\rm{month}}\,i\,{\rm{of}}\,{\rm{year}}\,j}}$$
 $${Y_{ij}} = {{{C_{ij}}{X_{ij}} - \bar {{X_i}} } \over {\bar {{X_i}} }}$$
Employing information on the year and month of the birth observations in the FNPC database, first the number of monthly births in month j of year i, Xij
, was obtained. Then, equation (3) was used to calculate the average number of births in a month of average length in year i,
 ${\bar X_i}$
. Equation (4) defines the corrected length of month j in year i, Cij
. Finally, equation (5) was used to calculate a scaled, month-length-corrected monthly amplitude of month j in year i, represented by Yij
.
On average, the month-length-corrected monthly amplitude in a given period can be expressed as:
 $${Z_i} = {1 \over {{N_{yr}}}}\mathop {\sum {{Y_{ij}}} }\limits_{years} $$
The study focused on the periodic fluctuation of monthly births over the 20 years from 1976 to 1995, which was artificially divided it into two decades, 1976–1985 and 1986–1995, to study time trends. To obtain the average month-length-corrected monthly amplitude in each decade Nyr = 10 was set, as represented by Zi .
Kolmogorov–Smirnov test
The Kolmogorov–Smirnov (K–S) test was used to assess whether the seasonality of births in groups with different social characteristics had the same distribution, using the formula:
 $${D_{n,m}} = \mathop {\sup }\limits_x |{F_{1,n}}(x) - {F_{2,m}}(x)|$$
where F1,n (x) and F2,m (x) are the empirical distribution functions of the first sample (with a sample size of n) and the second sample (with a sample size of m), and sup is the supremum function. For large samples, the null hypothesis (i.e. that the two samples come from the same distribution) was rejected at the significance level α, if:
 $${D_{n,m}} \gt c(\alpha )\sqrt {{{n + m} \over {nm}}}$$
where
 $$c(\alpha ) = \sqrt { - {1 \over 2}\ln \alpha } $$
Results
The patterns of birth seasonality and related statistics were examined from three different angles. First, country-level analysis was conducted and a cross-national comparison with the United States was made. Second, the use of a large sample allowed cross-provincial differences in the seasonal patterns of births to be analysed. Third, the distribution of monthly births by social groups was determined employing personal and family characteristics from the FNPC database.
Country-level results
Annual and monthly fluctuations
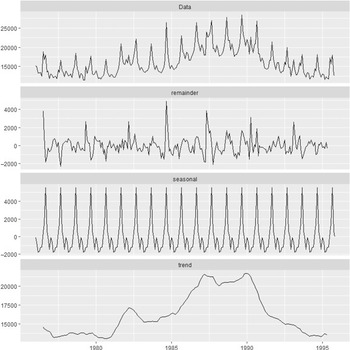
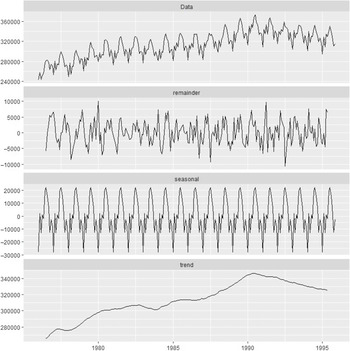
The results for mainland China were compared with those from the United States over the same period. Figure 1 shows the annual birth rate pattern from the decomposition of the Chinese monthly birth data. The number of annual births in the current sample gradually increased from approximately 1980 and then dropped sharply in 1990. The population increased in the early 1980s because there had been a baby boom in the 1960s, and those babies came of marriage and childbearing age in the 1980s. Figure 2 presents the time series decomposition of American monthly births in the same period.
Decomposition of monthly births in China. The x-axis indicates the time for all the four panels. The vertical axis in the ‘Data’ panel indicates the adjusted number of births. In the ‘Remainder’, ‘Seasonal’ and ‘Trend’ panels, the y-axis indicates the decomposition of monthly births. The observed time series equals the sum of annual, seasonal and random trends. Data come from the fifth National Population Census (2000) with 3,874,962 observations taken into account.

Decomposition of monthly births in the United States. The x-axis indicates the time for all the four panels. The y-axis in the ‘Data’ panel measures the adjusted number of births. In the ‘Remainder’, ‘Seasonal’ and ‘Trend’ panels, the vertical axis indicates the decomposition of monthly births. The observed time series equals the sum of annual, seasonal and random trends. Data come from the 2000 Decennial Census, with 75,015,903 observations taken into account.

In the late 1980s, the one-vote veto family planning system began to be implemented in all of China. This policy aimed to reinforce the one-child policy that had been implemented at the beginning of the 1980s by linking the evaluation of cadres with their performance in economic development and family planning work, with the latter being the priority. The cadres were evaluated highly when they did well in both economic development and family planning work but were punished if their performance was bad in family planning despite being good in economic development. In recent years, the one-child policy has been regarded as the culprit of the Chinese ageing population problem; however, in 1990, this problem was not imaginable under the one-vote veto family planning system, and government officers at all levels tried countless ways to control the fertility rate. Indeed, this policy significantly decreased the number of children born after 1990, as the current data show.
The births in China from 1976 to 1995 also exhibit a clear seasonal pattern. By extracting a cycle of seasonal trends from Fig. 1, a major peak in the seasonal distribution of births in China in October and a minor peak in February can be found (Fig. 3a). Figure 1 shows that the average monthly number of births is about 16,000. The seasonal fluctuation is in the range of −2000 to 6000, for which the scale to the average monthly births is about −0.12 to 0.4. It is rare to see such a large fluctuation in monthly birth data, especially in China, as it is a country with a large population.
Seasonal pattern of births in (a) China and (b) the United States. The seasonal trend was extracted from the decomposition of the time series in Figs 1 and 2. The x-axis indicates the sequence of months, beginning with January and ended with December. The percentages on the y-axis indicate the average magnitudes of the monthly fluctuation, scaled to the average monthly births.

Cross-national comparison
Compared with China, the seasonal pattern is greatly different in the United States. This is significant because China and the United States are exactly at the same latitude (except for Alaska, where few people live).
Using the same methods, the monthly birth data from the United States were decomposed into annual trends, seasonality and the remainder as shown in Fig. 2. The population of the United States continued to grow until 1990 and then slowly declined after 1990. What is also interesting is that the remainder in the data of the United States looks more random, but in China, as Fig. 1 shows, the remainder is not random at all. The peaks appear approximately every 3 years. This phenomenon implies that the distribution of birth seasonality is complex and may correlate to some unobservable factors.
In the United States, birth seasonality shows peaks in August and September, while the minor peak is in February, and the trough is in January or March (Fig. 3b). The average number of monthly births in the United States is about 31,000. The magnitude of seasonal fluctuation is always between −30,000 and 20,000, which is in the range of (−0.1, 0.06), scaled to the average monthly births, compared with a (−0.12, 0.4) magnitude in mainland China.
The Spring Festival effect
Under the assumption that fetal loss holds constant for months or only exerts a modest effect on births, the time of birth depends on the time of conception. The lunar calendar regularly changes each year based on the perspective of the solar calendar. The FNPC investigates the birth month of individuals using the solar calendar, which makes it possible to observe the annual changes in birth months as they relate to the time of the Spring Festival (Lunar New Year). Figure 4 shows time series representations of the relationship between the timing of the Spring Festival and birth months from 1976 to 1995 in mainland China. The left y-axis represents the Spring Festival date in the solar calendar. A higher y value represents an earlier Spring Festival. The right y-axis represents the proportion of births from October to November. Assuming 40 weeks of pregnancy, the predicted birthdays for January conceptions are in October, and if conception occurs in February, the predicted birthday will be in November. Figure 4 shows that although the peak of births consistently exists in October, the magnitude varies with the time of the Spring Festival. This illustrates that the Spring Festival indeed has influence on the seasonality of births in a great number of families.
Correlation between the timing of the Spring Festival and proportions of births in October and November. Earlier (January) Spring Festivals are correlated with higher proportions of October births relative to November births. The left-hand y-axis represents the solar calendar date of the Spring Festival. The right-hand y-axis represents the number of births in October over November. The proportions of births in October over November are always larger than one, indicating that the births in October are always more than in November. The x-axis is the time series on year (1976–1995).

The above finding provides a partial explanation as to why there is always a peak of Chinese births in October. The current hypothesis is that for urban residents, the Spring Festival is a long holiday that allows them to have enough leisure time for conception. At the same time, in rural areas, because a large number of rural labourers work in cities to earn money, the Spring Festival is an important time for them to return home and be together with their families, thereby creating a chance for them to conceive a baby.
Undoubtedly, the seasonal pattern of births is a superposition of all the factors and an error term, and subsequent sections of this paper look at social factors to determine why the seasonal fluctuation of births is so large in mainland China and how it varies with other variables.
Province-level results
The province-level analysis provides an overview of the seasonality of Chinese births, i.e. wherever the provinces are located in the vast mainland Chinese territory, people living in most of the provinces have the same or similar features of their seasonal distribution of births, with only subtle differences. It is important to remember that the identical patterns are still dominant.
A geographic analysis (Fig. 5) shows the patterns in a more detailed way, as the 31 provinces are divided into four tiers by different magnitudes of peaks in their October births, represented by different colours. Based on the results shown on the map, the birth rates of almost all the provinces have peaks in October, yet subtle differences exist in the magnitude of these peaks. In general, the magnitudes of the south provinces are stronger than those of the north. Another clear pattern is that the magnitudes of the coastal areas are always stronger than those of the inland areas.
Average amplitude of births in October 1976–1995 by Chinese province, calculated using equation (6). The provinces are divided into five groups by different levels of births in October, indicated by different colours from shallow to deep representing ‘no data’, ‘[-0.178, 0.21]’, ‘(0.21, 0.31)’, ‘(0.31, 0.317)’, and ‘(0.317, 0.486]’, respectively. The numbers in the legends indicate the proportion of births in October over average monthly births, so, the darker the shading, the more children born in October in that province than the monthly average.

The results suggest that the direction of population flow is the main reason for these spatial patterns. In southern mainland China, a great number of farmer workers find jobs in large cities in coastal areas. In northern China, Hebei Province provides a considerable number of labourers for the Chinese capital area (the cities of Beijing and Tianjin). Gansu Province is almost the poorest province in China. Many rural residents of Gansu labour as farm workers in the nearby cities. These facts may explain why Hebei and Gansu Provinces are the provinces with the highest peaks in the north.
Results in different social groups
The monthly variations in Chinese births from 1976 to 1995 were compared for different social groups: rural–urban residence, highest parental education level and the fatherʼs occupation. The variation of the monthly birth amplitude was compared within different groups. A t-test was used to test whether the average number of births per month was significantly different within different social characteristics. The Kolmogorov–Smirnov (K–S) test was used to determine whether different social groups had significantly different distributions of births per month (see Tables 1–3).
Comparison of monthly amplitude of births in urban and rural areas of mainland China, FNPC, 2000

The null hypothesis for the t-test is that the average month of birth is the same in the urban and rural sample. The null hypothesis for the Kolmogorov-Smirnov (K–S) test is that the urban sample has the same distribution of monthly births as the rural sample.
*** p≤0.01.
Monthly amplitude of births by parents’ education level, FNPC, 2000

The null hypothesis for the t-test is that the average month of birth is the same in two samples. The null hypothesis for the Kolmogorov–Smirnov (K–S) test is that the host sample has the same distribution of monthly births as the partner sample.
*p≤0.1; **p≤0.05; ***p≤0.01.
Monthly amplitude of births by fatherʼs occupation

The null hypothesis for the t-test is that the average month of birth is the same in the two samples. The null hypothesis for the Kolmogorov–Smirnov (K–S) test is that the host sample has the same distribution of monthly births as the partner sample.
*p≤0.1; **p≤0.05; ***p≤0.01.
Both the average birth season and birth amplitude distribution across the years are significantly different in urban and rural areas (Table 1). The rural sample shows a higher peak amplitude in October than the urban sample (Fig. 6). Of the approximately 12 million observations, 9 million represent residents in rural areas and approximately 3 million in urban areas; however, in rural areas, 33% more people were born in October than the average number of monthly births, while this number was 25% in urban areas. Meanwhile, it is also evident that fewer births occur in January and July in rural areas compared with urban areas.
Average monthly birth amplitude by urban–rural residence. The x-axis indicates the sequence of month, beginning with January and ending with December. The y-axis represents the average magnitude of the monthly fluctuation, scaled to the average monthly births. The number of monthly births has been corrected by month length. The study period was from January 1976 to December 1995.

Parental education also seems to have a significant effect on fertility plans (Fig. 7 and Table 2). Highest parental educational attainment was grouped as: less than a primary education, primary education, secondary education and university education. The ‘less than a primary education’ group is significantly different from the other three groups (Table 2). Parents with primary education have a higher October birth peak compared with the lowest education group. Parents in the ‘less than primary education’ group have a unique and flatter distribution in the monthly number of births of their children. This result is contrary to that of Warren and Tyler (Reference Warren and Tyler1979), assuming a lower education level represents a lower social status.
Average monthly birth amplitude by parents’ educational attainment. The x-axis indicates the sequence of months, beginning with January and ending with December. The y-axis represents the average magnitude of the monthly fluctuation, scaled to the average monthly births. The number of monthly births has been corrected by month length. The study period was from January 1976 to December 1995.

A difference in the distribution of monthly amplitude can also be found for fatherʼs occupation (Fig. 8 and Table 3). In Fig. 8, six types of occupations are shown with their corresponding monthly amplitudes: senior officers or managers, professionals, services and sales workers, agricultural and fishery workers, craft and trade workers, and plant and machine workers, most of which have significantly different means (except managers versus services, professionals versus services and professionals versus plants workers) and distributions (except professionals versus plants workers) (Table 3). Within these occupations, agricultural and fishery workers have the highest peak of October births, and craft and trade workers the second-highest peak, but the differences between the groups are not large.
Average monthly birth amplitude by fathers’ occupation. The x-axis indicates the sequence of months, beginning with January and ending with December. The y-axis represents the average magnitude of the monthly fluctuation, scaled to the average monthly births. The number of monthly births has been corrected by month length. The study period was from January 1976 to December 1995.

When comparing different family and social backgrounds, the patterns can be briefly summarized as follows: i) the birth distributions of different social groups have the same seasonal pattern, ii) the birth distributions in rural areas are higher in magnitude than those in urban areas, and iii) parents with junior high school education are more likely to have given birth to their children in October than parents with other degrees of education.
Discussion
The country-level, provincial-level and family-level results based on a large sample from mainland China show that the monthly or seasonal patterns of births (with a significant peak in October) are similar in different social groups with different social characteristics, but there are tiny differences in magnitude in all areas (except for some minority groups) and social groups. This result is consistent with the research that focused on Chinese people living overseas (Abeysinghe, Reference Abeysinghe1991). The periodically directed migration of rural labour may partially explain the persistent peak in births in October. The annual ‘Spring Festival travel rush’ transports hundreds of millions of migrant workers from Chinaʼs economically developed cities to their homes in rural areas – the largest-scale human migration activity in the modern world. Similar examples of population migration affecting seasonality of births can be found in sub-Saharan Africa, where migrants stay at home to plant crops during the rainy season and migrate in search of work in the dry season. Higher educated women in sub-Saharan Africa have been shown to exhibit weaker seasonal magnitudes in their birth patterns (Dorélien, Reference Dorélien2016), and a similar result was found in the present study.
This theory can also explain the minor peak of births in February in China because the second longest holiday (of 7 days) is International Workers’ Day in May (nine months from February); however, this is not a festival represented by family gatherings in China, so workers in cities are not as eager to go back home as they are for the Spring Festival.
Provincial differences can also be partially explained by rural workers’ migration. The northern Chinese provinces of Henan, Hebei and Gansu have the highest October birth peaks. This is possibly because they are the provinces with the largest proportions of farmers in northern China. Moreover, Hebei surrounds Beijing and Tianjin, which are the Chinese capital and an important city, respectively; thus, a large portion of the Hebei population works in these two cities and only go back home during holidays. In the southern provinces, the peaks of births in October are much higher for the inland provinces than the coastal provinces. This is because the Chinese south-eastern coastal areas are much richer and more developed, and absorb large numbers of labourers from the inland areas. In particular, Guangdong Province contains Shenzhen and Zhuhai, which were designated special economic zones in the 1980s and became seen as the ‘promised land’ for people in the surrounding provinces.
Comparisons of different social groups also provide supportive evidence for the studyʼs hypothesis. First, it is natural that the study rural sample would have a larger number of births in October and February because most of the migrant workers were originally from rural areas (Fig. 6). This result cannot be explained by leisure time because urban workers and rural workers always have the same leisure time during holidays. Second, a comparison of parental education levels shows a contrasting result to those of former studies, i.e. that there was greater variation of seasonal births with lower social status. The possible reason for this outcome is shown in Fig. 7; parental education is strictly defined as their highest educational attainment, which means that those couples whose highest educational attainment was ‘less than primary’ may have found it hard to find a job in the cities. As a result, both of such parents may remain farmers. This could explain why the seasonal distribution of births was flattest in the ‘less than primary’ education group.
Other behavioural factors may also affect the seasonality of births – for example, marriage (Grech et al., Reference Grech, Savona-Ventura, Agius-Muscat and Janulova2003). In China, especially rural areas, people prefer to get married during the Spring Festival because, first, they can go back home at that time, and second, their friends and families will also go back home and they will thus earn more wedding gift money. Birth order and parental income have also been found to be related to the seasonality of births (Bobak & Gjonca, Reference Bobak and Gjonca2001; Benderlioglu & Nelson, Reference Benderlioglu and Nelson2004; Greksa, Reference Greksa2004). Unfortunately, due to the limitations of the data, this study did not provide any evidence on these factors in China.
The study results suggest that season of birth may not be a good instrument to study the economic ‘return’ from schooling in China, because it is significantly correlated to family location and parental education and occupation. Although controlling for these variables in the regression is possible, the unobservable variables correlated with them cannot be controlled. For example, parental education can be controlled for in the regression, but parents’ education may correlate with ability level, which can be genetically inherited by their children and thus affect the childrenʼs outcomes in the future. In the case that parents’ education affects childrenʼs birth season, the IV estimator will be biased and will thus fail to identify the causal effect of education.
Biological factors certainly affect the seasonality of births in mainland China. For example, agricultural and fishery workers have larger seasonal variations of births that can partially be explained by weather and rainfall. On the other hand, behavioural factors can only partially explain the seasonality of conception; fetal loss, sperm motility and menstrual periods are more relative to biological factors, including weather, rainfall and sunshine (Wehr, Reference Wehr1998; James, Reference James1990; Bronson, Reference Bronson2004; Cumming, Reference Cummings2010). However, this study has demonstrated that behavioural factors are more important in mainland China. Only these can explain the uniform seasonal pattern of births in different areas of the country with different climates, and the comparison between two countries with similar area and latitudes, China and the United States.
In conclusion, this study of the seasonal patterns of births in mainland China using a large sample found that Chinese migration and the ‘Spring Festival effect’ jointly determine the seasonality of births.
Acknowledgments
The author would like to thank Omori Yoshiaki and Zhang Junchao for their constant encouragement and guidance, and two referees for their very helpful comments. Any remaining errors are the responsibility of the author.
Funding
This research received no specific grant from any funding agency, commercial entity or not-for-profit organization.
Conflicts of Interest
The authors have no conflicts of interest to declare.
Ethical Approval
The authors assert that all procedures contributing to this work comply with the ethical standards of the relevant national and institutional committees on human experimentation and with the Helsinki Declaration of 1975, as revised in 2008.