


Introduction
Sickness behavior is a well-described phenomenon in both animal models and humans (Anisman et al., Reference Anisman, Merali and Poulter2005; Dantzer, Reference Dantzer2009; Harden et al., Reference Harden, Kent and Pittman2015). It refers to a set of specific behaviors that occur in response to systemic inflammation, such as lethargy, decreased appetite, reduced social behaviors and mobility, decreased libido, cognitive impairment reflected in recall and reaction times, weight loss, hyperalgesia, and depressed affect (Shattuck and Muehlenbein, Reference Shattuck and Muehlenbein2016). Interestingly, sickness behavior is thought to provide an adaptive response to illness by conserving energy that would be needed to fight infection (Hart, Reference Hart1988; Shakhar and Shakhar, Reference Shakhar and Shakhar2015). However, many of the symptoms ascribed to sickness behavior overlap with the diagnostic criteria for depression and suggest that this vestigial response to illness may also lead to pathogenic behaviors (American Psychiatric Association, 2013). This suggests that inflammation, sickness behavior, and depression may be interrelated, though the true nature of these relationships is not known (Dantzer, Reference Dantzer2004). In the context of serious illness, systemic inflammation may exist due to multiple etiologies and therefore may impress a cumulative effect on the patient. This is especially relevant in cancer settings, where patients may experience inflammation from not only the underlying disease but also its treatments, many of which are immunomodulating, and the psychological stress of coping with cancer. Therefore, understanding the etiology of sickness behavior in the context of advanced cancer is a complex task but has the potential to vastly improve clinical care.
While many studies have established an association between inflammation and depression, the directionality of the relationship is not clear (Stewart et al., Reference Stewart, Rand and Muldoon2009; Sotelo et al., Reference Sotelo, Musselman and Nemeroff2014; Strawbridge et al., Reference Strawbridge, Arnone and Danese2015). The relationship between inflammation and depression may be better understood once it is possible to accurately consider sickness behavior as a differential diagnosis. For example, inflammation that stems from a biological cause is thought to lead to depression. However, other evidence suggests that depression in the absence of medical illness (or other cause for inflammation) can directly lead to inflammation (Stewart et al., Reference Stewart, Rand and Muldoon2009). In short, depression due to inflammation may represent a distinct subtype of depression that is more common in patients with medical illness (Dantzer et al., Reference Dantzer, O'Connor and Freund2008). That is, somatic symptoms of depression may become more pronounced in the presence of inflammation from illness but the cognitive symptoms of depression (e.g., low self-esteem, feelings of worthlessness, or guilt) may be less pronounced (Anderson et al., Reference Anderson, Berk and Maes2014). In this regard, while the association between depression and inflammation is well-established, the causal links and directionality between these constructs remain unclear (Tobias et al., Reference Tobias, Rosenfeld and Pessin2015).
The ambiguity in this relationship is further amplified by the criteria used to identify and categorize depression in patients with cancer (Olbert et al., Reference Olbert, Gala and Tupler2014). Differentiating depression that is related to inflammation (i.e., sickness behavior) from depression that may be more psychogenic in origin has important treatment implications (Miller and Raison, Reference Miller and Raison2015; Miller et al., Reference Miller, Trivedi and Jha2017). Depressed patients who exhibit high levels of inflammation may benefit from treatment that addresses the source of inflammation and may show a differential response to antidepressant medications (Uher et al., Reference Uher, Tansey and Dew2014; Felger et al., Reference Felger, Li and Haroon2016; Kappelmann et al., Reference Kappelmann, Lewis and Dantzer2018). Given the scarcity of mental health resources in cancer settings, appropriate triaging and targeted treatment of depressive symptoms is critical. Greater specificity in screening and assessment would optimize referrals for depression care and non-mental health professionals could be trained to identify and treat sickness behavior, thus minimizing unnecessary burden on mental health services.
Patients with lung cancer represent an ideal population for exploring the interrelationships between depressive symptoms, inflammation, and sickness behavior. First, lung cancer, and small cell lung cancer (SCLC) in particular, has one of the highest rates of co-morbid depression among all cancer types (Hopwood and Stephens, Reference Hopwood and Stephens2000; Mitchell et al., Reference Mitchell, Chan and Bhatti2011). Furthermore, cancer (and metastatic cancer in particular) is strongly associated with inflammation, and inflammation has even been used as a prognostic marker to gauge survival. Namely, the pro-inflammatory cytokines tumor necrosis factor α (TNF-α) and interleukin-6 (IL-6), and the acute phase reactant C-reactive protein (CRP) have most commonly been associated with depressive symptoms in patients with lung cancer (Du et al., Reference Du, Zhang and Li2013; McFarland et al., Reference McFarland, Shaffer and Breitbart2019). Co-morbid depression worsens quality of life and is associated with decreased survival rates for patients with lung cancer (Satin et al., Reference Satin, Linden and Phillips2009). A further understanding of the underlying biology of depression will facilitate the identification of optimal patient-centered depression treatments in cancer (Young and Singh, Reference Young and Singh2018).
The Sickness Behavior Inventory (SBI) was developed to measure symptoms associated with inflammation-induced sickness behavior (Raison and Miller, Reference Raison and Miller2003; Tobias et al., Reference Tobias, Lehrfeld and Rosenfeld2017). This self-report measure was designed to quantify the severity of sickness behavior symptoms, in order to facilitate differentiating those symptoms induced by inflammation vs. depressive symptoms that may be more psychogenic in origin. The original version of the SBI was studied in a sample of patients with pancreatic cancer and was significantly associated with elevated levels of IL-6 (Tobias et al., Reference Tobias, Rosenfeld and Pessin2015). Recently, this measure was revised and expanded to improve its reliability and structural validity (the SBI-R), but no published research has addressed the utility of this measure, nor the extent to which the SBI-R can be differentiated from more general measures of depression (Tobias, Reference Tobias2017).
The aim of this study was to assess the preliminary psychometric properties (i.e., reliability and validity) of the SBI-R and to explore the association between sickness behavior, depressive symptoms, and inflammation in a sample of patients with metastatic lung cancer. It was hypothesized that the SBI-R would demonstrate adequate levels of reliability and convergent validity in patients with metastatic lung cancer. Specifically, we anticipated that the SBI-R would have internal consistency (Cronbach's coefficient alpha) of 0.70 or greater, with inter-item correlations ranging from 0.20 to 0.70, and that the 12 items would load onto a single factor. In addition, we hypothesized that the SBI-R would be significantly correlated with depressive symptoms and inflammation, but that the SBI-R would be more strongly associated with inflammation than depressive symptoms.
Methods
The Memorial Sloan Kettering Cancer Center Institutional Review Board (IRB) approved this study MED18-165, “Survey of Routine Markers of Inflammation and Psychological Variables in Patients with Metastatic Lung Cancer.” Surveys and lab values were collected from May 2017 to November 2017.
Participants and procedures
Patients with stage IV lung cancer confirmed by histology were included. These criteria included patients with non-small cell lung cancer (NSCLC) and small cell lung cancer (SCLC) as well as other less common types of lung cancer. They were all undergoing active anticancer treatments, spoke English, and had an Eastern Cooperative Group performance status of less than or equal to 2 to be included (Oken et al., Reference Oken, Creech and Tormey1982). Patients had to be on active treatment for at least 1 month and had to be more than 1 month from receiving the diagnosis of lung cancer to be included.
Patients completed study measures provided by a treating staff member and laboratory values were obtained the same day that the questionnaires were completed. Patients were recruited at routine follow-up medical oncology appointments. Some patients contributed longitudinal data by completing questionnaires and laboratory information subsequently based on convenience and follow-up (n = 39 of 92, 42.4%). Information on available psychological services was provided in the survey, which encouraged patients to raise any concerns with clinic staff and, in particular, to tell a staff member if they felt significantly depressed or had suicidal ideation. Patient participants were not compensated.
Measures
Demographic information
Demographic information was obtained from the electronic medical record. Information that was obtained included sex, age, race/ethnicity, body mass index (BMI), marital status, length of time with disease, systemic treatment type (e.g., chemotherapy, immunotherapy, and targeted therapy), line of treatment (i.e., 1st line, 2nd line, 3rd line, or beyond), and whether an antidepressant medication was on their list of medication at the time of survey.
Inflammation
CRP was used to collect information on Inflammation. CRP values were collected using routine clinical laboratory procedures (Howren et al., Reference Howren, Lamkin and Suls2009; Rashmi et al., Reference Rashmi, Galhotra and Goel2017). CRP confers several advantages over measuring pro-inflammatory cytokines (PIC). CRP does not exhibit diurnal variation which is inherent to PICs. CRP is a large protein produced by the liver that has a relatively long half-life as an acute phase reactant; it does not exhibit the diurnal variations and fluctuations that are evident by the shorter half lives of PICs. Moreover, CRP responds to multiple PICs, especially IL-6, and therefore acts as an indirect marker of inflammation (Moshage et al., Reference Moshage, Janssen and Franssen1987; Steel and Whitehead, Reference Steel and Whitehead1994). CRP has been most consistently associated with depression when compared to other PIC depression biomarkers (Howren et al., Reference Howren, Lamkin and Suls2009; Wium-Andersen et al., Reference Wium-Andersen, Orsted and Nielsen2013; Misiak et al., Reference Misiak, Beszlej and Kotowicz2018) Also, a CRP cut-point has been defined as 1 mg/L to indicate elevated inflammation by the American Heart Association and this cut-point has been used in antidepressant trials (Myers et al., Reference Myers, Rifai and Tracy2004; Uher et al., Reference Uher, Tansey and Dew2014). In general, CRP levels less than 0.3 mg/dL are considered normal and seen in most healthy adults; 0.3–1.0 mg/dL is normal to minor elevation; 1.0–10.0 mg/dL is moderate elevation; more than 10.0 mg/dL is marked elevation; and more than 50.0 mg/dL is severe elevation (Nehring et al., Reference Nehring, Goyal and Bansal2020). In this study, a CRP value was obtained by turbidimetric immunoassay in a Clinical Laboratory Improvement Amendments (CLIA) certified lab (Pineiro et al., Reference Pineiro, Pato and Soler2018). Inter- and intra-assay coefficient of variation is reliably less than 5%.
Depression
Severity of depression was measured with two scales, the Patient Health Questionnaire-9 (PHQ-9) and the Hospital Anxiety and Depression Scale-Depression (HADS-D). The PHQ-9 is a nine-item measure that elicits responses on a scale from 0 to 3 based on the frequency with which each symptom occurs (i.e., not at all, several days, more than half the days, and nearly every day) over the previous two weeks. Total scores range from 0 to 27, with higher scores indicating greater severity of depressive symptoms (Kroenke et al., Reference Kroenke, Spitzer and Williams2001). It has been frequently used in the cancer setting and found to perform well as a continuous measure using a cutoff score of ≥10 to signify clinically significant depressive symptoms (Thekkumpurath et al., Reference Thekkumpurath, Walker and Butcher2011; Manea et al., Reference Manea, Gilbody and McMillan2012). Past research has reported an average sensitivity rate of 0.77 (0.71–0.84) and specificity of 0.94 (0.90–0.97) for identifying a diagnosis of depression (Wittkampf et al., Reference Wittkampf, Naeije and Schene2007). The rationale underlying the use of PHQ-9 was its high test–retest reliability, which ranges from 0.81 to 0.96 (Lowe et al., Reference Lowe, Kroenke and Herzog2004). The HADS-D was used as a measure of depression severity that does not utilize physical parameters of depression and was created for purposes of identifying clinically significant cases of depressive disorders among medically ill patients (Bjelland et al., Reference Bjelland, Dahl and Haug2002). Physical symptoms related to medical illness (sleep, appetite disturbance, or fatigue) are excluded from the HADS-D to reduce confounding between depression and physical illness specifically. The HADS-D has been validated in lung cancer settings (Bjelland et al., Reference Bjelland, Dahl and Haug2002; Schellekens et al., Reference Schellekens, van den Hurk and Prins2016). It is a 7-item symptom rating scale was with a total score that may range from 0 to 21 points based on individual responses rated from 0 to 3 points. A cutoff of 8 confers an average sensitivity and specificity of 0.80 and is most commonly used to identify clinically significant cases of depression (Zigmond and Snaith, Reference Zigmond and Snaith1983; Bjelland et al., Reference Bjelland, Dahl and Haug2002).
Sickness behavior
The SBI-R was developed to measure inflammation-induced sickness behavior using symptoms that have been most consistently reported in the literature (Kent et al., Reference Kent, Bluthe and Kelley1992; Raison and Miller, Reference Raison and Miller2003; Dantzer and Kelley, Reference Dantzer and Kelley2007), including anhedonia, psychomotor retardation, anorexia/weight loss, decreased libido, fatigue, hyperaglesia, sleep disturbance, cognitive disturbance, and social isolation. Items are rated on a scale of 0–3, corresponding to severity of the symptom in the preceding 48 h.
Statistical analysis
Univariate analyses were used to evaluate associations between SBI and depressive symptoms (PHQ-9 and HADS-D) and CRP using Spearman correlation coefficients. Internal consistency was calculated (Cronbach's coefficient alpha), along with inter-item correlations. Analyses examining other potential covariates used independent sample t-tests or ANOVAs. CRP values were log-transformed prior to these analyses since CRP data were not normally distributed; however, untransformed values were also reported for ease of interpretation. The unique contributions of SBI and depressive symptoms in predicting CRP levels were examined using multiple regression models, including covariates identified as statistically significant and those identified as potentially relevant a priori. Receiver Operator Curve analysis was performed to identify optimal cutoff scores for SBI-R using known and established cut-points of 1 mg/L for CRP and 10 for PHQ-9. A longitudinal analysis was conducted for a subset of participants based on convenience and follow-up in clinic. These longitudinal analyses are exploratory and measured differences in SBI-R and CRP between two time points using paired t-tests and Spearman rank correlations between two time points. SBI-R and CRP values were log converted prior to measuring differences to account for non-normal distributions.
Results
Out of 120 potential respondents, 92 returned survey questionnaires (77% response rate). Demographic information is presented in Table 1. The average depression score (PHQ-9) was 6.0 (SD = 4.9) with 27.2% falling above the cutoff score for clinically significant depression. The average depression score using the HADS-D was 4.7 (SD 3.6). The mean CRP score was 1.37 mg/L (SD = 2.5) with a range from <0.05 to 15.5 mg/L. Fifty-five patients (60%) had CRP values above 1.0 mg/L and 26 patients (28%) had CRP values above 3.0 mg/L. These cut-points have been used to identify elevated inflammatory levels (Uher et al., Reference Uher, Tansey and Dew2014; Felger et al., Reference Felger, Haroon and Patel2020).
Clinical and demographic characteristics of the sample and associations with SBI-R

PHQ-9, Patient Health Questionnaire; SBI-R, Sickness Behavior Inventory-Revised.
The sample mean for the 12-item SBI-R was 8.3 (6.7) with a range from 0 to 33 (possible range: 0–36).The SBI-R demonstrated adequate internal consistency with a Cronbach's coefficient alpha of 0.85. Corrected item-total correlations ranged from 0.27 (item 10, sleep disturbance) to 0.80 (item 7, motivation to engage in enjoyable activities). Cronbach's coefficient alpha did not increase significantly (>0.01) with the removal of any item. Factor analysis was also used to identify the relative contributions of each item for the construct of sickness behavior. This analysis examined factor loadings onto a single factor extracted using the principle components method. Of the 12 SBI-R items, 11 had factor loadings that exceeded 0.40 (typically used as a threshold for identifying meaningful factor loadings) (Hair et al., Reference Hair, Tatham and Anderson1998). Only item 10 had a factor loading below 0.40, at 0.396.
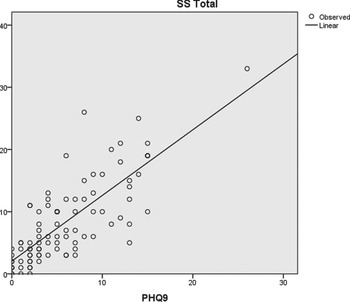
Concurrent validity of the SBI-R was evaluated by examining the associations between depressive symptoms, inflammation, and SBI-R individual items and total score (Table 2). The SBI-R total was significantly correlated with depressive symptoms (PHQ-9: r = 0.78, p < 0.001; HADS-D: r = 0.77, p < 0.001) and CRP (r = 0.47, p < 0.001). Each item on the SBI-R was also significantly associated with PHQ-9 total score, with correlations ranging from r = 0.27, p = 0.01 (SBI-R item 12: memory functioning) to r = 0.65, p < 0.001 (SBI-R item 7: motivation). However, CRP levels were significantly associated with only 5 of the 12 SBI-R items. The strongest correlation was with item 8 (enjoyment of activities: r = 0.38, p < 0.001). In addition, SBI-R scores were significantly higher in patients receiving chemotherapy (M = 10.4, SD = 7.5) vs. those patients taking oral targeted therapies (M = 4.9, SD 3.8), t = 3.53, p = 0.012. SBI-R total scores were also higher in non-white patients (M = 13.7, SD = 8.5) than white patients (M = 7.4, SD = 5.9), t = −2.52, p = 0.024. However, CRP levels were higher in non-white vs. white patients (3.51 vs. 1.06 mg/dL, respectively) (t = 2.86, p = 0.005). Of note, levels of depressive symptoms were also higher in non-white vs. white patients (8.38 vs. 5.57) but were not significantly different (t = 1.42, p = 0.18). However, the reason why inflammation and depression may be higher in non-white populations is not clear. No significant associations were observed with any other demographic or clinical variables (e.g., age, gender, BMI, and line of treatment; Table 1).
SBI-R item means and association with depression and inflammation

CRP, C-reactive protein; HADS-D, Hospital Anxiety and Depression Scale-Depression; PHQ-9, Patient Health Questionnaire; SBI-R, Sickness Behavior Inventory-Revised; SD, Standard Deviation.
Associations between depressive symptoms and CRP have been reported previously (McFarland et al., Reference McFarland, Shaffer and Breitbart2019) but are noted here for comparison to the SBI-R; CRP values were significantly correlated with PHQ-9 (r = 0.35, p < 0.001) and HADS-D (r = 0.34, p 0.001). Multiple regression analyses revealed that SBI-R total scores explained significant variance in CRP levels beyond that explained by PHQ-9 total scores, with the two variables explaining 18% of the variance in CRP values (Table 3). However, when the order of entry was reversed, PHQ-9 scores did not add to the variance explained by SBI-R total scores. A similar pattern was demonstrated when PHQ-9 was replaced by HADS-D (Table 4). HADS-D did not add to the variance explained by SBI-R scores. These models did not demonstrate problematic collinearity (tolerance 0.360; variance inflation factor 2.77).
Hierarchical regression models predicting inflammation (CRP) built from PHQ-9 and SBI-R

PHQ-9, Patient Health Questionnaire-9; SBI-R, Sickness Behavior Inventory-Revised.
Hierarchical regression models predicting inflammation (CRP) built from HADS-S and SBI-R

HADS-D, Hospital Anxiety and Depression Scale-Depression; SBI-R, Sickness Behavior Inventory-Revised.
Exploratory analyses
Classification analyses, using Receiver Operating Characteristic Curve (ROC) analysis, was used to identify the optimal cut-point for identifying clinically significant scores on the SBI-R. Given the absence of external indicators of impairment, we utilized the established CRP value of 1.0 to determine the optimal cut-point for maximizing sensitivity and specificity (Figure 1). This analysis suggested that an SBI-R total score of 9 or greater provided the optimal discrimination between those with elevated and non-elevated CRP levels, with sensitivity of 54.1 and specificity of 66.7. The area under the curve (AUC) associated with this model was 0.721 (p = 0.001). Similarly, we utilized the established PHQ-9 value of 10 as a depression screening cut-point to identify clinical depression and found that the SBI-R total score of 9 or greater provided optimal discrimination with a sensitivity of 53% and specificity of 91% for high SBI-R scores (Figure 2).
ROC curve of the SBI-R predicting for inflammation: CRP >1 mg/dL.

ROC curve of the SBI-R predicting for depression: PHQ-9 >10.

Of the 92 patients for whom baseline data was available, 39 completed all study measures at a second time point. There were no significant differences in demographics, treatment characteristics, depressive symptoms or CRP levels between those who completed measures at a second time point and those who did not. The average time between the surveys was 3 months. There were no significant differences in SBI-R or CRP between the two time points. SBI-R at time 1 was highly correlated to SBI-R at time 2 (r = 0.67, p < 0.001) and CRP values were correlated between the two time points (r = 0.42, p = 0.01) (Table 5). None of the individual items on the SBI-R were significantly different and several were significantly correlated between the two time points (psychomotor retardation, pain severity, libido, fatigue, decreased socializing, and memory function). An analysis of SBI-R correlations with CRP at time point 2 are provided (n = 39) as a point of comparison with the primary analysis (n = 92). SBI-R at time 2 was highly correlated with CRP (r = 0.58, p < 0.001). Changes between time point 1 and 2 on the SBI-R and CRP were also significantly correlated (r = 0.42, p = 0.01).
Exploratory analysis of the SBI-R and inflammation at two time points

CRP, C-reactive protein; SBI-R, Sickness Behavior Inventory-Revised.
Discussion
Sickness behavior is a clinical phenomenon that manifests as several distinct but interrelated symptoms. Although it is well-described, its measurement has received minimal attention, and therefore, the literature on sickness behavior measurement is limited. The development of the SBI-R is one of the first formal attempts to measure sickness behavior in the cancer context. Quantitatively measuring the extent of sickness behavior may inform our understanding of inflammatory depression; simultaneously, it may help explain acute behavioral symptoms secondary to inflammation, even when not associated with depression. Thus, a scale that measures a composite of sickness behavior symptoms and generates an estimate of the severity of sickness behavior is useful for clinical and research purposes. The SBI-R facilitates the description of sickness behavior and may help elucidate the underlying biological mechanism of depression when both depressive symptoms and inflammation are present. This description is particularly apt for medically compromised populations such as patients with metastatic lung cancer where both depression and inflammation are elevated.
This is the first clinical population in which the SBI-R has been psychometrically evaluated. A prior version of this scale was examined in a sample of patients with metastatic pancreatic cancer (Tobias et al., Reference Tobias, Rosenfeld and Pessin2015). Results from the initial validation study and the current results share many similarities and support the hypothesis that sickness behavior is a unique clinical entity worthy of study. The prior version of the SBI demonstrated moderate reliability (Cronbach's alpha = 0.66) and total scores were significantly correlated with IL-6 levels (r s = 0.26, p = 0.03). An expanded version of this scale was developed by Tobias (Reference Tobias2017) who found stronger internal consistency (Cronbach's alpha = 0.80–0.85) but found that there was no significant correlation with IL-6 in that sample, as most patients were in remission and/or had very low levels of inflammation (r = 0.15, p = 0.30). While IL-6 was measured in the first sample, CRP was included in this study as an inflammatory marker due to its several unique advantages over cytokines including measurement stability and clinical utility across clinical populations.
The SBI-R demonstrated strong internal consistency (Cronbach's coefficient alpha = 0.85) in this sample of patients with metastatic lung cancer as well as a moderate association with inflammation. However, less than half of the SBI-R items were significantly correlated with inflammation, raising questions about whether each of the items are equally salient to the construct of sickness behavior. It is possible that the number of items on the scale could be reduced while still capturing the construct and minimizing measurement burden. At the same time, the longitudinal exploratory analysis found that SBI-R was correlated with CRP at both time points and found that changes in CRP between the two time points were correlated with changes in SBI-R. Future research should utilize larger samples, more sophisticated data analysis techniques (e.g., item response theory), and measure the relative stability of SBI-R responses (i.e., test–retest reliability). These techniques could determine the utility of the SBI-R in measuring the underlying construct of sickness behavior.
The current findings identified a stronger relationship between sickness behavior via the SBI-R and inflammation than between depressive symptoms and inflammation (i.e., β = 0.45 vs. β = 0.33, respectively). Thus, the SBI-R does appear to measure a construct that is distinct from (though partially overlapping with) depressive symptoms and may be useful in helping to answer the question of how inflammatory depression is phenotypically distinct from general, non-inflammation associated depression. Presently, this subtype of depression is best conceived as a manifestation of chronic inflammation related to key symptoms that overlap with depressive symptoms. Also, the SBI may be used to help identify sickness behavior symptoms that may not precipitate over depression and may be clinically distinct from depression (i.e., sickness behavior symptom cluster but without depression). This clinical phenomenon needs further explanation and would benefit from the introduction of this objective measure to help facilitate its study as a unique psychological entity. The SBI-R may help inform the recognition and management of depression since both the diagnosis and treatment of depression is challenging in medical settings (Grassi et al., Reference Grassi, Caruso and Sabato2014; Saracino et al., Reference Saracino, Rosenfeld and Nelson2018).
In addition to the poor rates of recognizing depression in the lung cancer setting, uptake of depression treatments is also far from ideal, despite its associations with worse overall survival (Sullivan et al., Reference Sullivan, Forsberg and Ganzini2016a, Reference Sullivan, Forsberg and Ganzini2016b). A further examination of depression as an inflammatory process may actually increase the identification of depression, especially in a medical setting where inflammation can be monitored alongside other medical issues. SBI-R values above 9 were identified as an optimal cut-point for identifying sickness behavior in this exploratory analysis; the modest classification accuracy indicates the need for further research before firm conclusions can be drawn as to how the SBI-R should be used in identifying clinically meaningful sickness behavior. Also, the longitudinal analyses provide further evidence of consistent relationships between variables although the analyses are preliminary based on a convenience sample and subject to potential biases.
Perhaps most importantly, inflammatory depression and associated increases in sickness behavior may respond to differential depression treatments that address either the inflammatory component underlying the depressive symptoms or consequences of inflammation (Haroon et al., Reference Haroon, Fleischer and Felger2016; Felger, Reference Felger2017). For example, patients who receive exogenous pro-inflammatory cytokine therapy such as interferon or IL-2 tend to experience the vegetative symptoms of sickness behavior, which may be followed later by the psychological symptoms of depressed mood, irritability, rage, and anxiety (Capuron et al., Reference Capuron, Gumnick and Musselman2002). While standard SSRI antidepressants work to ameliorate the psychologically oriented depressive symptoms (e.g., guilt and sense of worthlessness) and can prevent vegetative symptoms (e.g., fatigue and appetite disturbance), other non-SSRI antidepressants may work better for treating inflammation-induced vegetative symptoms of depression (Capuron et al., Reference Capuron, Gumnick and Musselman2002). For example, inflammation associated depression may be more responsive to agents that upregulate dopamine such as bupropion, in addition to serotonin (Felger, Reference Felger2017), as inflammation depletes these key neurotransmitters (Muller and Schwarz, Reference Muller and Schwarz2007). In short, the SBI-R may be useful diagnostically to help determine clinical management strategies for depressive symptoms in the setting of medical illness.
The current study is exploratory and preliminary. As such, its results are limited by a relatively small sample size that precluded some analyses (e.g., item response theory) and the ability to apply outcomes to subgroups. Also, the sample was not ethnically or racially diverse and was therefore dichotomized to enable speculative analysis. While SBI-R was higher in non-white participants, these data are highly exploratory due to the small sample of 13 non-white patients. This difference was likely related to higher rates of inflammation, depression, and possibly stress. The results and conclusions were also limited by the use of self-report depression measures such as the PHQ-9 and the HADS-D instead of using the Structured Clinical Interview for Diagnostic and Statistical Manual-V Disorders (SCID), the gold standard for identifying cases of depression. These two self-report measures of depression were used for the sake of comparison against individual SBI-R questions since some of the SBI-R question domains overlap with the PHQ-9 (e.g., psychomotor retardation, appetite, fatigue, enjoyment of activities, concentration, and sleep disturbance). However, the SBI-R was significantly correlated with both measures to a similar extent. Inflammation was also limited to CRP values, whereas it would have been helpful to compare CRP to other pro-inflammatory cytokines such as IL-6. Future research evaluating the SBI-R should include multiple biomarkers to better elucidate its ability to measure underlying inflammation and perhaps identify differential symptom manifestations of inflammation. Finally, these data were also collected during ongoing anticancer treatments. Although analyses were adjusted for these treatments as a separate variable, it would be important to understand this relationship independent of receiving cancer treatments. For example, chemotherapy precipitates both inflammation and depression and may have exaggerated the relationship between depression and SBI-R. Therefore, the study could be replicated after completing cancer therapies in patients with localized cancers who are undergoing surveillance follow-up for the cancer management.
In summary, the SBI-R performed well as a measure of sickness behavior in patients with metastatic lung cancer. This represents a novel approach to succinctly describe sickness behavior and examine its relationship with both depressive symptoms and inflammation. The quantification of sickness behavior as a distinct entity holds clinical promise. It may provide a mechanism by which the concept of sickness behavior can evolve from a clinical description to a clinical state that can be quantified with useful thresholds that are validated based on depression scales and inflammatory markers.
Acknowledgments and Disclosures
We thank the Department of Psychiatry and Behavioral Sciences at Memorial Sloan Kettering Cancer Center for assistance with study analysis and manuscript preparation. Authors have reviewed and approved the manuscript as it is submitted and have no conflict of interest to declare. Each author had multiple roles in writing the manuscript including the conception, design, acquisition, analysis, and interpretation of the data. This work was not directly supported by external funding sources.
Funding
This work was supported by the NIH/NCI Cancer Center Support Grant (P30 CA008748) and the NIH Loan Repayment Program L30 CA220778.
Conflict of interests
The authors have no conflict of interest.
Appendix
See Figures A1 and A2.
Scatterplot of SBI-R and CRP log-transformed.

Scatterplot of SBI-R and depression (PHQ-9).