Implications
Suckler cows play an important role in the beef production industry across the world. There is increasing interest in developing mitigation strategies to reduce the environment footprint of beef production systems. Although the present study found no difference in methane emission or utilization of energy or nitrogen between Limousin×Holstein-Friesian and beef composite suckler cows, a range of models were developed for prediction of maintenance energy requirement and excretion of methane and manure nitrogen. The accurate quantification of feed intake and effects on environment footprint is essential for development of sustainable beef production systems.
Introduction
Herds of suckler beef cows constitute a very important sector in the grassland areas of Europe. A total of over 12 million suckler cows are found in all EU countries and the main suckler beef-producing countries are France, Spain, the UK and Ireland (Webster, Reference Webster2011). Suckler beef production is a sustainable system producing high quality meat with low inputs. However, this industry, like all other livestock production systems, currently is under increasing pressure to reduce manure nitrogen (N) and methane emissions from the meat production. Dry matter intake and N intake have been demonstrated to be the major driver for enteric methane emission (Yan et al., Reference Yan, Gordon, Ferris, Agnew, Porter and Patterson2000; Mills et al., Reference Mills, Crompton, Bannink, Tamminga, Moorby and Reynolds2009) and manure N excretion (Kebreab et al., Reference Kebreab, France, Agnew, Yan, Dhanoa, Dijkstra, Beever and Reynolds2001; Yan et al., Reference Yan, Frost, Agnew, Binnie and Mayne2007) from cattle, respectively. Currently, feed intake for beef cattle across the world is calculated from total energy requirements for maintenance, production and pregnancy using energy feeding systems adopted locally, for example, systems of Agriculture and Food Research Council (AFRC, 1993) in United Kingdom, National Institute for Agricultural Research (INRA, 1989) in France, and National Research Council (NRC, 1996) in United States). However, there is evidence that high yielding dairy cows have greater metabolic rates (Yan et al., Reference Yan, Gordon, Agnew, Porter and Patterson1997b) and require more energy for maintenance than their lower genetic merit predecessors (Yan et al., Reference Yan, Frost, Keady, Agnew and Mayne1997a; Bruinenberg et al., Reference Bruinenberg, Van Der Honing, Agnew, Yan, Van Vuuren and Valk2002; Kebreab et al., Reference Kebreab, France, Beever and Castillo2003). Modern suckler cows may also have a higher energy requirement than that recommended for earlier suckler cow genotypes, as assessed by current energy feeding systems (e.g. INRA, 1989; AFRC, 1993; NRC, 1996) which were developed using data obtained over three decades ago. At the moment, there is little quantitative information available on prediction of methane and manure N emissions and the maintenance energy requirement for modern suckler cows. As diets used for dry suckler cows are normally in a poor quality when compared to those fed to lactating dairy cows and growing beef cattle, the models developed for dairy cows and growing cattle may not be fully applicable to dry suckler cows. Against this background, the objectives of the current study were to evaluate effect of suckler cow genotypes on methane emissions and energy and N utilization efficiencies and use these data to develop models to predict methane emissions, energy requirements and N outputs to address the knowledge gaps that currently exist.
Material and methods
All animal procedures used in this study were conducted with the approval of the AFBI Hillsborough Ethical Review Committee and in accordance with the UK Animal Scientific Procedures Act (1986).
Animals, experimental design and diets
Seventeen dairy-bred suckler cows (LF; Limousin×Holstein-Friesian) and 17 beef composite suckler cows (ST; Stabiliser) were selected from the AFBI suckler herd. The ST breed is a composite breed of cattle developed in America by Lee Leachman of Colorado (www.leachman.com). The aim of the breed was to harness the hybrid vigour of a number of different breeds to produce a beef animal that calves easily, matures early, with good fertility, good and consistent conformation and lower feed costs. The breeds used to make up the ST are a mix of traditional British breeds and maternal Continental breeds.
All cows in the study were used during their respective dry (non-lactating) periods. The experiment was conducted over two periods: November 2010 to January 2011 (6 LF, 6 ST) and January 2012 to March 2012 (11 LF, 11 ST). All the suckler cows were pregnant during the calorimetric measurements and digestibility balance and mean stage of pregnancy was 196 days (SD, 48.0). Before commencement of the study, animals were paired according to age, BW and body condition score (BCS) within each breed. In each period, cows were housed in cubicle accommodation for 17 days, and then transferred to individual tie-stalls for a 8-day digestibility balance including a 2-day adaption. After the balance, animals were transferred to indirect, open-circuit, respiration calorimeters for 3 days with gas exchanges recorded for the last 2 days.
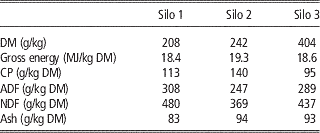
The animals were fed grass silages ad libitum from the same silo (three silo silages used) once daily, at 0900 h, throughout the entire experimental period. The amount of feed offered was adjusted based on the intake of the previous day, so as to try to ensure a refusal equal to ~10% of the previous day’s intake. The chemical compositions of the three silo grass silages offered are presented in Table 1.
Chemical composition of the experimental grass silage

Measurements
The BW and BCS of the cattle were recorded on the first day of the study and then immediately before entry to the digestibility balance and then, again, after exiting the respiration chamber. The BCS of each animal was assessed before entry to the study on a scale from 1 (very thin) to 5 (very fat), according to Mulvany (Reference Mulvany1977).
The quantities of feed (silage) offered and feed refused were recorded daily for each animal during digestibility balance and chamber measurement periods. The silage offered to cattle was sampled daily for the determination of gross energy (GE), N content, pH, volatile fatty acids (VFA), alcohol (ethanol and propanol) and ammonia-N (NH3-N) (all on a fresh weight basis). The DM contents of the silage and all silage refusals were determined after oven drying at 85°C for 24 h. The 6 days silage samples during the balance period were then bulked together and a representation sample was taken for analysis of ash, ADF, NDF concentrations. Silage DM concentrations used in the present study were calculated from oven DM concentrations corrected for the loss of VFAs, lactic acid, alcohol and ammonia (Porter and Murray, Reference Porter and Murray2001).
Faeces and urine outputs were recorded on each day of the balance and representative sub-samples (~10% of total weight and volume respectively) taken for proximate chemical analysis. Sulfuric acid (35% aqueous vol/vol) was added to urine collection bins to reduce the pH of the collected urine to<pH 3 and prevent loss of N as ammonia. The pH values of urine were checked on the first and last day of balance collection. Faeces or urine samples taken during the 6-day digestibility balance were pooled for each animal and thoroughly mixed before a representative sub-sample was taken and frozen for subsequent analysis. The urine samples were analysed for GE and N contents. After defrosting, faeces samples were divided into two portions. One portion (200 g) was used for determination of N content (fresh weight basis) and the other portion was dried at 85°C for 72 h for calculation of DM content before milling to pass an 0.8 mm screen prior to storage for analysis of ash, GE, ADF and NDF concentrations.
Gross energy concentrations were determined using an isoperibol bomb calorimeter (Parr Instruments Co., Moline, IL, USA) according to Porter (Reference Porter1992). NH3-N concentrations of silages were determined as described by Steen (Reference Steen1989). Total N concentrations in silage, faeces and urine samples were analysed on a fresh weight basis using a Tecator Kjeldahl Auto 1030 Analyzer (Foss Tecaor AB, Höganäs, Sweden). Concentrations of VFA in silage were determined as described by Porter and Murray (Reference Porter and Murray2001). Silage pH was determined on aqueous extracts using a Metrohm 670 Titroprocessor (Metrohm Ltd., Herisau, Switzerland) fitted with an Orion Ross combination electrode (Metrohm Ltd., Herisau, Switzerland). The concentrations of NDF, ADF and ash in silage were determined using methods described by Cushnahan and Gordon (Reference Cushnahan and Gordon1995).
Calorimeters
The two calorimeters used in the current study were indirect, open-circuit, respiration chambers. Animals were placed in one of the two calorimeters for 3 days upon completion of their respective digestibility balance. The respiration chambers incorporate airlocks to provide staff access for feeding and sampling. The total chamber volume of 22 m3 was ventilated by suction pumps set at a rate of 75 m3/h. Temperature and humidity control was achieved with air conditioning units set at 12±1°C and 60±10% relative humidity, respectively. The chambers were operated under negative pressure (−5 Pa) with exhaust air removed at three positions for volume measurement and gas analysis. The chambers were calibrated at the beginning, middle and end of each of the two periods (i.e. November 2010 to January 2011 and January 2012 to March 2012), by releasing known quantities of standard CO2, CH4 and N2 (used to reduce O2 concentration) into the chambers. All equipment, procedures, analytical methods, and calculations used in the calorimetric study were as reported by Gordon et al. (Reference Gordon, Porter, Mayne, Unsworth and Kilpatrick1995).
Statistical analysis
Digestible energy (DE) was calculated as the difference between GE intake and faecal energy output. Metabolizable energy (ME) was derived as the difference between GE intake and the sum of faeces energy, urine energy and methane energy (CH4-E). Energy retention (ER) was calculated as the difference between GE intake and the sum of faeces energy, urine energy, CH4-E and heat production (HP). Heat production was determined from measurements of oxygen consumption, CO2 and CH4 production, and urine N output using the equation of Brouwer (Reference Brouwer1965).
The effect of suckler cow genotype on animal performance, enteric methane emissions and energy and N utilization were analysed by the restrict maximum likelihood variance components analysis and linear mixed models with removal of period and silage silo factors, using the Wald test with the model’s adequacy assessed by means of residual plots and a pseudo R 2 value. The statistical program used in the present study was Genstat 14.2 (14th edition; Lawes Agricultural Trust, Rothamsted, UK). Effects of the factors were declared significant at P<0.05 unless otherwise noted and trends were discussed at P<0.10.
Results
Effects of genotype on energy and nitrogen metabolism and methane emissions
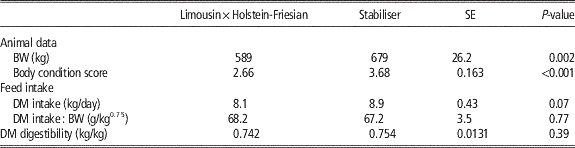
Data for BW, BCS, grass silage intakes and DM digestibility are presented in Table 2. The ST cows had greater BW (P=0.002) and BCS (P<0.001) than LF cows but there were no significant differences between LF and ST for DMI expressed either as kg/d or as g/kg0.75. There was also no significant difference in the digestibility of DM between the LF and ST breeds.
Effects of suckler cow genotypes on BW, feed intake and digestibility

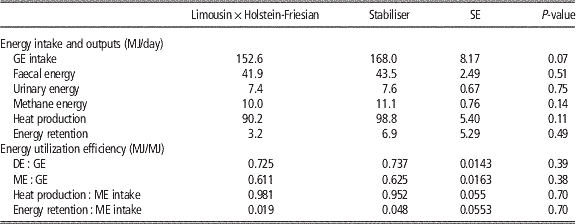
Data for energy intake, energy output and efficiency of energy utilization are presented in Table 3. Although ST cows had numerically higher GE intake and EB than LF cows, none of the differences were significant. There were no significant differences in energy outputs (faecal energy, urinary energy, CH4-E, or HP), or the efficiency of energy use (DE : GE, ME :GE, HP : ME intake or EB : ME intake) between LF and ST.
Effects of suckler cow genotypes on energy intake, excretion and energetic efficiency

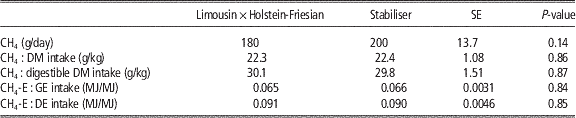
Data for enteric methane emission are presented in Table 4. There was no significant difference between LF and ST in respect of methane emissions expressed as g/day, per kg DM intake or per kg digestible DM intake. There was no significant difference either, between LF and ST cows, for losses of CH4-E expressed as a percentage of GE intake or DE intake.
Effects of suckler cow genotypes on enteric methane emissionsFootnote 1

1 CH4-E–methane energy.
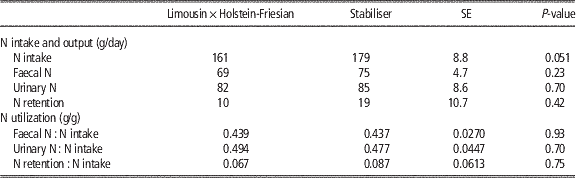
Data for N balance and N utilization are presented in Table 5. There were no significant differences between ST and LF in N intake, faecal N output, urinary N output, N retention or N utilization measures (faecal N : N intake, urinary N : N intake or N retention : N intake) between ST and LF.
Effects of suckler cow genotypes on nitrogen (N) intake, output and utilization efficiency

Regression analysis for maintenance energy requirement and methane and nitrogen excretion
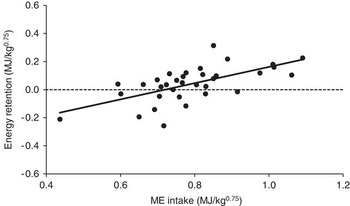
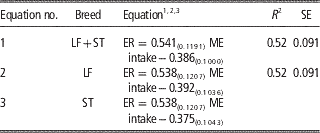
Because suckler cow genotypes (LF v. ST) had no significant effects on energy metabolism, methane emission rates or N utilization, the data from the two breeds were pooled to develop a range of relationships between inputs and outputs. The relationships between energy intake and retention are presented in Table 6 and Figure 1. All relationships between ME intake (MJ/kg0.75) and EB (MJ/kg0.75) were significant (P<0.001; r 2=0.52; SE=0.091). The equation (1), using data from both breeds, produced a net energy requirement for maintenance (NEm) of 0.386 (MJ/kg0.75) which was taken as the intercept. Because genotype had no significant effect on energetic efficiency, a common slope was used to produce equations (2) and (3) for LF and ST, respectively. The NEm values derived from equations (2) and (3) were 0.392 and 0.375 (MJ/kg0.75) for ST and LF cows, respectively, but the difference was not significant.
The relationship between EM intake and energy retention using data of both Stabiliser and Limousin×Holstein-Friesian.

The relationship between ME intake and energy retention using data of Stabiliser (ST) and Limousin×Holstein-Friesian (LF)

1 Unit–MJ/kg0.75 for ER (energy retention) and ME intake.
2 Data in brackets are SE values.
3 Equations (2) and (3) were developed for LF and ST, respectively, using a common slope, as genotype had no significant effect on energetic efficiency.
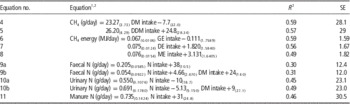
The relationships developed for prediction of methane and manure N are presented in Table 7. There was a positive linear relationship between methane emission with DM intake (equation (4): r 2=0.59, SE=28.1) and the r 2 value was slightly decreased and SE value increased when relating methane emission to digestible DMI (equation (5): r 2=0.57, SE=29.0). These relationships produced a methane emission rate of 22.3 or 30.0 g associated with 1 kg intake of DM or digestible DM when the constant was omitted from the relationship. Similar relationships were also obtained when CH4-E was related to GE intake, DE intake, and ME intake (equations (6), (7), (8), respectively). The CH4-E was respectively 0.066, 0.091 and 0.107 of GE intake, DE intake, and ME intake, respectively, when the constants were omitted from the above equations.
Prediction equations for methane emission and nitrogen output of suckler cows using data of both Stabiliser and Limousin×Holstein-Friesian

1 Unit–kg/day for DM intake and DDM (digestible DM) intake; MJ/day for GE intake, DE intake and ME intake; g/day for N intake.
2 Data in brackets are SE values.
There was a positive linear relationship between N intake and N outputs from faeces (equation (9a): r 2=0.30, SE=12.4), urine (equation (10a): r 2=0.45, SE=23.1) and manure (equation (11): r 2=0.46, SE=30.5). These relationships show that N output from faeces, urine and manure were 0.438, 0.486 and 0.923 g for each 1 g of N intake when the constant was omitted from the relationship. Adding DM intake as a supporting predictor to equation (9a) and equation (10a) marginally increased r 2 values from 0.30 to 0.31 (equation (9a) v. (9b)) and 0.45 to 0.49 (equation (10a) v. (10b)), while reduced SE values from 12.4 to 12.0 (equation (9a) v. (9b)) and from 23.1 to 23.0 (equation (10a) v. (10b)).
Discussion
Energy requirement
As there is little comparable information for the energy requirement of suckler cow breeds used in the present study (i.e. ST), we have compared our results to beef cattle or dairy cows of similar BW. In the current study, the estimated NEm values varied from 0.375 to 0.392 (mean 0.386 MJ/kg0.75). When assuming a live weight of 600 kg for a suckler cow, the calculated NEm using AFRC (1993) is 0.337 MJ/kg0.75 which is 87% of that obtained in the present study. There are several possible explanations for the greater NEm value obtained in the current study with dry suckler cows. The use of grass silage as sole diet in the current work may have been an important factor. Yan et al. (Reference Yan, Frost, Keady, Agnew and Mayne1997a) collated a calorimeter data set (n=221) of lactating cows offered diets contained grass silage from 0.18 to 1.00 of total diet (mean 0.58; SD 0.217) and found that when the overall data set was divided into three sub-sets, according to silage-GE : total-GE ratio, the derived NEm values were significantly greater as the proportion of silage in the total diet increased. Forage-based diets are associated with a larger gastro-intestinal tract mass (Reynolds et al., Reference Reynolds, Tyrell and Reynolds1991), resulting in greater oxygen consumption by the animal. The lower NEm of AFRC (1993) may also be because the model used by AFRC (1993) was developed using fasting data of cattle after a prolonged period of restricted feeding (usually at the maintenance level). However, in the current study, cows were fed ad libitum and had normal metabolic activity. Fasting after a lengthy period of restricted nutrition can result in deamination of amino acids released from tissue proteins, to provide a supply of glucose for metabolism (Chowdhury and Ørskov, Reference Chowdhury and Ørskov1994). Deamination can induce some metabolic disorders in animals (e.g. hypoglycaemia, hyperlipidaemia, hyperketonaemia and hypoinsulinaemia; Chowdhury and Orskov, Reference Chowdhury and Ørskov1994) and such effects can affect the FHP of cattle (Agnew and Yan, Reference Agnew and Yan2000) resulting in a lower metabolic rate. These disorders may not occur in cattle fed at maintenance levels for a certain period, although a long term of maintenance feeding may force cattle to adjust their body metabolism with a lower basal metabolic rate (Agnew and Yan, Reference Agnew and Yan2000).
The findings from the present study suggest that the use of AFRC (1993) to estimate the maintenance energy requirement for sucklers cow could underestimate their energy requirement. However, further information is required to validate the present results for these suckler breeds managed under a wide range of feeding regimes.
Methane emissions
Meta-analysis of methane emission data found that the CH4-E : GE intake ratio ranged from 0.016 to 0.099 in 404 experimental trials with Holstein cows in the United States (Moe and Tyrrell, Reference Moe and Tyrrell1979) and from 0.037 to 0.101 in 247 Holstein-Friesian cows in the United Kingdom (Yan et al., Reference Yan, Gordon, Ferris, Agnew, Porter and Patterson2000). The CH4-E : GE intake ratio values obtained in the present study (0.066 to 0.067) fall within the mid-range of each of the two previously quoted studies while the mean value from the current study (0.066) is greater than that of 0.056 (0.038 to 0.074) reported by Kebreab et al. (Reference Kebreab, Johnson, Archibeque, Pape and Wirth2008) for dairy cows but similar to that of 0.065±0.01 reported by the Intergovernmental Panel on Climate Change (IPCC, 2006) for use in cattle. The mean methane emission per kilogram DM intake in the present study was 22.3 g/kg, which is similar to those (20.4–22.9 g/kg) calculated from the average data of methane emission and feed intake reported for lactating dairy cows (Moe and Tyrrell, Reference Moe and Tyrrell1979; Mills et al., Reference Mills, Kebreab, Yates, Crompton, Cammell, Dhanoa, Agnew and France2003; Ellis et al., Reference Ellis, Kebreab, Odongo, McBride, Okine and France2007).
A number of previous studies have demonstrated that methane emissions (g/day) from enteric fermentation are highly correlated with feed intake and a range of prediction equations for methane emissions or CH4-E emission from lactating dairy and beef cattle, using DM intake (kg/day) and ME or GE intake (MJ/day) values as the primary predictor, have been published (Yan et al., Reference Yan, Gordon, Ferris, Agnew, Porter and Patterson2000; Mills et al, Reference Mills, Kebreab, Yates, Crompton, Cammell, Dhanoa, Agnew and France2003; Ellis et al., Reference Ellis, Kebreab, Odongo, McBride, Okine and France2007). Ellis et al. (Reference Ellis, Kebreab, Odongo, McBride, Okine and France2007) developed a range of prediction equations from a combined database in beef and dairy cattle using DM intake or ME intake as primary predictors for methane emission and found that the r 2 values for DM intake were greater than for ME intake (0.68 v. 0.60). The results obtained in the present study agree with several previous publications which have shown DM intake (kg/day) and GE intake (MJ/day) are better predictors for enteric methane emissions than ME intake (r 2=0.59 and 0.59 v. 0.49, respectively; SE=1.59 v. 1.82 for prediction using GE intake v. ME intake).
There is little information in the literature on methane emissions for non-lactating suckler cows, and less still for the two genotypes (LF and ST) used in the current study. The results from the present study provide an approach for estimating methane emissions on the basis of DM intake, GE intake, DE intake and ME intake. However, more information is still required to cover the effects of different feeding regimes and management systems.
Nitrogen output
Preventing pollution of groundwater and surface water by nitrates from agricultural sources is an increasingly important issue for livestock producers and, inevitably, interest in growing in developing approaches to estimate N outputs from livestock. Yan et al. (Reference Yan, Frost, Agnew, Binnie and Mayne2007) reported that N intake is an accurate predictor of N excretion in growing beef cattle. The current data confirmed previous reports of a linear relationship between N intake and N excretion, for example by Kebreab et al. (Reference Kebreab, France, Agnew, Yan, Dhanoa, Dijkstra, Beever and Reynolds2001) and Yan et al. (Reference Yan, Agnew, Gordon and Porter2006 and 2007) who reported positive linear relationships between N intake and manure N output. One of the objectives of the current study was to develop similarly equations for prediction of N outputs from modern suckler cows. Nitrogen outputs were not different between the LF and ST suckler cows in the current study. However, the study established that positive linear relationships existed between N intake and N output and suggested that prediction equations developed in the present study could be used to monitor N outputs for suckler cow feeding systems. However, further information is required to validate these relationships for suckler cows managed under a wide range of production sustems.
Conclusions
This study generated a range of calorimetry data for non-lactating suckler cows offered only grass silage diets. There was no significant effect of suckler cow genotype (LF v. ST) on the efficiency of energy use, enteric methane emissions or N outputs. The relationship between EB and ME intake indicated that the NEm for a non-lactating suckler cow is 0.386 MJ/kg0.75. Linear regression analysis on pooled data found that CH4-E was 0.066 of GE intake. There were positive linear relationships between N intake and N outputs in manure, and manure N accounted for approximately 0.923 of the N intake. The present results provide information to predict maintenance energy requirement, methane emission and manure N output for suckler cows, however, further studies are required to evaluate these results for application to a wide range of suckler cow feeding regimes.
Acknowledgements
The authors wish to thank the staff of the Beef and Energy Metabolism Units for collection of data and care of animals. This work was funded by the DARD Evidence and Innovation project No 110106 and AgriSearch.