INTRODUCTION
Pigmentation patterns in marine mammals may be very different, even at single species level, and in some cases they are driven to change the formal recognition of presupposed forms into new subspecies (Perrin et al., Reference Perrin, Akin and Kashiwada1991; Heyning & Perrin, Reference Heyning and Perrin1994; Perrin, Reference Perrin1997). Often, in cetacean species, individuals belonging to different populations may also show variation in external morphology or colour patterns (Evans et al., Reference Evans, Yablokov and Bowles1982; Jefferson, Reference Jefferson1988; Perrin et al., Reference Perrin, Akin and Kashiwada1991; Amano & Miyazaki, Reference Amano and Miyazaki1996; Houck & Jefferson, Reference Houck, Jefferson, Ridgway and Harrison1999) and such differences might be an index of gene flow between populations (Herman et al., Reference Herman, Baker, Forestell and Antinoja1980; Braham & Rice, Reference Braham and Rice1984; Schaeff et al., Reference Schaeff, Kraus, Brown, Gaskin, Perkins, Payne, Boag, White and Hoelzel1991; Schaeff & Hamilton, Reference Schaeff and Hamilton1999). Variability in pigmentation pattern can also be observed among animals belonging to the same population. In fact, specimens may have distinctive natural variations which may reflect their individual genetic identity, allowing identification of single individuals through field photo-identification (Katona & Whitehead, Reference Katona and Whitehead1981; Dorsey, Reference Dorsey1983; Agler et al., Reference Agler, Beard, Bowman, Corbett, Frohock, Hawvermale, Katona, Sadove and Seipt1990; Hammond et al., Reference Hammond, Mizroch and Donovan1990; Sears et al., Reference Sears, Williamson, Wenzel, Bérubé, Gendron and Jones1990; Blackmer et al., Reference Blackmer, Anderson and Weinrich2000).
Variations in colour patterns can be observed in most cetacean families, and significant dissimilarities among individuals are present in the Delphinidae family, especially in the Stenella, Delphinus and Orcinus genera (Evans et al., Reference Evans, Yablokov and Bowles1982; Heyning & Perrin, Reference Heyning and Perrin1994; Perrin, Reference Perrin1997).
The striped dolphin Stenella coeruleoalba (Meyen, 1833) is the only species belonging to the Stenella genus in the Mediterranean Sea. This species is a small cosmopolitan cetacean inhabiting pelagic tropical and warm-temperature waters where it is relatively abundant (Perrin, Reference Perrin, Wilson, Archer, Ridgway and Harrison1994). The striped dolphin is the most abundant cetacean species in the western Mediterranean, with an estimated population of 118,000 individuals (Forcada et al., Reference Forcada, Aguilar, Hammond, Pastor and Aguilar1994). There is little information about striped dolphin feeding strategies, but its prey has been identified from stomach contents. The diet is mainly composed of mesopelagic fish and cephalopods but also planktonic crustaceans can be found (Würtz & Marrale, Reference Würtz and Marrale1993; Ringelstein et al., Reference Ringelstein, Pusineri, Hassani, Meynier, Nicolas and Ridoux2006).
Gaspari et al. (Reference Gaspari, Azzellino, Airoldi and Hoelzel2007) found that all the Mediterranean striped dolphin populations considered in their study showed a high level of genetic variation. Microsatellite DNA analysis found genetic differences between Pacific, North Atlantic and Mediterranean populations (Archer, Reference Archer1996); small genetic differences were also found among individuals in both eastern and western parts of the Mediterranean Sea, indicating a limited dispersal range between the two areas (Valsecchi et al., Reference Valsecchi, Amos, Raga, Podestà and Sherwin2006; Bourret et al., Reference Bourret, Macé and Crouau-Roy2007; Gaspari et al., Reference Gaspari, Azzellino, Airoldi and Hoelzel2007). A large degree of variation in external size between Mediterranean and Atlantic populations was also detected (Archer, Reference Archer1996). In addition, morphological studies based on stranding data pointed out that individuals inhabiting the southern area of the Mediterranean basin might be larger than those present in the northern area (Calzada & Aguilar, Reference Calzada and Aguilar1995).
Stenella coeruleoalba is boldly patterned in bluish grey and white with distinct diagnostic lateral stripes and spinal blaze that may vary between individuals, and possibly geographically (Perrin, Reference Perrin, Wilson, Archer, Ridgway and Harrison1994). Preliminary works, carried out in the western Mediterranean Sea, indicate that individuals seem to differ slightly in pigmentation at both the individual and group level (Acquarone & Notarbartolo di Sciara, Reference Acquarone, Notarbartolo di Sciara and Evans1992; Rosso et al., Reference Rosso, Siliceo Aznar, Corsi and Würtz2006).
Although the striped dolphin is the most common cetacean species inhabiting the Mediterranean basin (Forcada et al., Reference Forcada, Aguilar, Hammond, Pastor and Aguilar1994), there has been little information available on the variability of striped dolphin pigmentation patterns until now.
This work analysed systematic photographic data taken on free-ranging individuals in the Ligurian Sea. The aim of this research was to investigate and to describe the main pigmentation characteristics and their relative variability within the population (or populations) in the Ligurian Sea, outlining ‘typical’ regional pigmentations. Difference in colour patterns were investigated and used as an index of the phenotypic distance among animals within and between groups.
MATERIALS AND METHODS
Sampling
The study zone is located in the northern part of the Pelagos Sanctuary—Ligurian Sea—and it extends from the coast to the 43°10′ latitude N and between the 008°00′ and 009°52′ longitude E. This zone comprises both coastal and offshore waters including the Genoa Canyon and the Liguro–Provençal current.
Photographs have been collected during one-day scientific surveys, carried out all year round from May 2004 to December 2006, on board an 11 m semi-rigid inflatable vessel. Having recorded the positions, each sighted group was described in situ on the basis of the minimum, the maximum and the best estimation of the number of individuals. Also, group sizes were subdivided into three classes: 1, ≤20 individuals; 2, >20 and ≤40 individuals; 3, >40 individuals. The focal group was defined according to Shane (Reference Shane, Leatherwood and Reeves1990) as ‘any group of dolphins observed in apparent association, moving in the same direction and often, but not always, engaged in the same activity’. Members of the focal group usually remained within approximately 100 m of each other.
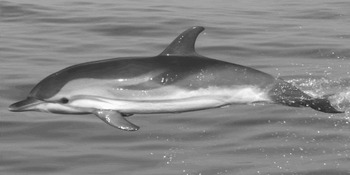
Auto focus digital cameras equipped with 80–400 mm stabilized zoom lenses were used throughout the study. Photographs were shot randomly when porpoising behaviour was observed and were taken perpendicularly showing the exposed flank. The photographer was positioned just above sea level in order to increase the probability of taking images in the perfect profile. Photographs were taken throughout the encounter regardless of whether they had already been taken of a particular individual. Pictures collected during surveys ranged from 6 to 10 megapixel in size, and were converted into black and white. A quality index (Q) rating from 1 to 4 was assigned to all the photographs, based on focus, exposure, proportion of the frame filled by the body of the individual photographed and the degree of rotation on the three planes. Only quality 4 pictures inserted into the database were analysed for this study (Figure 1). The likelihood of all pigmentation patterns from one individual matching another individual is rare, and each individual was identified based on its pigmentation patterns and the presence/absence of notches, lesions or deformities.
Typical Q = 4 picture: the animal is perfectly straight, perpendicular at the photographic axes, without pitching and rolling.

Sample analysis
Photographs were analysed according to the animal side, left or right, but individual identification from different sides cannot be linked. To prevent pseudo-replication only photographs showing the most photographed side per group were selected, i.e. if, during a sighting, five photographs were taken of left sides and eight of right sides only the right side photographs were analysed.
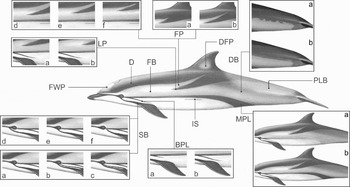
The best picture of each individual was then used for the pigmentation pattern analysis. For the specimens description Fraser's pigmentation variables were used where possible (Fraser & Noble, Reference Fraser and Noble1970) with new ones indicated in Figure 2.
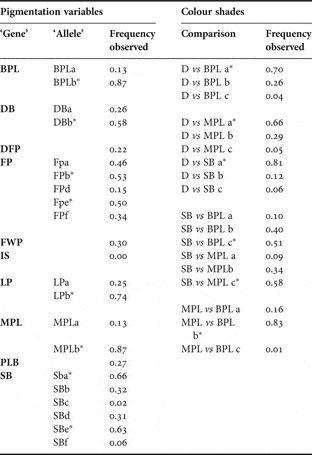
Pigmentation variables used to characterize individuals. The presence/absence of each 10 ‘gene’ variables (upper cases) and 19 ‘allele’ variables (lower cases) was investigated: BPL, branch Plimsoll line, a, it stops before the flipper armpit, b, it stops after the flipper armpit; D, dorsum (it was not considered in the pigmentation variable group); DB, dorsum border, a, marked, b, unmarked; DFP, dorsal fin white patch; FB, flank belly (it was not considered in the pigmentation variable group); FP, flank pigmentation, a, it ends before the origin of the dorsal fin, b, it ends after the origin of the dorsal fin, d, the thickness ratio FB/FP ≤2, e, <2 FB/FP ≤3, f, FB/FP >3; FWP, forehead white patch; IS, intermediate streak; LP, lateral promontory, a, it ends before the flipper armpit, b, it ends after the flipper armpit; MPL, main Plimsoll line, a, it ends before the origin of the dorsal fin, b, after the origin of the dorsal fin; PLB, peduncle light blaze; SB, shoulder band, a, single, b, double, c, multiple, d, it starts before the eye, e, it starts on eye, f, it starts after eye.

All individuals were described by the presence/absence of each pigmentation variable (10 ‘gene’ variables) and by the presence/absence of pigmentation variables expressions (19 ‘allele’ forms) represented in Figure 2. Specimens were also described by differences in colour shade among four pigmentation variables: dorsum, main Plimsoll line, branch Plimsoll line and shoulder band (a, darker; b, similar; c, lighter; see Table 1). Shade differences were measured by detecting grey degrees (GD) in the area from the eye to the origin of the flipper. Grey degrees of ten pixels per pigmentation variable i were measured and their mean value was the GDi. For this analysis we have used the software Corel Photo-Paint 12 to avoid systematic errors due to subjective valuations.
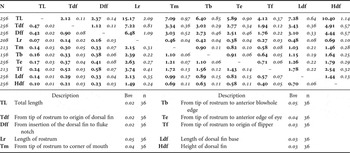
Morphometric matrix representing the relative proportion among different biometric data. For each pair mean value, in bold, and standard deviation were indicated. N, number of individuals for which the data were measured; Bm, bias due to the experimental method used; n, number of individuals used to calculate the bias (sample size).

Photographs of individuals present in ≥4 photographs were utilized to determine the sensitivity of the method, applied to describe specimens. The bias was calculated by comparing results obtained from different pictures of the same specimens, Bp (see later Bray–Curtis index).
At the same time morphometric data were collected although it was not possible to obtain any information on the total length of the specimens photographed. This study describes only relative proportion among biometric parameters (RPB), following Cagnolaro and colleagues' (1986) descriptions. These parameters were measured using a tool of MapInfo Professional 7.8. Photographs of each individual present in ≥4 photographs were also compared to determine the bias in the method applied for measuring morphometric data, Bm.
Pigmentation pattern
To define patterns in pigmentation minimizing bias, a cluster analysis using the half-weight index (HWI) was applied to quantify the frequency of association among pigmentation variables (Cairns & Schwager, Reference Cairns and Schwager1987). The HWI was useful to measure the strength of each dyad of pigmentation variables:

where: X is the number of individuals where variable A and variable B were seen together, A is the number of individuals where variable A was sighted and B is the number of individuals where variable B was sighted. Pigmentation patterns, i.e. associations between pigmentation variables occurring more often than expected by chance, were defined when HWI was greater than HWInull (association index obtained if a variable associates randomly)

nassociate is the mean number of pigmentation variables shown by individuals and N the total number of individuals used for the analysis.
All associations which have a HWI value greater then HWInull form a pattern.
Pigmentation dissimilarity among individuals
Dissimilarity in pigmentation between individuals may be an index of a ‘phenotypic distance’. Any dolphin has a pigmentation defined by coordinates—presence/absence of each pigmentation variable—then it is possible to measure the distance (dissimilarity) among dolphins. For this analysis we used a normalization method of the Bray–Curtis index (Bray & Curtis, Reference Bray and Curtis1957) which helps to evaluate the amount of dissimilarity between the individual photographed:
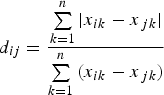
where d ij is the distance between individual i and individual j using as coordinates the n pigmentation variables (presence/absence of every pigmentation variable). d ij value ranges between 0 (individual i is equal at individual j) and 1.
The Bray–Curtis distance was measured to calculate the bias obtained in the specimen description analysis, Bp, i.e. the pigmentation distance between different photographs of the same individual; the bias was calculated comparing photographs of each individual photographed ≥4 times.
RESULTS
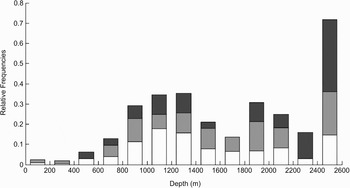
During this study, 305 sightings of the striped dolphin were collected (7834 Q ≥ 1 photographs). Class 1 represented the most common group size with a frequency f = 0.68 (204 groups) followed by Class 2, f = 0.23 (70 groups), and Class 3, f = 0.09 (31 groups). While Class 1 and Class 2 groups were sighted everywhere in the sampled area, Class 3 groups were not seen on the continental shelf (Figure 3).
Relative frequencies of the three group size-class, 1–20 individuals in white, 21–40 individuals in light grey and more than 40 individuals in dark grey. The histogram does not take into account the effort applied.

At least one Q = 4 photograph was taken during 86 encounters (mean = 12.54; SD = 8.21; range 1–26) for a total of 276 porpoising individuals identified (130 on right side, 146 on left side). A total of 884 Q = 4 photographs were analysed (476 left sides, 428 right sides). In 45 groups, 15% of total sightings, it was possible to collect photographs of more then three individuals in the same group (mean = 4.53; SD = 0.22; range 4–16). For 36 specimens more than three consecutive Q = 4 photographs were collected, during the same sighting (mean = 6.58; SD = 2.25; range 4–14).
Morphometric data
There is no important morphometric difference among the individuals (see Table 1). Biometric data are very similar to those measured by Cagnolaro and colleagues on a sample of ten stranded specimens (Cagnolaro et al., Reference Cagnolaro, Cozzi, Magnaghi, Podestà, Poggi and Tangerini1986).
Photographs of the 36 individuals were used to determine the sensitivity of the method applied for measuring morphometric data. The mean bias Bm was 0.03 (SD = 0.01; range 0.02–0.05).
Pigmentation pattern
Frequencies of each variable analysed are listed in Table 2. Frequency of all variables is very stable in the population, being similar between each different group of dolphins. The main Plimsoll line and branch Plimsoll line were the most common variables and the only ones consistently present on individuals of the population studied. The intermediate streak was not present in all of the individuals photographed.
Frequencies in the population of the different variables analysed (N = 276 individuals). Variables marked with a* were the most frequent and were grouped to form the ‘common’ pattern.

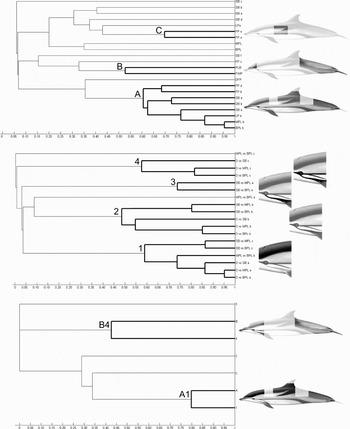
Initially cluster analyses were made separately (Figure 4) for the pigmentation variables group (N = 276 individuals) and the colour shades group (N = 198 individuals). Results showed that 12 pigmentation variables were associated more often than expected, grouping them in three patterns (called from 1 to 3; HWInull = 0.468). The difference in colour shades among the four features analysed form four different patterns (called from A to D; HWInull = 0.423). A third cluster analysis was made among the previous seven patterns (N = 198 individuals), and it showed preferred associations only between A-1 and B-4 patterns (HWInull = 0.387). The pattern A-1, called ‘mat’ pattern, and the pattern B-4, called ‘pale’ pattern, were composed of 14 and five different variables respectively. Frequencies in the population of the two main patterns and an arbitrary ‘common’ pattern (composed of the most frequent characteristics, 14; see Table 2) were investigated, and the results show that the ‘mat’ pattern is the most common (f = 0.04) followed by the ‘pale’ pattern (f = 0.01), while the ‘common’ pattern was not present.
Also frequencies of patterns derived from the two main patterns were studied. In particular we calculated the frequency of patterns made by 75% of variables present in each main pattern (‘mat family’ patterns and ‘pale family’ patterns). These frequencies were f = 0.68 and f = 0.12 for the ‘mat family’ and ‘pale family’ patterns respectively.
Pigmentation dissimilarity among individuals
The Bray–Curtis index, or pigmentation distance, gave a Bp = 0.009 (SD = 4.10−4; range 0–0,02; calculated among the 36 specimens photographed ≥4 times).
The medium pigmentation distance among the individuals in the ‘right side population’ (130 individuals, 8385 pairs) was D = 0.450 (SD = 0.011; range 0–0.976), and in the ‘left side population’ (146 individuals, 10585 pairs) it was D =0.454 (SD = 0.013; range 0–0.946) with a frequency of ‘twin’ f < 1.10−3 (3 pairs) for both populations.
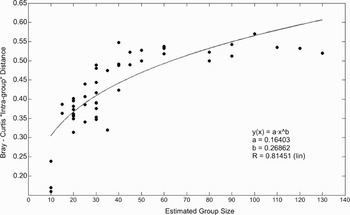
The medium pigmentation distance among individuals of the same group (45 groups, 204 individuals) was D =0.416 (SD = 0.088; range 0.161–0.571) showing a high variability of intra-group distance between groups. The t-test suggested that intra-group distances between the Class 1, 2 and 3 groups are statistically different (P < 0.01; Class 1 vs Class 2, t = 4.024, 33 df; Class 2 vs Class 3, t = 6.266, 34 df). If the pigmentation distance was a random variable in striped dolphins, for any dolphin group we consider the intra-group distance should not be statistically different (intra-group distance = pigmentation distance among dolphins of the same group) regardless of the number of dolphins forming the group. However, by looking at the real data collected, it is clear that dolphin herds formed by ≤20 individuals were characterized by a small inter-group distance. By investigating this issue a positive correlation between group size and pigmentation distance was found, i.e. the larger the group, the bigger the pigmentation distance within the group. The pigmentation distance increases quickly up to a group size value of ~40 individuals; within bigger group sizes the intra-group pigmentation distance remains stable (Figure 5). There is not a statistically supported difference in pigmentation between offshore versus inshore individuals (individuals sighted <500 m depth vs individuals sighted >2000 m depth), in fact this distance has a mean value D = 0.448 (SD = 0.0181; t = 1.0593, 12 df) which is very similar to the mean value observed among the individuals of the population.
Cluster analysis made to point out the presence of colour patterns. HWI is indicated on x axis while variables are indicated on the y axis. Patterns (bold lines) are represented and described by drawings on the right. The first drawing above shows cluster obtained from the pigmentation variables analysis: three patterns (A, B and C); the second drawing in the middle shows cluster obtained from the colour shade analysis: four patterns (1, 2, 3 and 4); the third drawing is the association result of the previous seven patterns. Two main patterns arise from the analysis, the ‘mat’ pattern (A1) and the ‘pale’ pattern (B4).

Plot ‘intra-group’ pigmentation distance versus estimated group size. The best fit is shown by the black curve.

DISCUSSION
Studies on the differences in external morphology and pigmentation patterns were historically carried out to assess variations within and between forms, subspecies and even among different species (Perrin et al., Reference Perrin, Akin and Kashiwada1991; Heyning & Perrin, Reference Heyning and Perrin1994; Amano & Miyazaki, Reference Amano and Miyazaki1996; Perrin, Reference Perrin1997). This type of study was typically based on stranded individuals where post-mortem darkening of the skin may obscure or distort the colour pattern of the dead cetacean, compromising a part of the sample. Only a few studies have attempted to systematically sample free-ranging individuals (Stockin & Visser, Reference Stockin and Visser2005) to avoid post-mortem darkening. This study would also be a tool to test the effectiveness of this last approach.
In this work the 11% of the estimated number of dolphins sighted was represented by Q = 4 photographs (range 2–85% per group). Striped dolphins typically approach close to the boat during bow-riding behaviour, in small groups formed by a couple of individuals. Before they reach the bow, they show porpoising behaviour and it is possible to collect photographs of whole individuals. The sampling of bow-riding individuals may lead to an under-representation of mature females, since mothers rarely show this behaviour when accompanied by a calf.
Morphometric data
Although only relative proportions were measured, the comparisons between different photographs of the same individuals suggest that this approach has reliable results, due to a small bias (Bm = 0.03). The larger the morphological variable measured, the smaller is the Bm (see Table 1).
The biometric results are very similar to the ones relative to specimens stranded along the Ligurian coast (before the morbillivirus epizootic of 1990–1992; Cagnolaro et al., Reference Cagnolaro, Cozzi, Magnaghi, Podestà, Poggi and Tangerini1986) which confirm that there is only a small variability among individuals and among different age-classes (excluding calves).
Pigmentation patterns
In this study of pigmentation patterns, the approach used gave reliable results and the bias observed was minimal (bias measured as Bray–Curtis distance, Bp = 0.009).
The frequency of all pigmentation variables is stable in the population and it remains similar among each different group of dolphins. The population presents widespread pigmentation variability among individuals: specimens usually differ in various pigmentation characteristics, and consequently this allows identification even at single individual level. The frequency of ‘twin’, i.e. the frequency of individuals that show the same pigmentation variables, is very rare within the sample studied (f <0.001).
In the north-western Mediterranean Sea, the striped dolphin pigmentation is characterized by a constant presence and a low variability of the main Plimsoll line and the branch Plimsoll line. According to Fraser (1970) the two Plimsoll lines should be considered the more trenchant characteristics of the striped dolphin pigmentation.
Although the intermediate streak has not been found on the specimens analysed, this variable was found on specimens from the western Mediterranean Sea in past studies (Fraser & Noble, Reference Fraser and Noble1970) therefore it may not be completely absent in the population.
The most variable pigmentations are the flank pigment and the shoulder band which are usually present, although they may not appear on some individuals. The flank pigment varies considerably, mainly in thickness and in length; the shoulder band presents a high variability especially in shade, thickness and conformation (being composed of one to four bands).
Despite the general variability in pigmentation, the majority of the pigmentations photographed seem to derive from two main colour patterns. The primary, ‘mat pattern’, is the most common and it is mainly characterized by: (a) light contrast among the two lines (MPL and BPL) and the flank belly; (b) lighter single shoulder band; and (c) the dorsum colour is darker then the lines. The second colour pattern, ‘pale pattern’, is characterized by: (a) the presence of a lighter forehead and the peduncle light blaze; and (b) a visible contrast between the flank belly and both shoulder bands and the two lines.
Distance in pigmentation among individuals
There are no statistical differences in pigmentation between offshore and inshore individuals, even though a small genetic difference was pointed out in previous works (Gaspari et al., Reference Gaspari, Azzellino, Airoldi and Hoelzel2007). By looking at the data collected, it is clear that small groups of dolphins (groups formed by ≤20 individuals) were characterized by a little difference in pigmentation among the individuals forming the heard (small ‘intra-group’ pigmentation distance). In these groups the pigmentation distance among individuals was always lower than the distance measured in larger groups, therefore the pigmentation distance was not random but it was biased by some factors. Although no genetic analysis was carried out during this work, we believe the pigmentation distance might be influenced by a higher kinship in the small groups. According to Gaspari et al. (Reference Gaspari, Azzellino, Airoldi and Hoelzel2007), striped dolphins seem to be grouped in small kin groups that could be associated among them to form temporary larger groups. The similarity in pigmentation, among individuals forming the same group, decreased in group sizes of up to approximately 40 specimens. Above 40 it remained quite constant; therefore the enhancement of the ‘intra-group’ pigmentation distance may be caused by the overlapping of several small kin groups. The large phenotypic similarity in small groups could not be a sampling bias caused by mothers and their calves, because calves were not sampled.
In this study, large aggregations of dolphins were observed only in pelagic waters while smaller groups could be found in both pelagic and neritic waters. A preliminary work carried out by Gannier & David (Reference Gannier and David1997) identified the presence of a daily migration cycle in which striped dolphins seemed to move offshore during the morning, before returning to the continental shelf during late afternoon. Dolphins might be dispersed on the continental shelf, in groups composed of some supposed kin units. In offshore waters they may form larger groups for various reasons including the need to defend themselves against possible predators which may be more common in pelagic waters.
ACKNOWLEDGEMENTS
We are very grateful to Ignacio Siliceo Aznar and Enrico Cantamessa who contributed to data elaboration, as well as Agostino Corsi and all the other students who collected the data. Special thanks also go to Elisa Casella and Sabino Metta for providing guidance on MATLAB elaborations. We also want to thank the anonymous referees who helped improve this paper. This work was partially funded by the Italian ‘Ministero dell' Ambiente e della Tutela del Territorio e del Mare’ and ACCOBAMS. Surveys conducted by the Biology Department of the University of Genoa were sponsored by soc. Cartello-YANMAR and SACS boatyard.