1. Introduction
The decay of homogeneous, isotropic fluid turbulence is a problem of fundamental significance in fluid dynamics. Not surprisingly, studies of this problem have a long history, which we outline below.
The large-scale dynamics of three-dimensional (3-D) fluid turbulence has been investigated since Leonardo da Vinci (1505), who wondered why vortices (which he called turbulences), generated at the pillars of a bridge in the Arno river in Florence, tended to endure for a long time. The exact text of Leonardo’s three lines on hydrodynamics, in his Codex Atlanticus, can be found in Frisch (Reference Frisch1995, p. 112). The date of publication, within the more than one thousand pages of Codex Atlanticus, was at first set in the late 16th century by Pompeo Leoni. He was no specialist of the evolution of Leonardo’s handwriting and thus wrongly positioned Leonardo’s text on ‘turbulences’ to around 1470s, during Leonardo’s roughly 30-year initial stay in Florence. But Leonardo was not really interested in hydrodynamics at that time. During his second stay, in the early 1500s, Leonardo had become strongly interested in hydrodynamics and seriously considered advanced fluvial engineering, to divert the Arno’s path. The (probably correct) dating, 1505, was made recently by Augusto Marinoni and may be found in the book by Marinoni & Marani (Reference Marinoni and Marani2004).
More than four centuries later, von Kármán & Howarth (Reference von Kármán and Howarth1938) (‘de Kármán’ in the original publication) and Kolmogorov (Reference Kolmogorov1941) speculated that, in the limit of vanishing viscosity and in the absence of forces, the energy
 $E(t)$
of 3-D incompressible turbulence would decline, at long time
 $t$
, as the power-law
 $E(t) \propto t^{-n}$
. Following the work of von Kármán & Howarth (Reference von Kármán and Howarth1938) on velocity correlations, Kolmogorov (Reference Kolmogorov1941) (for an English translation see Sinai Reference Sinai2003, pp. 332–336) arrived at a decay law
 $E(t) \propto t^{-10/7}$
using the Loitsiansky invariant (see Loitsiansky Reference Loitsiansky1939). However, Proudman & Reid (Reference Proudman and Reid1954) discovered that the Loitsiansky invariant is typically infinite, thereby bringing Kolmogorov’s result into question. A subsequent direct numerical simulation (DNS) by Ishida, Davidson & Kaneda (Reference Ishida, Davidson and Kaneda2006) was designed to investigate freely decaying fluid turbulence with an initial energy spectrum
 $\sim k^4$
, where
 $k$
is the wavenumber. Over the duration of their DNS, Ishida et al. (Reference Ishida, Davidson and Kaneda2006) found that the Loitsiansky invariant remained approximately constant and the decay of the energy could possibly be consistent with the Kolmogorov result
 $E(t) \sim t^{-10/7}$
. A subsequent DNS by Davidson, Okamoto & Kaneda (Reference Davidson, Okamoto and Kaneda2012) investigated such decay with an initial energy spectrum
 $\sim k^2$
and obtained results consistent with the Saffman suggestion
 $E(t) \sim t^{-6/5}$
for turbulence with a Saffman invariant (some authors prefer to call this the Birkhoff–Saffman invariant (see Birkhoff Reference Birkhoff1954; Panickacheril John et al. Reference Panickacheril John, Donzis and Sreenivasan2022; Saffman Reference Saffman1967)). Davidson (Reference Davidson2023) has reviewed recent progress in the understanding of the large scales in homogeneous, but anisotropic, turbulence, from Saffman-type initial data, and the associated passive-scalar decay, especially from a real-space perspective. The decay of passive-scalar turbulence has also been investigated by Son (Reference Son1999), Eyink & Xin (Reference Eyink and Xin2000), Chaves et al. (Reference Chaves, Eyink, Frisch and Vergassola2001)and Rowan (Reference Rowan2024). The free decay of 3-D Navier–Stokes (NS) turbulence has been studied with other types of initial data also; e.g. Borue & Orszag (Reference Borue and Orszag1995) have studied this decay with hyperviscosity; Biferale et al. (Reference Biferale, Boffetta, Celani, Lanotte, Toschi and Vergassola2003) have examined such decay with initial velocity fields taken from a simulation of forced, statistically steady turbulence; and Krstulovic & Nazarenko (Reference Krstulovic and Nazarenko2024) have studied the initial evolution of 3-D NS turbulence as it evolves towards a spectrum à la Kolmogorov. A recent overview and results from high-resolution DNSs is contained in Panickacheril John et al. (Reference Panickacheril John, Donzis and Sreenivasan2022). Experimental studies of such energy decay have a long history (see, e.g. Batchelor & Townsend Reference Batchelor and Townsend1947; Comte-Bellot & Corrsin Reference Comte-Bellot and Corrsin1966; Stalp, Skrbek & Donnelly Reference Stalp, Skrbek and Donnelly1999; Meldi & Sagaut Reference Meldi and Sagaut2012; Panickacheril John et al. Reference Panickacheril John, Donzis and Sreenivasan2022); decay data from such experiments are often fit to the form
 $E(t) \sim t^{-n}$
, but Meldi & Sagaut (Reference Meldi and Sagaut2012) and Panickacheril John et al. (Reference Panickacheril John, Donzis and Sreenivasan2022) note that the values reported for the exponent
 $n$
are spread over a wide range
 $\simeq 1.4{-}2$
. Meldi & Sagaut (Reference Meldi and Sagaut2012) use the eddy-damped-quasi-normal-Markovian (EDQNM) closure to suggest that this range of exponents may be understood because of non-self-similar energy decay that occurs if the initial energy spectrum has three power-law regions; Eyink & Thomson (Reference Eyink and Thomson2000) also employ the EDQNM to discuss non-self-similar energy decay of the type uncovered by Gurbatov et al. (Reference Gurbatov, Simdyankin, Aurell, Frisch and Tóth1997) in the context of the 1-D Burgers equation (see below).
On theoretical grounds, it is often said that the self-similar power-law decay of the energy arises from the principle of the permanence of large eddies (see § 7.8 in Frisch Reference Frisch1995). This principle builds upon results of Proudman & Reid (Reference Proudman and Reid1954), Tatsumi, Kida & Mizushima (Reference Tatsumi, Kida and Mizushima1978) and Frisch, Lesieur & Schertzer (Reference Frisch, Lesieur and Schertzer1980), which show that the beating interaction of two nearly opposite wavenumbers
 $k$
, whose absolute values are near the integral-scale wavenumber
 $K(t)$
, contributes to the low-wavenumber dynamics and a (transfer) input
 $T(k) \propto k ^4$
(in dimension
 $d=3$
). As a consequence, if the low-wavenumber initial data have an energy spectrum
 $E(k, t=0) \sim k^n$
, with
 $n \gt 4$
, then, for wavenumbers
 $k \ll K(t)$
and to leading order, the beating interaction leads to
 $E(k,t) \sim k^4$
and thence a power-law decay of
 $E(t)$
.
Starting in the late 1970s, energy decay was studied in the context of Burgulence, i.e. for random solutions to the Burgers equation arising from randomness in the initial conditions (see, e.g. Kida Reference Kida1979; She, Aurell & Frisch Reference She, Aurell and Frisch1992; Gurbatov et al. Reference Gurbatov, Simdyankin, Aurell, Frisch and Tóth1997; Frisch & Bec Reference Frisch and Bec2002; Noullez et al. Reference Noullez, Gurbatov, Aurell and Simdyankin2005). Such studies shed light on the principle of the permanence of large eddies. In particular, Kida (Reference Kida1979) and Gurbatov et al. (Reference Gurbatov, Simdyankin, Aurell, Frisch and Tóth1997) showed that, for the 1-D Burgers equation, initial data with single-power-law energy spectra lead to energy decay with an inverse power of time
 $t$
, sometimes modified by a logarithmic prefactor (see Gurbatov et al. Reference Gurbatov, Simdyankin, Aurell, Frisch and Tóth1997), which is now referred to as the Gurbatov phenomenon.
Given this historical background, we decided, at first, to focus mostly on self-similar and non-self-similar decay of the energy
 $E(t)$
. This was done here for:
-
(i) the 1-D Burgers equation;
-
(ii) and the 3-D viscous and hyperviscous NS equations.
In the process, we discovered a novel type of large-scale multifractality, which is intimately connected to the lack of self-similar decay.
We carry out two types of studies of freely decaying 1-D Burgulence: in the first type, we specify initial data in physical space, via the initial potential
 $\varphi _0(x)$
, which is related to the velocity by
 $u_0(x) = - \partial _{x} \varphi _0(x)$
; in the second type, we start with an initial energy spectrum
 $E_0(k)$
, which is chosen to have one or more power-law regions as a function of the wavenumber
 $k$
. For the first type of initial data, we obtain both rigorous and numerical results for the decay of the total energy
 $E(t)$
; these studies are designed to explore signatures of large-scale multifractality and the cross-over from small-scale to large-scale multifractality. With the second type of initial data we quantify, via DNSs, non-self-similar decay of
 $E(t)$
, the associated temporal evolution of the energy spectrum
 $E(k,t)$
, and the Gurbatov phenomenon (see Gurbatov et al. Reference Gurbatov, Simdyankin, Aurell, Frisch and Tóth1997) for initial energy spectra
 $E_0(k)$
that have more than one power-law region.
We perform two types of studies of freely decaying 3-D NS turbulence: in the first type, we use the viscous 3-D NS equation; in the second type, we use the hyperviscous 3-D NS equation, because this allows us to carry out long DNSs with enough spatial resolution to examine the temporal evolution of the energy spectrum
 $E(k,t)$
. In both these types of DNSs, we start with an initial energy spectrum
 $E_0(k)$
, which is chosen to have one or more power-law regions as a function of the wavenumber
 $k$
. With two power-law regimes, we obtain non-self-similar decay of
 $E(t)$
and, with certain initial-power-law exponents, the 3-D NS counterpart of the Gurbatov phenomenon (see Gurbatov et al. Reference Gurbatov, Simdyankin, Aurell, Frisch and Tóth1997; Frisch & Bec Reference Frisch and Bec2002).
The remaining part of this paper is organised as follows. In § 2 we discuss the 1-D Burgers equation and the rigorous results that we obtain for freely decaying 1-D Burgulence. Section 3 contains the results of our DNSs for such decay in the 1-D Burgers equation with different types of initial potentials
 $\varphi _0(x)$
or different initial energy spectra
 $E_0(k)$
. In § 4 we generalise these DNSs to studies of freely decaying turbulence in the 3-D viscous and hyperviscous NS equations. Section 5 is devoted to a discussion of the theoretical and experimental implications of our work. Technical details, both mathematical and numerical, are dicussed in Appendices A–D.
2. The Burgers partial differential equation (PDE) in 1-D: models and methods
The 1-D Burgers PDE without any forcing is given by
 \begin{equation} \partial _{t} u(x,t) + u(x,t) \partial _{x} u(x,t) = \nu \partial _{xx} u(x,t), \end{equation}
where
 $\nu \,{\geqslant}\, 0$
is the kinematic viscosity; in most of this paper we consider the inviscid case
 $\nu =0$
. The initial velocity is denoted by
 $u_{0}(x)$
. It is frequently convenient to work with the potential
 $\varphi (x,t)$
, related to the velocity by
 \begin{equation} u(x,t) = - \partial _{x} \varphi (x,t)\,. \end{equation}
The potential satisfies
 \begin{equation} \partial _{t} \varphi (x,t) = \tfrac {1}{2}\! \left ( \partial _{x} \varphi (x,t) \right)^2 + \nu \partial _{xx} \varphi (x,t)\,. \end{equation}
As is well known, the Burgers equation (2.1) can be mapped into the heat equation by a nonlinear transformation, introduced by Hopf (Reference Hopf1948, Reference Hopf1950) and Cole (Reference Cole1951). One consequence, strongly emphasised by Burgers (Reference Burgers1974), is that the zero-viscosity limit of the potential has a very simple explicit representation in terms of the initial potential
 $\varphi _0(x)$
 \begin{equation} \varphi (x,t) = \max _a\left (\varphi _0(a) - \frac {(x -a)^2}{2t}\right)\,, \end{equation}
where
 $\underset {a}{\max }$
is the maximum over all initial fluid particle positions
 $a$
. We shall refer to (2.4) as the ‘max formula’, which is essentially a Legendre transform. Indeed,
 $\varphi (xt,t) + (xt)^2/(2t)$
is a Legendre transform of
 $\psi _0(a):= \varphi _0(a) - a^2/(2t)$
(see, e.g. She et al. Reference She, Aurell and Frisch1992); numerically, we can move from the initial data to the solution at any time
 $t\gt 0$
, directly, without having to consider any intermediate times. This Legendre transform has an implementation whose spatial complexity is
 $\mathcal{O}(N \ln N)$
, where
 $N$
is the number of equally spaced collocation points (see, e.g. She et al. Reference She, Aurell and Frisch1992).
There is an important difference between the Burgers equation and the NS equation: the unforced Burgers equation has no mechanism allowing for the generation of stochastic solutions unless the initial conditions are random (see, e.g. She et al. Reference She, Aurell and Frisch1992; Gurbatov et al. Reference Gurbatov, Simdyankin, Aurell, Frisch and Tóth1997). Given that the Burgers equation is translationally invariant, we are particularly interested in stochastic solutions whose statistical properties have translational invariance (i.e. are homogeneous) or have translationally invariant increments (i.e. whose space derivatives are homogeneous).
2.1. Energy decay with a fractional Brownian initial potential
We work with the initial potential
 $\varphi _0(a)$
that we take to be a fractional Brownian motion with a Hurst exponent
 $0\lt H\lt 1$
. This means that the initial potential
 $\varphi _0(a)$
is Gaussian, it vanishes at the origin, and its second-order structure function is given by
 \begin{equation} \mathcal{S}_0(b) \equiv \langle (\varphi _0(a+b) -\varphi _0(a))^2 \rangle _a = C |b|^{2H}\,, \end{equation}
where
 $C$
is a positive constant and the subscript
 $a$
denotes an average over the (initial) Lagrangian coordinate
 $a$
. The only source of randomness in the setting of decaying Burgulence is provided by the random initial conditions. In the case of the random Burgers equation the random initial condition is determined by the random initial potential
 $\varphi _0(a)$
. Since
 $\varphi _0(a)$
is a process with stationary increments, the averaging of increments
 $\varphi _0(a+b) -\varphi _0(a)$
with respect to
 $\varphi _0$
can be replaced by averaging with respect to the Lagrangian coordinate
 $a$
. For a fixed time
 $t\gt 0$
, the stationarity of increments of the process
 $\varphi _0$
is reflected in translation invariance of the velocity field
 $u(x,t)$
. Hence, averaging with respect to
 $\varphi _0$
can be replaced by averaging with respect to the Eulerian coordinate
 $x$
. We recall that genuine Brownian motion (
 $H=1/2$
) is not only a Gaussian process, but it is also a Markov process with no memory. In contrast, if
 $H\neq 1/2$
, it is not a Markov process (see, e.g. Molchan Reference Molchan1997, Reference Molchan2000). Note that (2.5) implies that the initial energy spectrum has the following power-law dependence on the wavenumber
 $k$
:
 \begin{equation} E_0(k) \sim |k|^{1-2H}\,. \end{equation}
From a fluid-mechanical point of view, all these processes are self-similar, namely, for any
 $\lambda \gt 0$
and any real
 $a$
and
 $b$
, the increments of the initial potential
 $\varphi _0(a)$
are scale invariant in the following sense:
 \begin{equation} \varphi _0\left (a+\lambda (b-a)\right) - \varphi _0(a) \stackrel {\textrm{law}}{=} \lambda ^H \left (\varphi _0(b) -\varphi _0(a)\right)\,, \end{equation}
where ‘
 $\stackrel {\textrm{law}}{=}$
’ is read as ‘have the same (probabilistic) law as’. Taking
 $a=0$
and using
 $\varphi _0(0)=0$
, the scale invariance (2.7) becomes
 \begin{equation} \varphi _0 (\lambda b) \stackrel {\textrm{law}}{=} \lambda ^H \varphi _0(b)\;\; \implies \lambda ^{-H}\varphi _0 (\lambda b) \stackrel {\textrm{law}}{=} \varphi _0(b)\,, \end{equation}
which implies
 \begin{equation} \varphi _0(\lambda a_1)\varphi _0(\lambda a_2)\ldots \varphi _0(\lambda a_p) \stackrel {\textrm{law}}{=} \lambda ^{pH} \varphi _0(a_1)\varphi _0(a_2)\ldots \varphi _0(a_p)\,. \end{equation}
We now look at the finite-time evolution given by the max formula (2.4) and show rigorously below, for all
 $0 \lt H \lt 1$
, that the average kinetic energy decays self-similarly as a power of the time
 $t$
 \begin{equation} E(t) \equiv \langle u^2(x,t)\rangle _x = \big\langle (-\partial _x\varphi (x,t))^2\big\rangle _x\,;\;\; E(t) = \left (\frac {t}{t_*}\right)^{-\frac {2-2H}{2 - H}}\,\langle u^2\left (x, t_*\right) \rangle _x\,; \end{equation}
here, the subscript
 $x$
denotes an average over the Eulerian coordinate
 $x$
and
 $t_*$
is a non-vanishing reference time. This result was obtained as an asymptotic formula, based on the permanence of large eddies and the long-distance behaviour of the velocity correlation function, by Gurbatov et al. (Reference Gurbatov, Simdyankin, Aurell, Frisch and Tóth1997). (Rigorous results are more easy to obtain for the Brownian case
 $H=1/2$
, because it is a Markov process (see, e.g. Girsanov Reference Girsanov1960; Groeneboom Reference Groeneboom1983; Pitman Reference Pitman1983; Avellaneda & Weinan Reference Avellaneda and Weinan1995)).
To prove the law of energy decay (2.10), we change
 $x$
into
 $\lambda x$
and
 $a$
into
 $\lambda a$
in (2.4). Note that, because
 $\lambda \gt 0$
, the maximum over
 $a$
is also the maximum over
 $\lambda a$
, so using (2.8) we obtain
 \begin{equation} \varphi (\lambda x, t) \stackrel { \textrm{law}}{=} \max _{ a} \left (\lambda ^{H}\varphi _0({a}) - \frac {\lambda ^2}{2t}(x - {a})^2\right). \end{equation}
Here comes the essential step: on the right-hand side of (2.11) the coefficients of
 $\varphi _0({a})$
and of
 $- (x-a)^2/2$
have the ratio
 $\lambda ^{H}/ (\lambda ^2/t)$
. Therefore, it is natural to demand that the scale factor
 $\lambda$
be chosen in such a way that this ratio be unity. However,
 $\lambda$
is dimensionless but
 $t$
is not, so it is convenient to rewrite (2.11) in terms of the dimensionless ratio
 $t/t_*$
as follows (for a discussion of scaling functions in the context of the statistical mechanics of critical phenomena, see, e.g. Chapter 11 of Stanley Reference Stanley1971):
 \begin{equation} \varphi (\lambda x, t) \stackrel {\textrm{law}}{=} \max _{a} \left (\lambda ^{H}\varphi _0({a}) - \frac {\lambda ^2}{2(t/t_*) t_*}(x - {a})^2\right)\,, \end{equation}
where
 $t_*$
is an arbitrary positive, non-vanishing reference time. This requires
 \begin{equation} \lambda (t) = \left (\frac {t}{t_*}\right)^\frac {1}{2-H}, \end{equation}
so (2.11) can be rewritten as the scale-invariant equation
 \begin{equation} \varphi (\lambda (t) x, t) \stackrel {\textrm{law}}{=} \frac {\lambda ^2(t)}{(t/t_*)} \varphi (x,t_*)\,. \end{equation}
By combining (2.2) and (2.14) we obtain
 \begin{eqnarray} u(\lambda (t) x, t) &\stackrel {\textrm{law}}{=}& \frac {\lambda (t)}{t/t_*} u(x,t_*)\;\; \textrm{and} \nonumber \\ u ^2(\lambda (t) x, t) &\stackrel {\textrm{law}}{=}& \frac {\lambda ^2(t)}{(t/t_*)^2} u ^2(x,t_*)\,, \end{eqnarray}
which we use to obtain the decay law of the (mean) energy. We show below that the average energy is finite; therefore, we can use
 \begin{equation} \langle u ^2(\lambda (t) x, t) \rangle _x =\frac {\lambda ^2(t)}{(t/t_*)^2} \langle u ^2(x, t_*) \rangle _x\,, \end{equation}
whence we obtain the following law for the temporal variation of the energy:
 \begin{equation} E(t) = \langle u ^2(\lambda (t) x, t) \rangle _x = \left (\frac {t}{t_*}\right)^\frac {2H -2}{2-H} \langle u ^2(x, t_*)\rangle _x \,. \end{equation}
If
 $E(t)$
is finite at
 $t_* =1$
, as we prove below, then (2.15) implies that the energy will be finite at any positive time. Indeed, with Brownian initial data (ordinary or fractional) for the potential
 $\varphi _0$
, the initial energy is infinite. We emphasise that scaling arguments (see, e.g. Gurbatov et al. Reference Gurbatov, Simdyankin, Aurell, Frisch and Tóth1997) cannot be used to prove that
 $E(t)$
is finite at
 $t_* =1$
, because, as
 $t \to 0$
, (2.17) yields
 $E(t) \to \infty$
. To handle this, we need special tools that we forge hereafter.
2.2. An initial potential with a fractional Brownian motion: boundedness of the energy
We now demonstrate the boundedness of
 $E(t)$
at any finite time, e.g. at
 $t_*=1$
. We use the rigorous asymptotic relation for large deviations of the maximum of fractional Brownian motion (see (A4) in Appendix A) of Piterbarg & Prisyazhnyuk (Reference Piterbarg and Prisyazhnyuk1978). Let us first make a general remark about fractional Brownian motions
 $W_H(x)$
with Hurst exponent
 $H$
. Many important properties of the processes
 $W_H(x)$
are very similar to the properties of the standard Brownian motion for which
 $H=1/2$
. However, rigorous mathematical analysis for other values of
 $H$
is very challenging because of the non-Markovian character of the process (for Burgulence, see, e.g. Molchan Reference Molchan1997, Reference Molchan2017) when
 $H\neq 1/2$
. Although increments of
 $W_H(x)$
are stationary, they are not independent anymore if
 $H\neq 1/2$
. In fact, such increments are positively correlated, for
 $H\gt 1/2$
, and negatively correlated, for
 $H\lt 1/2$
. These correlations create mathematical difficulties in the analysis of
 $W_H(x)$
.
For an arbitrary fixed
 $U\,{\geqslant}\, 0$
, we have
 \begin{equation} \langle u^2(0,t_*=1)\rangle \leqslant U^2 {\mathcal P}\left ( |u(0,1)|\leqslant U \right) + \sum _{k=1}^\infty {(2^kU)^2\mathcal P\left (2^{k-1}U \lt |u(0,1)|\leqslant 2^kU\right)}\,. \end{equation}
Here,
 $\mathcal P$
is the probability distribution corresponding to the random initial condition
 $\varphi _0(a)$
given by the Fractional Brownian Motion with the Hurst exponent
 $H$
, i.e.
 $\varphi _0(a)=W_H(a)$
; furthermore, we have divided the range of possible values of
 $|u(0,1)|$
into the initial interval
 $[0,U]$
and a sequence of intervals
 $[2^{k-1}U,\; 2^kU],\; {\textrm {for}} \; k\,{\geqslant} \,1$
. Within each one of these intervals, we have used, for
 $|u(0,1)|$
, an upper bound
 $U$
, in the initial interval, and the bounds
 $2^kU$
, in the intervals with the integer
 $ k \,{\geqslant}\, 1$
. The squares of these upper bounds,
 $U^2$
and
 $(2^kU)^2$
, respectively, have been used in the estimate (2.18), as an obvious upper bound for
 $|u(0,1)|^2$
within the corresponding interval. The Lagrangian coordinate
 $a=a_{x,t}$
, corresponding to the location
 $x$
at time
 $t$
, is the location at time
 $t=0$
corresponding to the maximum value of
 $ (\varphi _0(a) - {(x-a)^2}/{2t})$
(see the max formula (2.4)). Given that
 $u(x,t)$
is the velocity,
 $a=x-tu(x,t)$
, which can be interpreted, for a fixed
 $t$
, as the inverse of the Lagrangian map from
 $a$
to
 $x$
. In particular, if
 $t=1$
, then the estimate
 $2^{k-1}U \lt |u(0,1)|\leqslant 2^kU$
implies that the Lagrangian coordinate
 $a$
, corresponding to
 $x=0$
at time
 $t=1$
, satisfies the same estimate
 $2^{k-1}U \lt |a|=|u(0,1)| \leqslant 2^kU$
. Since
 $\varphi (0,1)= \varphi _0(a) - a^2/2$
, and
 $\varphi (0,1)$
corresponds to maximising over all
 $a$
, we have
 $\varphi _0(a) - a^2/2\,{\geqslant}\, \varphi (0,0)=0$
. Hence,
 $\varphi _0(a)\,{\geqslant}\, a^2/2\gt (2^{k-1}U)^2/2$
. From here on, using standard inequalities, the scaling invariance of
 $\varphi _0(x)$
and a bound for the probability distribution of
 $\varphi _0(a)$
, obtained by Piterbarg & Prisyazhnyuk (Reference Piterbarg and Prisyazhnyuk1978) (see Appendix A for details), we have for
 $U$
large enough
 \begin{equation} \langle u^2(0,t_*\rangle \leqslant U^2 + \sum _{k=1}^{\infty} {(2^kU)^2 C_1M_k^{\mathfrak{h}}e^{-M_k^2/4}}\,, \end{equation}
where
 $M_k=U^{2-H}2^{(2-H)k}/8$
and
 $\mathfrak{h}=\max \{(1/H-2)\,, 0\}$
. It follows that the series in (A7) converges, given that the term
 $e^{-M_k^2/4}$
dominates
 $2^{2k}M_k^{\mathfrak{h}}$
. Hence, boundedness of the energy at time
 $t_*=1$
is established.
2.3. Oblivious fractional Brownian motion and large-scale multifractality
In this section we construct an initial potential that exhibits large-scale multifractality. In §§ 2.1 and 2.2 we proved that, when the initial potential
 $\varphi _0(a)$
is a fractional Brownian motion with a Hurst exponent
 $H$
, between
 $0$
and
 $1$
, the potential
 $\varphi (x,t)$
evolves in time in a self-similar way. This implies that the mean kinetic energy decays like a negative power of the time
 $t$
. We now show how to avoid the pitfall of self-similar evolution by making the initial potential a variant of the fractional Brownian motion (see Lévy Reference Lévy1953; Mandelbrot & Van Ness Reference Mandelbrot and Van Ness1968), but with long-time forgetfulness. As we have stated, the standard Brownian motion, with
 $H=1/2$
, is a Markov process: if the initial potential is known for some Lagrangian coordinate
 $a$
, then its (spatial) future, for
 $b\gt a$
, is independent of its (spatial) past, for
 $c\lt a$
. A fractional Brownian motion with a Hurst index
 $H \neq 1/2$
has a lot of (spatial) memory. How can we make it somewhat (spatially) forgetful or oblivious (from Latin obliviosus)?
In brief, the idea of making an oblivious version of fractional Brownian motion, without breaking the homogeneity, is the following. For the initial potential
 $\varphi (a, 0)$
, generate a realisation of a fractional Brownian motion with Hurst exponent
 $H$
. Take any initial Lagrangian point (for example
 $a=0$
). Let
 $l_1$
be positive and random (its probabilistic law will be specified in a moment). In the Lagrangian interval
 $[0, l_1]$
, let the initial potential be one realisation of a fractional Brownian motion with exponent
 $H$
. Pick another positive random
 $l_2$
. In the Lagrangian interval
 $[l_1, l_2]$
, the initial potential will be essentially another realisation of the same fractional Brownian motion. By ‘essentially’ we mean that the initial potential should be continuous at
 $a=l_1$
(an obvious way to achieve this is to generate the potential between
 $l_1$
and
 $l_2$
first and then to perform a vertical translation, which ensures the continuity at
 $l_1$
). Now we extend the definition in the Lagrangian space to
 $l_3$
, …We proceed similarly to the left of the Lagrangian origin
 $a=0$
. Finally, we specify the probability laws of the ‘oblivious’ intervals of lengths
 $l_1$
,
 $l_2$
,
 $l_3$
. We demand that their probability distribution function (PDF) should have ‘heavy tails’, i.e.
 $p(l) \sim l^{-\gamma }$
and that the oblivious intervals be independent. We emphasise that the condition of heavy power-law tails for the PDF of
 $l$
is crucially important for the large-scale-multifractality analysis that we present below. The above construction provides a good description of the main idea. However, the resulting point field generated by the endpoints of the intervals is not spatially homogeneous because it always contains the origin. The correct procedure, described below, starts with first selecting the interval containing the origin and then extending it by independently sampling intervals to the right and to the left of it. Translation invariance is achieved if the PDF for the initial interval is different from those of the rest of the intervals. It is shown in Appendix B that the PDF for the initial interval should be proportional to
 $lp(l)$
.
Our aim is to demonstrate that non-trivial scaling behaviour may occur at large times
 $t$
, and arises from fluctuations of the initial potential at large distances. More precisely, multifractality should manifest itself in the statistical behaviour of the averaged powers of the speed
 $|u(0,t)|$
at large times
 $t$
.
As we have noted above, a fractional Brownian motion with Hurst exponent
 $H$
is non-Markovian if
 $H \neq 1/2$
and, therefore, it retains memory of all past steps. We now define an oblivious fractional Brownian motion (OFBM
 $_H$
), which is continuous by construction and comprises a random translationally invariant sequence of intervals, over which memory is present. The initial potential restricted to these intervals will be given by the fractional Brownian motions with the same Hurst exponent
 $H$
. However, the increments of the fractional Brownian motions inside a particular interval will be statistically independent from the pieces in other intervals. One can say that the new piece does not remember the behaviour in the previous (spatial) pieces. We will call the processes with such loss of memory OFBMs. We shall assume that the probability density for the length of the intervals, where memory is present, has heavy tails. Hence, the probability of having very long intervals cannot be ignored. As a result, such large deviation events will give dominant contributions to the scaling behaviour of
 $\langle |u(0,t)|^{m}\rangle$
in the case of large enough values of
 $|m|$
. Below we consider two cases. In the first one, when
 $0\lt H\lt 1/2$
, this dominant contribution will correspond to negative values of the exponent
 $m$
such that
 $-1\lt m\lt -1 + \unicode {x03B5}$
for
 $\unicode {x03B5}$
small enough. In the second case, when
 $1/2\lt H\lt 1$
, contributions corresponding to long intervals will determine the power-law behaviour of
 $|u(0,t)|^{m}$
for all large-enough positive values of
 $m$
. In both cases, the scaling behaviour for small values of
 $|m|$
will be determined by the events of high probability, i.e. by the typical behaviour in terms of the lengths of the intervals used in the construction of the
 $\text{OFBM}_H$
. Below we provide the detailed analysis in both cases.
We start with the construction of a spatially homogeneous sequence of random intervals. Consider a sequence of independent identically distributed (iid) intervals in the Lagrange variable
 $a$
. We shall assume that the length
 $l$
of the intervals has the PDF
 $p(l)$
, where
 $p(l)\sim l^{-\gamma }$
as
 $l\to \infty$
, with the tail exponent
 $\gamma \gt 1$
. We are interested in random initial potentials with stationary increments, so we need to ensure that the point process, corresponding to the endpoints of the intervals, has translational invariance. This can be achieved by the following procedure. We start with some large negative
 $a=-L$
, and then begin adding iid intervals, sampled according to the PDF
 $p(l)$
in the positive direction. In the limit
 $L\to \infty$
, the starting point
 $a=-L$
plays no role, so, in this limit, we will obtain a translationally invariant point field of the endpoints of the intervals. Although the above construction is conceptually correct, it is better to achieve our goal of constructing a translationally invariant point field of the endpoints of the intervals as follows. It is easy to see that, for a fixed non-random point, the distribution of the length of the interval containing this point is different from the PDF
 $p(l)$
. Indeed, it is more probable that long intervals will contain a given point. It is not difficult to show that the corresponding PDF is proportional to
 $lp(l)$
(see, e.g. Chapter 4 in Daley & Vere-Jones Reference Daley and Vere-Jones2006). In Appendix B we explain the appearance of this extra factor
 $l$
. Now, the construction of the translationally invariant point field can be described as follows. We first sample the length
 $l_0$
of the interval
 $\varDelta _0$
containing the origin
 $a=0$
using its PDF, which is proportional to
 $lp(l)$
. Then we sample the location of the origin uniformly within the interval of length
 $l_0$
. In other words, we choose
 $\varDelta _0=[-\varepsilon, l_0-\varepsilon]$
, where
 $\varepsilon$
is uniformly distributed in
 $[0, l_0]$
. Next, we add intervals
 $\varDelta _{-i}, \; i\gt 0$
and
 $\varDelta _i, \; i\gt 0$
to the left and to the right of
 $\varDelta _0$
. The length of each interval
 $\varDelta _i, \; i\neq 0$
is an independent random variable with the distribution given by the PDF
 $p(l)$
. Note that the above construction can be carried out only if the exponent
 $\gamma \gt 2$
. Otherwise,
 $\int _0^\infty {lp(l)\textrm{d}l}=+\infty$
and a probability distribution with the PDF proportional to
 $lp(l)$
does not exist.
A schematic plot showing the construction of an OFBM
 $_H$
with Hurst exponent
 $H \in (0,1)$
: We consider intervals of length
 $l_i$
, with
 $i\in [1,2, \ldots]$
; for this illustration we consider three contiguous segments, of lengths
 $l_1$
,
 $l_2$
and
 $l_3$
. To obtain an OFBM
 $_H$
, we start with three independent realisations – light red, light green and light blue – of a fractional Brownian motion (FBM
 $_H$
) with a given Hurst exponent
 $H$
; in the first, second and third segments, we use the dark red, dark green and dark blue FBM
 $_H$
, respectively, after a vertical translation of the starting point of the FBM
 $_H$
, in segment labelled by
 $i$
, so that it meets the endpoint of the FBM
 $_H$
, in segment
 $(i-1)$
. The OFBM
 $_H$
is shown in dark red, dark green and dark blue (for our three-segment illustration). The lengths of the segments are random variables that are distributed according to the PDF
 $p(l)$
; here, we choose a power-law tail for this PDF:
 $p(l) \sim l^{-\gamma }, \;\; l \to \infty$
, with
 $\gamma$
the tail exponent (see text).

We next construct the initial potential
 $W(a), \, a\in \mathbb R^1$
. In each of the intervals
 $\varDelta _i, \; i \in \mathbb{Z}$
, we choose an independent realisation of FBM with the Hurst exponent
 $H$
. Notice that these FBMs are not extended beyond
 $\varDelta _i$
. For the interval
 $\varDelta _0$
we assume that the FBM starts at the origin. For all other
 $\varDelta _i$
we shall assume that it starts at the leftmost point of
 $\varDelta _i$
for positive
 $i$
, and at the rightmost point of
 $\varDelta _i$
for negative
 $i$
. Since we need our potential
 $W(a)$
to be continuous, we next move FBMs inside
 $\varDelta _{-1}$
and
 $\varDelta _1$
vertically, so that the values at the endpoints of
 $\varDelta _0$
are matched. We repeat this matching process for intervals
 $\varDelta _{-i}$
and
 $\varDelta _i$
consequently for
 $i= 2, \, 3, \ldots{\kern1.5pt}$
. The process constructed above is exactly the process which we call OFBMs with the Hurst exponent
 $H$
(
 $\text{OFBM}_H$
). Notice that by construction the increments of the process
 $W(a)$
, within different intervals
 $\varDelta _i$
, are independent.
2.3.1. Large-scale bifractality
Case A (
 $0\lt H\lt 1/2$
). We have mentioned above that we will be interested in the averages of the powers of the speed, i.e.
 $\langle |u(x,t)|^{m}\rangle$
for
 $m\gt -1$
. As we show in Appendix B,
 $\langle |u(x,t)|^{m}\rangle =+\infty$
for
 $m\leqslant -1$
. This is the reason why we only consider the range
 $m\gt -1$
. We will show that there are two important contributions, the first from intervals
 $\varDelta _i$
, which are not anomalously long, and the second from the interval
 $\varDelta _0$
when it is so long that the velocity at the origin will be determined by the FBM with fixed Hurst exponent
 $H$
inside this interval. This leads to
 \begin{align} \langle |u(0,t)|^{m}\rangle &\sim t^{s(m)}\,,\quad { \textrm{with}} \nonumber \\ s(m)&=-m/3\quad { \textrm{for}} \; m\,{\geqslant}\, m_A(H,\gamma)\equiv -\frac {3(\gamma -2)}{1-2H}\,,\nonumber \\ s(m)&=-\alpha (H)m-(\gamma -2)/(2-H) \quad { \textrm{for}} -1\lt m\lt m_A(H,\gamma)\,, \end{align}
where
 $\alpha (H)= (1-H)/(2-H)$
. This is an example of bifractal scaling, in so far as
 $s(m)$
is a piecewise linear function of
 $m$
. The detailed derivation of (2.20) is given in Appendix B.
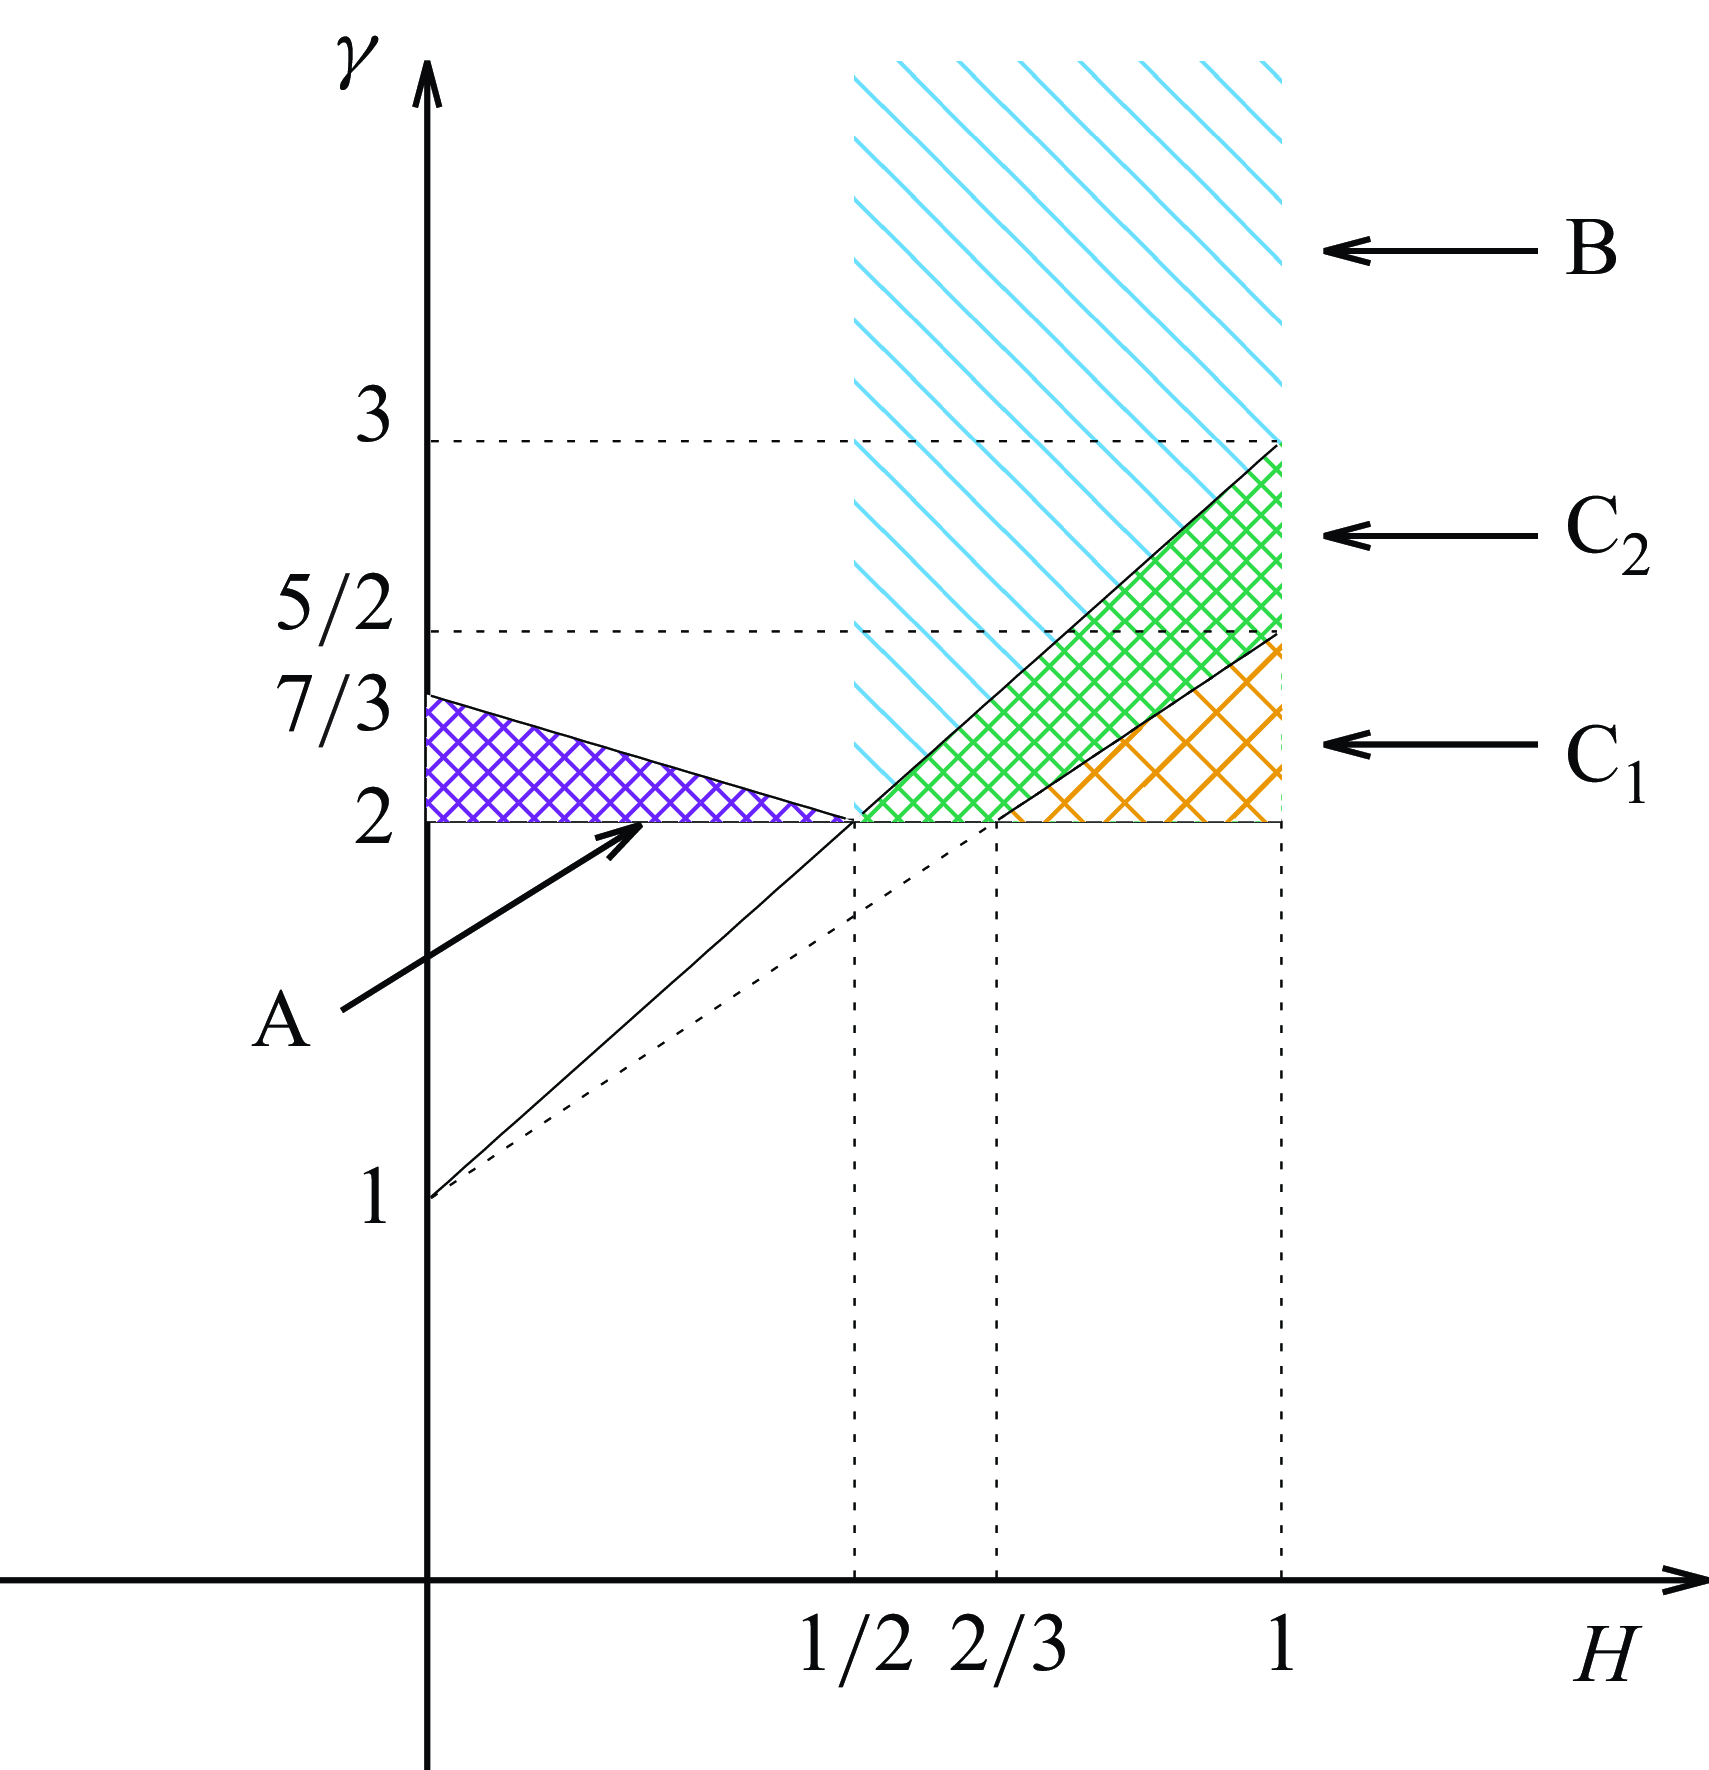
Case B (
 $1/2\lt H\lt 1,\; \tau = (\gamma -1)/2H \gt 1$
). The analysis proceeds as in case A above and we get
 \begin{align} s(m)&=-m/3\quad { \textrm{for}} \;\; -1 \lt m \leqslant m_B(H, \gamma) \,,\nonumber \\ s(m)&=-\alpha (H)m-(\gamma -2)/(2-H) \quad { \textrm{for}} \;\; m \gt m_B(H, \gamma)\,, \end{align}
where
 $\alpha (H) \lt 1/3$
and
 $m_B(h,\gamma)= {3(\gamma -2)}/({2H-1})$
; given that
 $\gamma \gt 1+2H$
, the exponent
 $m_B(h,\gamma)$
is greater than
 $3$
(see Appendix B for details); again this is an example of bifractal scaling.
Case C (
 $1/2\lt H\lt 1;\; \tau = (\gamma -1)/2H \lt 1$
). In case B above, with
 $1/2\lt H\lt 1$
, we had assumed that
 $\tau \gt 1$
. We now consider the last possible case with
 $1/2\lt H\lt 1$
and
 $\tau \lt 1$
, so
 $2\lt \gamma \lt 1+2H$
. The analysis in the case of the long interval
 $\varDelta _0$
remains unchanged, but the analysis for the other intervals
 $\varDelta _i$
has to be modified, as we discuss in detail in Appendix B. Finally, we obtain
 \begin{align} s(m)&=-m \frac {\gamma -1-H}{2\gamma -2-H}\quad { \textrm{for}} \; -1 \lt m \leqslant m_C(H, \gamma) \,,\nonumber \\ s(m)&=-\alpha (H)m-(\gamma -2)/(2-H) \;\; { \textrm{for}} \;\; m \gt m_C(H, \gamma)\,, \end{align}
where
 $m_C(H,\gamma)=({2\gamma -2-H})/{H}$
.
Note that the energy corresponds to the exponent
 $m=2$
. For this value of
 $m$
, in the first two cases considered above, the dominant contribution to
 $s(m)$
comes from the term
 $-{m}/{3}$
. Hence, the energy decays as
 $t^{-2/3}$
. The threshold
 $m_C(H,\gamma)$
is
 \begin{align} m_C(H,\gamma)&\leqslant 2 \;\; {\textrm { in}} \;\; C_1\equiv \{(H,\gamma): 2/3\lt H\lt 1,\;\; 2\lt \gamma \leqslant 3H/2 +1\}\,;\nonumber \\ m_C(H,\gamma) &\gt 2 \;\; {\textrm { in}} \;\; C_2 \equiv \{(H,\gamma): 1/2\lt H\lt 1, \;\max {\{2, 3H/2+1\}}\lt \gamma \lt 1+2H\}. \end{align}
The areas
 $C_1$
and
 $C_2 = C\setminus C_1$
are shown in figure 2. Therefore, the energy decays as follows:
 \begin{align} E(t)&\sim t^{-(\gamma-2H)/(2-H)}\,,\;\; {\textrm{for}}\;\; (H,\gamma) \in C_1\,;\ \ \ \end{align}
 \begin{align} E(t)&\sim t^{-(1-H/(2\gamma -2-H))}\,,\;\;{\textrm {for}}\;\; (H,\gamma) \in C_2\,. \end{align}
The exponent
 $(\gamma -2H)/(2-H)\leqslant 1/2$
, when
 $(H,\gamma) \in C_1$
, whereas, if
 $(H,\gamma) \in C_2$
, the exponent
 $1/2\lt 1-H/(2\gamma -2-H)\lt 2/3$
. Note that in all three cases there is also a subdominant contribution to
 $E(t)$
with a faster decay in the limit
 $t\to \infty$
.
In all three cases A, B and C considered above, the exponent
 $s(m)$
consists of two different pieces that are linear in
 $m$
, so this can again be viewed as bifractal behaviour.
The regions A, B and C, in the
 $H-\gamma$
parameter space, in which cases A, B and C (see text) are applicable, respectively.

2.3.2. Genuine large-scale multifractality
We now generalise the OFBM
 $_H$
, which we used in cases A–C above, to build an initial condition that leads to genuine large-scale multifractality. The crucial idea is to choose the Hurst exponent
 $H$
in OFBM
 $_H$
from a PDF for
 $H$
and use an
 $H$
-dependent tail exponent
 $\gamma =\gamma (H)$
. More precisely, we first sample the Hurst exponent
 $H$
and choose the parameter
 $\gamma =\gamma (H)$
. Then, we sample intervals
 $\varDelta _i, \, i\in \mathbb{Z}$
using the exponent
 $\gamma$
, and finally generate the OFBM
 $_H$
process
 $W(a)$
. Notice that, by construction, we use the same Hurst exponent
 $H$
for all intervals
 $\varDelta _i, \, i\in \mathbb{Z}$
. Hence, the analysis presented above remains valid. We provide the details, for case B, of such a construction in Appendix B; we outline the essential steps below. We proceed as in case B above by choosing
 $H_0$
,
 $\gamma _0$
and
 $m_0$
such that
 $1/2\lt H_0\lt 1$
,
 $\gamma _0 \gt (1+2H_0), \; { \textrm{and} \, }\; m_0 \gt m_B(H,\gamma)$
. We then sample
 $H$
uniformly from the interval
 $[H_0-\epsilon,H_0+\epsilon]$
, where
 $\epsilon$
is small and positive. Furthermore, we use the tail exponent
 $\gamma =\gamma (H)$
, with
 $\gamma (H_0)=\gamma _0$
, and then show that
 $s(m)$
is related to
 $[-\alpha (H)m-({\gamma (H)-2})/({2-H})]$
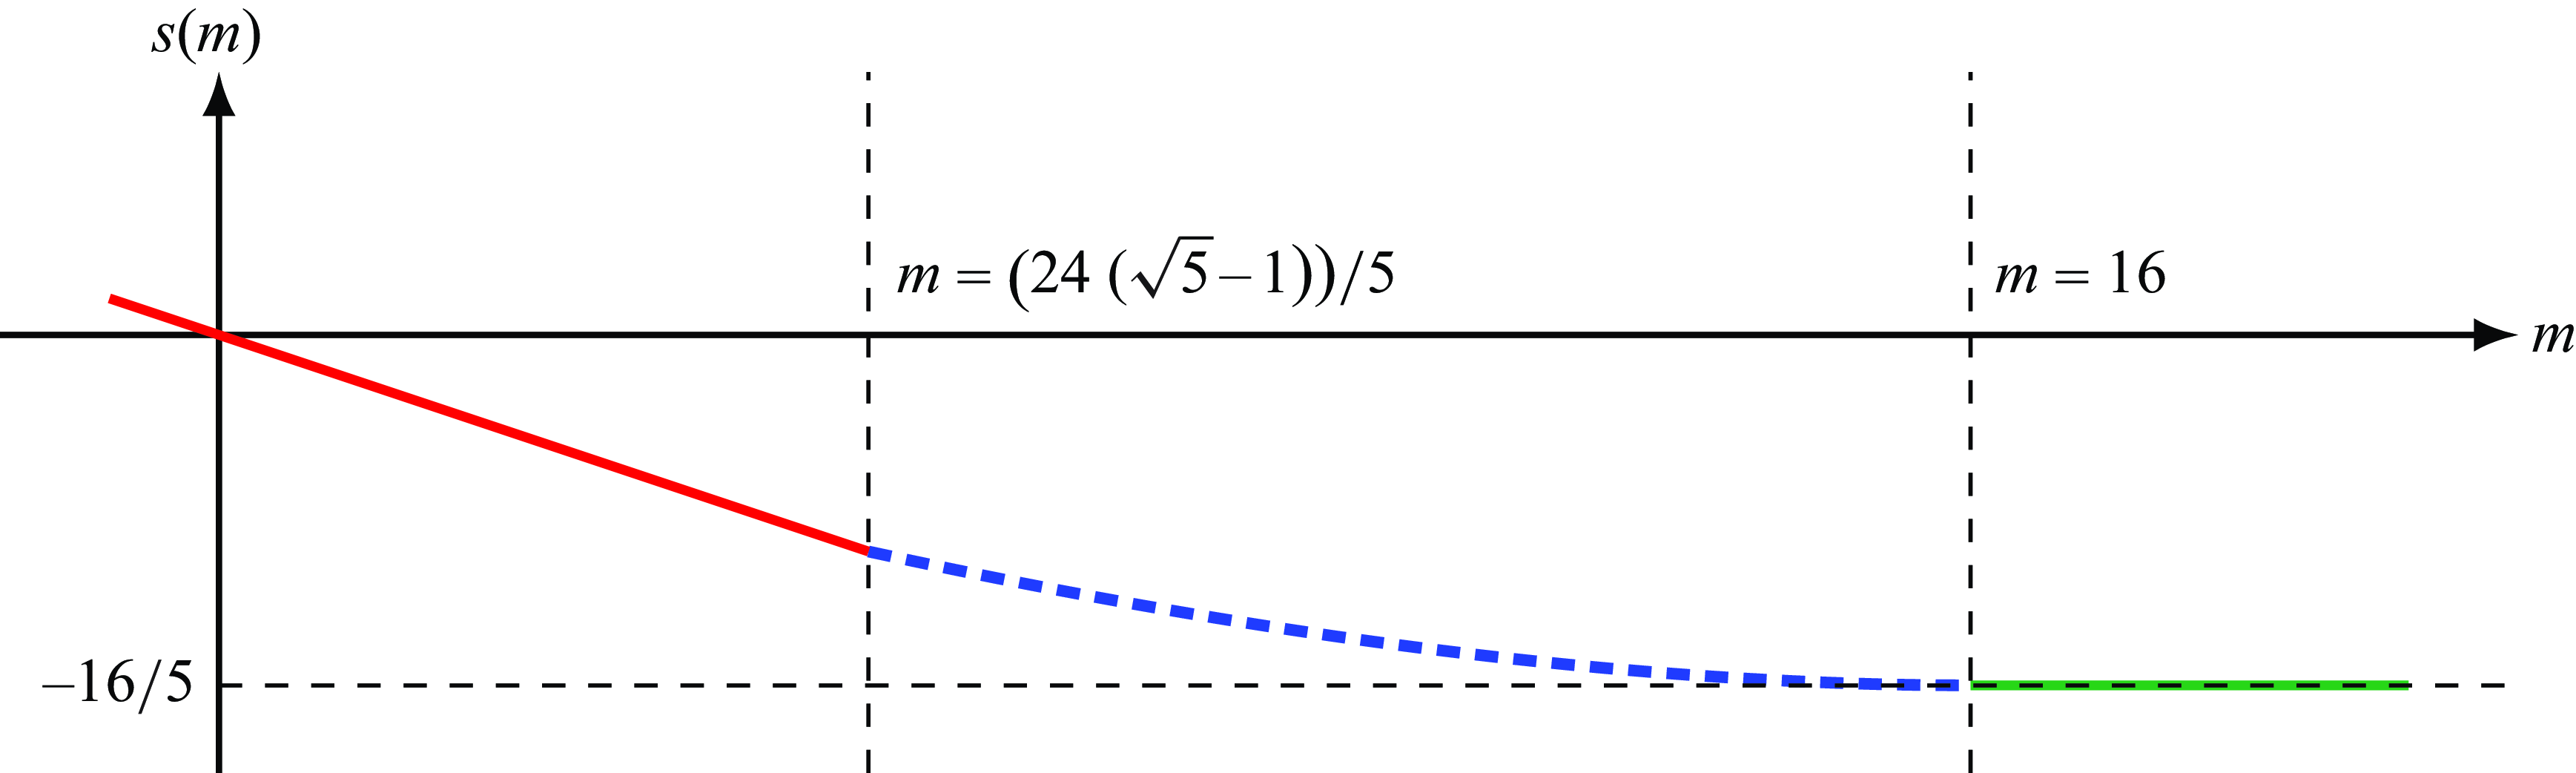
by a Legendre transformation (B29). For example, if we use the values
 $H_0=3/4, \, \gamma _0=3, \, m_0=7, \epsilon = 1/4$
with
 $\gamma (H)=3+6(4H-3)/5+(4H-3)^2$
, we get
 \begin{equation} s(m)=\begin{cases} -\dfrac {m}{3}, & \, -1\lt m\leqslant \dfrac {24(\sqrt {5}-1)}{5}\,; \\[2pt] \dfrac {224}{5}-m -8\sqrt {32-m}, & \, \dfrac {24(\sqrt {5}-1)}{5}\lt m\lt 16\,; \\[2pt] -\dfrac {16}{5}, &\, m\,{\geqslant}\, 16\,. \end{cases} \end{equation}
We plot
 $s(m)$
versus
 $m$
in figure 3. Clearly, (2.26) implies genuine multifractality because
 $s(m)$
has truly nonlinear dependence on
 $m$
, and not just a combination of different linear functions of
 $m$
(as, e.g. in (2.20)).


3. Numerical results for energy decay in 1-D Burgulence
We now present the results from our DNSs for the decay of energy in the 1-D Burgers equation. We then consider multifractal initial conditions for the initial potential
 $\varphi _0(x)$
, which are constructed differently from the OFBM
 $_H$
, as we describe in detail in § 3.2. In § 3.3 we use initial energy spectra
 $E_0(k)$
that have multiple ranges characterised by power laws that are distinct from each other.
3.1. Burgers equation in one dimension
We have introduced the 1-D Burgers equation (2.1) in § 2. Here, we consider the case in which the velocity field
 $u(x,t)$
is defined on the periodic interval
 $ [ 0, L_{s}]$
and the kinematic viscosity
 $\nu \in \mathbb{R}_{+}$
. We relate the velocity to the potential
 $\varphi (x,t)$
(2.2) that satisfies the (2.3). In the limit of
 $\nu \rightarrow 0^{+}$
, the solution
 $\varphi (x,t)$
is given by the max formula (2.4). The inverse Lagrangian function
 $a(x,t)$
gives the (initial) position at time
 $t_{0}$
of a fluid particle that is at
 $x$
at time
 $t$
. Thus the velocity
 $u(x,t)$
is found to be (see She et al. Reference She, Aurell and Frisch1992; Vergassola et al. Reference Vergassola, Dubrulle, Frisch and Noullez1994)
 \begin{equation} u[x, t] = u [a(x, t), t_{0}] = \frac {x - a(x, t)}{ t - t_{0}}\,, \end{equation}
where
 $x$
is the Eulerian position (coordinate).
3.2. Multifractal initial conditions with periodicity
We briefly describe the algorithm that we have developed for generating multifractal initial data, whose spatio-temporal evolution we then monitor using the max formula (2.4) and (3.1) for the 1-D inviscid Burgers equation. Multifractal random walks, which were studied by Bacry, Delour & Muzy (Reference Bacry, Delour and Muzy2001 a), take the form
 \begin{equation} X_n = \sum _{k=1}^{n} \xi _{k} e^{\Omega _k}, \quad n = 1, 2, \ldots \end{equation}
For other methods generating multifractal fields, see, e.g. Benzi et al. (Benzi Reference Benzi, Biferale, Crisanti, Paladin, Vergassola and Vulpiani1993) and Wilczek (Reference Wilczek2016). Here, the sequence
 $\xi _k$
is Gaussian white noise and
 $e^{\Omega _k}$
is a log-normal variable. In addition,
 $\Omega _k$
values are correlated, with the covariance matrix
 \begin{equation} \text{cov}\left ( \Omega _{k_1}, \Omega _{k_2} \right) \propto \log \frac {\mathcal{L}}{|k_1 -k_2| +1}, \quad |k_1 -k_2| \leqslant \mathcal{L}\,, \end{equation}
where
 $\mathcal{L}$
is the length scale below which the walk displays multifractality (see Bacry, Delour & Muzy Reference Bacry, Delour and Muzy2001
b) and above which the walk is a FBM. Note that by tuning
 $\mathcal{L}$
, we can go from small-scale to large-scale multifractality. However, we cannot use this numerical scheme of § 3 directly because we here impose periodic boundary conditions in our system.
Therefore, to generate a multifractal random walk with periodic boundary conditions, we generalise the method of Bacry et al. (Reference Bacry, Delour and Muzy2001 a) by combining it with the technique of Dietrich & Newsam (Reference Dietrich and Newsam1997) as follows. We consider the sequence
 \begin{equation} A_n \equiv B_n e^{ \Omega _n}, \quad 1 \leqslant n \leqslant N\,, \end{equation}
where
 $B_n$
and
 $\Omega _n$
are random numbers with the following statistics: we choose
 $B_n$
to be Gaussian random numbers, but with the additional restriction
 $\sum _{i=1}^N B_n = 0$
. Thus, the random walk
 $W_n = \sum _{k=1}^{n-1} B_n$
, constructed using
 $B_n$
, is periodic and approximately Brownian (
 $H=1/2$
) at scales much smaller than the length of the system; i.e. the
 $B_n$
values are increments of the random walk
 $W_n$
, for which
 $H=1/2$
at small scales. Later, we will consider increments of a random walk for which
 $0 \lt H \lt 1$
. Specifically, we use the procedure prescribed by Dietrich & Newsam (Reference Dietrich and Newsam1997) to compute the sequence
 $\Omega _n$
. Then, in terms of
 $A_n$
, we define
 \begin{equation} A^{\prime}_n = A_n - \frac {1}{N}\sum _{i=1}^{N} A_i\,. \end{equation}
This ensures that
 $A^{\prime}_n$
is periodic. Then we consider the following sequence of random numbers, which are computed using
 $A^{\prime}_n$
:
 \begin{equation} M_n = \begin{cases} 0, & \quad n=1 \\ \sum _{i=1}^{n-1} A^{\prime}_i, & \quad n \gt 1 \,. \end{cases} \end{equation}
The random numbers
 $M_n$
show multifractal properties because of the factors
 $e^{\Omega_n}$
. Note that if
 $\Omega _n \rightarrow 0$
, we recover a simple random walk with
 $H=1/2$
at small scales (by construction as explained above).
We now consider freely decaying turbulence in the 1-D inviscid Burgers equation (2.1), with the multifractal initial condition that we have obtained using (3.2)–(3.6) with
 $H=1/2$
for the initial potential
 $\varphi _0$
. (We describe our results for a multifractal random walk (MRW) with
 $H=0.75$
for the initial potential
 $\varphi _0$
in Appendix C.1, where we also discuss decaying 1-D Burgulence with such MRWs for the initial velocity.) In our numerical studies, which use (2.4) and (3.1) and the algorithm of Noullez & Vergassola (Reference Noullez and Vergassola1994), we discretise the system with
 $N=2^{14}$
points.
In figure 4(a) we show log–log plots of the energy spectrum
 $E(k,t)$
versus the wavenumber
 $k$
at different representative times
 $t$
; at early times
 $0 \leqslant t \lesssim 10^{-5}$
, this spectrum is not of a simple, power-law form because of the multifractal initial condition for
 $\varphi _0(x)$
; however, for
 $10^{-4.5} \lesssim t$
, the spectrum has the power-law form
 $E(k,t) \sim k^{-2}$
because of the formation of shocks. The decay of the total energy
 $E(t)$
is shown in the log–log plot of figure 4(b); the temporal decay does not have a single-exponent, power-law form for
 $0 \leqslant t \lesssim 1$
; however, at later times, it shows the power–law decay
 $E(t) \sim t^{-2}$
, once the integral length scale becomes comparable to the system size. We compute the order-
 $p$
velocity structure functions
 $S_p(\ell,t) \equiv [u(x+\ell,t) - u(x,t)]^p$
and plot it versus the separation
 $\ell$
(see the log–log plot in figure 5
a); we obtain the multiscaling exponents
 $\zeta _p$
, which follow from the power-law form
 $S_p(\ell,t) \sim \ell ^{\zeta _p}$
for
 $\ell$
in the pink-shaded region in figure 5(a). We use a local-slope analysis (figure 5
b) to extract these exponents, which we plot versus the order
 $p$
in figure 5(c) at
 $t=0$
(red curve) and
 $t=10^{-3}$
(blue curve). We observe that multifractality is present at
 $t=10^{-5}$
(see figure 5), in so far as
 $\zeta _p$
is a nonlinear function of
 $p$
.
Log–log plots of (a) the energy spectrum
 $E(k,t)$
versus the wavenumber
 $k$
, at some representative values of
 $t$
(the inset shows the initial spectrum
 $E(k,0)$
in detail in the wavenumber range
 $5\times 10^2\leqslant k\leqslant 6 \times 10^2$
) and (b) the scaled total energy
 $E(t)/E(t=0)$
versus the time
 $t$
for the multifractal initial condition (3.2)–(3.6), for the potential
 $\varphi _0$
, with Hurst exponent
 $H=1/2$
; the inset shows a plot of the local slope. We compute structure functions in figure 5 at the point in time that lies at the centre of the interval indicated by the blue vertical lines.

Plots for the multifractal initial condition, for the potential
 $\varphi _0$
, with Hurst exponent
 $H=1/2$
at
 $t=10^{-5}$
: (a) log–log plots versus
 $\ell$
of the structure functions of order
 $p=1, \ldots, 5$
. (b) Plots of
 $\zeta _p^{loc}$
, obtained from local slopes of the structure functions in (a), versus
 $\ell$
. (c) Plots of
 $\zeta _p$
versus
 $p$
(in blue) at
 $t=10^{-5}$
.

3.3. Burgers equation in 1-D: power-law initial data
We have seen in § 2 that, if the initial potential
 $\varphi _0$
is a FBM, with Hurst exponent
 $0 \lt H \lt 1$
, then the initial energy spectrum has the power-law form
 $E_0(k) \sim |k|^{(1-2H)}$
given in (2.6). Therefore, in our DNSs, we examine various types of initial conditions whose Fourier transforms lead to power-law regions in the initial energy spectrum
 $E_0(k)$
. To obtain a single-power-law regime, as in (2.6), we use a Gaussian random initial velocity profile
 $u(x,0)$
for which the Fourier modes
 $\widetilde {u}_{k}(0)$
for the wavenumber
 $k \,{\geqslant}\, 0$
take the following form:
 \begin{align} \widetilde {u}_{k}(0) &= \sqrt { A \, \mathcal{E}(k) } \, \exp\, \! \left ( - k^{2}/k^{2}_{c} \right) X_{k}\,; \nonumber \\ { \textrm{here,}}\;\; \mathcal{E}(k) &\equiv k^n,\quad { \textrm{with}} \quad -1\lt n \lt 2\,; \end{align}
 $A$
is a positive constant, with the cutoff wavenumber
 $k_{c} \gg 1$
, and
 $X_{k}$
is a standard complex Gaussian random variable. With these initial data, the energy decay is self-similar, as in (2.10) for
 $-1\lt n\lt 1$
, which is associated with the permanence of large eddies, with
 $E(t) \sim t^{{-2(n+1)}/{(n+3)}}$
and an integral scale
 $L(t) \sim t^{{2}/{(n+3)}}$
(see, e.g. She et al. Reference She, Aurell and Frisch1992; Gurbatov et al. Reference Gurbatov, Simdyankin, Aurell, Frisch and Tóth1997, and page 114 of Roy Reference Roy2021). If
 $1 \lt n \lt 2$
, we encounter the Gurbatov phenomenon, namely,
 $E(k,t) \gt E_0(k)$
for wavenumbers
 $k \leqslant K(t) \sim 1/L(t)$
. This leads to non-self-similar decay (growth) of
 $E(t)$
(
 $L(t)$
) because of logarithmic corrections (see Gurbatov et al. Reference Gurbatov, Simdyankin, Aurell, Frisch and Tóth1997 and Roy Reference Roy2021).
3.3.1. Case I: two-power-law initial energy spectrum
We consider next the case in which the initial energy spectrum
 $E_{0}(k)$
has two spectral ranges with different power laws, specifically,
 \begin{equation} E_{0}(k) = \begin{cases} A_{1} \mathcal{E}_{1}(k) & \quad \textrm{ for }\,{\textit k} \lt k_{1} \,,\\ A_{2} \mathcal{E}_{2}(k) \exp \, \! \left [ - 2 k^{2}/k^{2}_{c} \right] & \quad \textrm{ for }\, \textit{k} \,{\geqslant}\, k_{1} \,, \end{cases} \end{equation}
where the constants
 $A_{1}$
and
 $A_{2}$
are chosen such that
 $E_{0}(k)$
is continuous and the functions
 \begin{equation} \mathcal{E}_{i}(k) = k^{n_{i}}, \quad i = 1,2\,; \end{equation}
so, in this case, the initial spectrum
 $E_{0}(k)$
depends on the pair of integers
 $\overline {n} = (n_{1}, n_{2})$
. We consider the following four pairs: I(a)
 $\overline {n} = (0.25, 0.75)$
; I(b)
 $\overline {n} = (0.5, 1.5)$
; I(c)
 $\overline {n} = (1.5, 0.5)$
; and I(d)
 $\overline {n} = (1.25, 1.75)$
.
We describe our results for case I(a) in detail below and discuss the other cases in Appendix C.3.
For case I(a), the energy spectrum
 $E(k,t)$
at time
 $t\gt 0$
has one peak at
 $k_{p}(t)$
, so we describe its features as follows:
 \begin{equation} E(k,t) = \begin{cases} E_{0}(k) &\quad \text{for}\, k \lt k^{\prime}(t) \lt k_{p}(t) \,, \\ J(k, t) &\quad \text{for}\, k^{\prime}(t) \leqslant k \leqslant k^{\prime\prime}(t) \,, \\ J(k^{\prime\prime}(t),t) (k^{\prime\prime}(t)/ k)^{2} &\quad \text{for}\, k \gt k^{\prime\prime}(t) \gt k_{p}(t) \,. \end{cases} \end{equation}
The function
 $J(k,t)$
is defined on the interval
 $ [ k^{\prime}(t), k^{\prime\prime}(t)]$
. Here,
 $J(k,t)$
describes the smooth portion of the continuous part of the spectrum that includes the peak at
 $k_{p}(t)$
. In this case I(a),
 $\overline {n} = (0.25, 0.75)$
, both
 $n_1$
and
 $n_2$
are less than
 $1$
, so
 $E(k,t)$
is bounded above by
 $E(k,0)$
for all
 $t$
, i.e. there is no Gurbatov effect (see figure 5 in Gurbatov et al. Reference Gurbatov, Simdyankin, Aurell, Frisch and Tóth1997). By contrast, cases I(b),
 $\overline {n} = (0.5, 1.5)$
, I(c),
 $\overline {n} = (1.5, 0.5)$
and I(d),
 $\overline {n} = (1.25, 1.75)$
, show the Gurbatov effect with regions where
 $E(k,t)$
is not bounded above by
 $E(k,0)$
for all
 $t$
(see Appendix C.3). Furthermore, at large times,
 $E(k,t) \sim k^{-2}$
because of the formation of shocks.
The temporal evolution of the energy spectrum is shown in figure 6(a) by log–log plots of
 $E(k,t)$
versus
 $k$
at some representative times. The decay of the total energy (figure 6
b) and the growth of the integral length scale (figure 6
c) clearly show two temporal regimes:
 $E(t)$
decays as
 $\sim t^{-0.9}$
(respectively
 $\sim t^{-0.8}$
) for
 $t \in [10^{-7}, 10^{-2}]$
(respectively
 $t \in [10^{-2}, 10^{2}]$
). The integral scale
 $L(t)$
grows with an exponent greater than
 $ 0.5$
throughout these two regimes. The variation in the local slopes are shown in the insets of the plots of
 $E(t)$
versus
 $t$
and
 $L(t)$
versus
 $t$
in figures 6(b) and 6(c), respectively. The exponents for the energy decay,
 $\simeq -0.9$
and
 $\simeq -0.8$
, compare well with the values
 $-0.93$
and
 $-0.77$
, respectively, which are computed using the formula for the single-power-law case (see (C9) in Appendix C.2) and taking into consideration the peak position
 $k_{p}(t)$
. A single exponent, which characterises the growth
 $L(t)$
, cannot be extracted from figure 6(c). Thus, figures 6(b) and 6(c) provide clear evidence for non-self-similar decay of
 $E(t)$
and growth of
 $L(t)$
, respectively.
Log–log plots for (a) the energy spectrum
 $E(k,t)$
versus the wavenumber
 $k$
at representative times
 $t$
, (b) the decay of the total energy
 $E(t)$
with time
 $t$
and (c) the growth of the integral length scale
 $L(t)$
with time
 $t$
for case I(a), with a two-power-law initial energy spectrum (see § 3.3.2). The insets show local slopes that can be used to estimate the decay and growth exponents in (b) and (c), respectively.

3.3.2. Case II: four-power-law initial energy spectrum
The initial energy spectrum, involving four main spectral ranges with power-law dependences on
 $k$
, is given by
 \begin{equation} E_{0}(k) = \begin{cases} A_{1} \mathcal{E}_{1}(k) & \quad \textrm{for}\;\textit{k} \lt k_{1} ,\\ A_{2} \mathcal{E}_{2}(k) & \quad \textrm{for }\; \textit{k}_{1} \leqslant k \lt k^{2}_{1},\\ A_{3} \mathcal{E}_{3}(k) & \quad \textrm{for }\; k^{2}_{1} \leqslant \textit{k} \lt k^{3}_{1},\\ A_{4} \mathcal{E}_{4}(k) \exp \! \left [ - 2 k^{2}/k^{2}_{c} \right] & \quad \textrm{for}\; \textit{k} \,{\geqslant}\, k^{3}_{1}, \\ {\textrm {with}}\;\; \mathcal{E}_{i} \sim k^{n_i}, & \quad {\textrm{and}} \; i = 1,\,2,\,3, 4 , \end{cases} \end{equation}
and power-law regions specified by the quartet of exponents
 $\overline {n}= (n_1,\,n_2,\,n_3,\,n_4)$
(cf. (3.9)). We consider the following two examples: II(a)
 $\overline {n} = (0.5,1.5,0.5,1.5)$
; and II(b)
 $\overline {n} = (1.5,-1.5,1.5,-1.5)$
. We describe below our results for the choice of exponents II(a) (for the choice II(b) see Appendix C.4). The temporal evolution of
 $E(k,t)$
for case II(a) is shown in figure 7(a) by log–log plots of
 $E(k,t)$
versus
 $k$
at some representative times. This is similar to the spectral evolution in case I(a) (if, roughly speaking, we consider the first two and the last two spectral ranges independently). However, there is one important difference: Because
 $n_2$
and
 $n_4$
are both greater than
 $1$
, we obtain a Gurbatov effect (see Gurbatov et al. Reference Gurbatov, Simdyankin, Aurell, Frisch and Tóth1997) so
 $E(k,t)$
rises above
 $E(k,0)$
in some ranges of
 $k$
and
 $t$
. The decay of the total energy
 $E(t)$
and the growth of the integral length
 $L(t)$
, which can be surmised from the log–log plots in figures 7(b) and 7(c), respectively, are non-self-similar.
Log–log plots for (a) the energy spectrum
 $E(k,t)$
versus the wavenumber
 $k$
at representative times
 $t$
, (b) the decay of the total energy
 $E(t)$
with time
 $t$
and (c) the growth of integral length scale
 $L(t)$
with time
 $t$
for case II(a), with a four-power-law initial energy spectrum (see § 3.3.2). The insets show local slopes that can be used to estimate the decay and growth exponents in (b) and (c), respectively.

4. Energy decay in incompressible Navier–Stokes turbulence
In §§ 2 and 3 we have shown, theoretically and numerically, respectively, that for 1-D Burgulence, in the limit of vanishing viscosity and without forcing, we do not necessarily have a self-similar power-law decay of the energy
 $E(t)$
. To what extent can we obtain analogous non-self-similar decay of
 $E(t)$
for the 3-D NS equation (3DNSE) in the limit of vanishing viscosity?
From a mathematical point of view, this is a rather difficult question, because we do not know under what conditions these equations, with smooth initial conditions, possess unique solutions, devoid of singularities for all positive times. Let us leave such mathematical concerns aside for the moment and recapitulate, briefly, some results for the decay of
 $E(t)$
in the 3DNSE. Kolmogorov (Reference Kolmogorov1941) shed some light on this problem by deriving the following equation:
 \begin{equation} \partial _t E(t) = -\textit{CE}^{3/2}(t)L^{-1}(t)\,, \end{equation}
where
 $C$
is a positive dimensionless constant; this is (22) in Kolmogorov (Reference Kolmogorov1941), which makes a scaling assumption ((19) in Kolmogorov Reference Kolmogorov1941); we note, with hindsight, that this assumption implicitly excludes multifractality. However, (4.1) can still not be solved because it contains two unknown functions,
 $E(t)$
and
 $L(t)$
. To overcome this problem, Kolmogorov then used the Loitsiansky invariant, whose invariance was later called into question by Proudman & Reid (Reference Proudman and Reid1954), who used the quasi-normal closure. Subsequent studies (see, e.g. Tatsumi et al. Reference Tatsumi, Kida and Mizushima1978; Frisch et al. Reference Frisch, Lesieur and Schertzer1980; Gurbatov et al. Reference Gurbatov, Simdyankin, Aurell, Frisch and Tóth1997) argued that these results of Proudman & Reid (Reference Proudman and Reid1954) are robust and that they are valid even if we do not employ the quasi-normal closure. Furthermore, they formulated the principle of permanence of large eddies (see § 7.8 in Frisch Reference Frisch1995) by building upon the key result by Proudman & Reid (Reference Proudman and Reid1954) that the beating interaction of two nearly opposite wavenumbers
 $k$
, whose absolute values are near the integral-scale wavenumber
 $\sim L^{-1}(t)$
, contributes to the low-wavenumber dynamics a (transfer) input of
 $T(k) \propto k ^4$
in three dimensions. As a consequence, if the low-wavenumber initial energy has a spectrum much steeper than
 $k^4$
, the low-
 $k$
energy spectrum develops a
 $k^4$
regime.
In § 4.1 we present the results of our DNSs of freely decaying turbulence in the viscous or hyperviscous 3-D incompressible NS equations; DNSs with hyperviscosity allow us to overcome the limited-resolution problems that beset their viscous counterparts. In order to alleviate this problem, we then move to the hyperviscous incompressible NS equations (for a precise definition see § 4.1).
4.1. Numerical simulation of the Navier–Stokes case
We study freely decaying turbulence in the incompressible 3DNSE
 \begin{align} \partial _t \boldsymbol{u} + (\boldsymbol{u}\boldsymbol\cdot {\boldsymbol\nabla})\boldsymbol{u} &= -{\boldsymbol\nabla} p - \nu _{\beta} [-\varDelta]^{\beta} \boldsymbol{u}\,; \nonumber \\ {\boldsymbol\nabla} \boldsymbol\cdot \boldsymbol{u} &= 0\,; \end{align}
where
 $\boldsymbol{u}(\boldsymbol{x}, t)$
,
 $p(\boldsymbol{x}, t)$
and
 $\varDelta = {\boldsymbol\nabla} ^2$
denote the velocity, pressure and Laplacian, respectively; we set the constant density
 $\rho =1$
; and we consider the viscous and hyperviscous cases
 $\beta = 1$
and
 $\beta = 2$
with kinematic viscosity
 $\nu _1$
and kinematic hyperviscosity
 $\nu _2$
, respectively.
We use a cubical domain with sides of length
 $2\pi$
and periodic boundary conditions and a standard pseudospectral method (see, e.g. Canuto et al. Reference Canuto, Hussaini, Quarteroni and Zang2007) for our DNSs with isotropic truncation for dealiasing, i.e. the Fourier modes with wavevector
 $|\boldsymbol{k}| \,{\geqslant}\, \sqrt {2}N/3$
are set to zero;
 $N^3$
is the number of collocation points; we use
 $N = 512$
. To obtain reliable data for the decay of turbulence at long times, it is important to use a sophisticated time-stepping scheme, so we employ the high-order Runge–Kutta method, known as the Dormand–Prince 853 scheme, accompanied with adaptive step-size control (see Hairer, Nørsett & Wanner Reference Hairer, Nørsett and Wanner1993), so that we can increase the time step
 $\delta t$
as the flow decays. We use dense output (see Hairer et al. Reference Hairer, Nørsett and Wanner1993) in order to have the data output at regularly spaced intervals in time. Dense output is an interpolation method for data that are obtained with irregular time steps; the Dormand–Prince 853 scheme used in conjunction with dense-output data has an accuracy of
 $\mathcal{O}[(\delta t)^7]$
. If we set the order of the Laplacian
 $\beta$
larger than
 $2$
, the 3DNSEs become so stiff that this adaptive control is not efficient.
4.1.1. One-power-law initial energy spectrum for Navier–Stokes turbulence
(a) Log–log plots of the energy spectrum
 $E(k,t)$
versus the wavenumber
 $k$
at representative values of the time in the range
 $0 \leqslant t \leqslant 820$
; (b) and (c) display log–log plots versus
 $t$
of the total energy
 $E(t)$
and the integral length scale
 $L(t)$
, respectively; (d), (e) and (f) are, respectively, the hyperviscous-DNS counterparts of (a), (b) and (c).

To validate the use of hyperviscosity in a DNS of freely decaying turbulence, we consider the initial energy spectrum
 \begin{align} E(k, t=0) \propto k^4 \exp \, \left [-2\left (\frac {k}{k_p}\right)^2\right]\,, \end{align}
with the peak wavenumber set to
 $k_p = 40$
, which has been studied via DNSs of the 3DNSE with
 $\beta=1$
, i.e. conventional viscosity (see, e.g. Ishida et al. Reference Ishida, Davidson and Kaneda2006; Panickacheril John et al. Reference Panickacheril John, Donzis and Sreenivasan2022). The phases of the velocity Fourier modes are uniformly distributed random variables, between
 $0$
and
 $2\pi$
, iid for each velocity component. Here, we do not take an average with respect to those initial phases, but present results for one realisation of these phases. We set the initial total energy to
 $1/2$
, namely,
 $E(t=0) = 1/2$
; furthermore, we take
 $\nu _1 = 2.0\times 10^{-4}$
, in the viscous DNS (
 $\beta = 1$
) or
 $\nu _2 = 8.97 \times 10^{-9}$
in our hyperviscous DNS (
 $\beta = 2$
). In the top row of figure 8 we present the results from our viscous DNS: figure 8(a) shows log–log plots of the energy spectrum
 $E(k,t)$
versus the wavenumber
 $k$
at representative values of the time in the range
 $0 \leqslant t \leqslant 820$
; figures 8(b) and 8(c) display log–log plots versus
 $t$
of the total energy
 $E(t)$
and the integral length scale
 $L(t)$
, respectively. Figures 8(d), 8(e) and 8(f) are, respectively, the hyperviscous-DNS counterparts of figures 8(a), 8(b) and 8(c). By comparing the plots in the top row of figure 8 with their counterparts in the bottom row, we see that the hyperviscous DNS yields cleaner scaling regions than the viscous DNS. In particular, the results for
 $E(t)$
and
 $L(t)$
(their precise definitions are given in Appendix D.1) are closer to the expectations
 $E(t) \propto t^{-10/7}$
and
 $L(t) \propto t^{2/7}$
(based on the arguments given in Kolmogorov Reference Kolmogorov1941; Comte-Bellot & Corrsin Reference Comte-Bellot and Corrsin1966; Tatsumi et al. Reference Tatsumi, Kida and Mizushima1978). This implies that, with limited spatial resolution, the DNS with hyperviscosity provides us a good method for studying freely decaying turbulence in the 3DNSE. Therefore, we use DNSs, with hyperviscosity (
 $\beta = 2$
), to probe non-self-similar decay of
 $E(t)$
that is associated with multiple power-law regions in the initial energy spectrum
 $E(k,t=0)$
(cf. § 3.3 for 1-D Burgulence).
Both our viscous and hyperviscous DNSs lead to substantial scaling ranges in figures 8(b), 8(c), 8(e) and 8(f). However, they also indicate that the permanence of the large eddies (PLE) breaks down in the following sense: if we follow the prefactor
 $A$
of the
 $k^4$
part in
 $E(k, t) = A k^4$
, then we find that
 $A$
depends on time in both figures 8(a) and 8(d). This PLE is a key assumption in the early phenomenological treatment of energy decay in 3DNSE turbulence (see, e.g. Comte-Bellot & Corrsin Reference Comte-Bellot and Corrsin1966; Tatsumi et al. Reference Tatsumi, Kida and Mizushima1978; this reference also explored smaller scales, than the ones we consider here, and suggested a Kolmogorov-type spectrum (at those scales), which was subsequently revised by Frisch et al. (Reference Frisch, Lesieur and Schertzer1980)); this breakdown can be understood by the non-conservation of the Loitsiansky invariant (as argued by Kida & Goto (Reference Kida and Goto1997) within a closure calculation). In contrast, if we start with an initial spectrum
 $E(k,0) \sim k^2$
, this sort of the breakdown of the PLE is not observed, with both the viscous and hyperviscous DNSs, reflecting the conservation of the associated Birkhoff–Saffman invariant (see, e.g. Davidson et al. Reference Davidson, Okamoto and Kaneda2012; Panickacheril John et al. Reference Panickacheril John, Donzis and Sreenivasan2022).
We note, in passing, that, in both figures 8(a) and 8(d), the spectra
 $E(k,t)$
rise above the initial spectrum
 $E(k,t=0)$
; this is the 3DNSE counterpart of the Gurbatov phenomenon (see Gurbatov et al. Reference Gurbatov, Simdyankin, Aurell, Frisch and Tóth1997).
4.1.2. Two-power-law initial energy spectrum for Navier–Stokes turbulence
We next consider an initial energy spectrum with the following two-power-law form:
 \begin{align} E(k, t = 0) \propto \begin{cases} k^{n_1} & 1 \leqslant k \leqslant k_1 \\ k^{n_2} \exp \, [-2 (k / k_p)^2] & k_1 \leqslant k\,. \end{cases} \end{align}
Given our study of 1-D Burgulence in § 3.3.1, we anticipate that the decay of
 $E(t)$
will not be self-similar with the initial condition (4.4). In particular,
 $E(t) \propto t^{-\alpha }$
does not hold for all times; at intermediate times it crosses over from one power-law form to another (this can be viewed as an example of intermediate asymptotics in the sense of Barenblatt & Zel’Dovich Reference Barenblatt and Zel’dovich1972; Barenblatt Reference Barenblatt1996). In our hyperviscous (
 $\beta = 2$
) DNS, we use
 $512^3$
grid points and we set
 $k_1 = 10$
and
 $k_p = 60$
.
As in § 4.1.2, the phases of the Fourier coefficients of the initial velocity are taken to be uniformly distributed independent random variables between
 $0$
and
 $2\pi$
. The initial total energy
 $E(t=0)=1/2$
, the kinematic hyperviscosity is set to
 $\nu _2 = 1.66 \times 10^{-8}$
, and for the exponents of the initial spectrum (4.4) we use the representative values
 $(n_1, n_2) = (1.5, 3.0)$
. Results for other pairs
 $(n_1,n_2)$
are given in Appendix D.2. In this case, the naïve prediction respectively. This naïve theory, going back to Kolmogorov (Reference Kolmogorov1941), says that, if
 $E_0(k) \sim k^n$
, then
 $E(t)\sim t^{F(n)}$
, with
 $F(n)={-2(n+1)}/{(n+3)}$
and
 $L(t) \sim t^{G(n)}$
, with
 $G(n)={2}/{(n+3)}$
. Therefore, if
 $n=3$
, then
 $E(t)\sim t^{-4/3}$
and, if
 $n=1.5$
, then
 $E(t)\sim t^{-10/9}$
; the corresponding growth of the integral scale is, respectively,
 $L(t) \sim t^{1/3}$
and
 $L(t) \sim t^{4/9}$
is an initial decay region with
 $E(t) \sim t^{-4/3}$
followed by another one with
 $E(t) \propto t^{-10/9}$
, the first because of the
 $k^{3}$
part of
 $E_0(k)$
and the second arising from the
 $k^{1.5}$
part; the corresponding naïve power-law growth regions in the integral scale are
 $L(t) \sim t^{1/3}$
and
 $L(t) \sim t^{4/9}$
, respectively.
We present the results of our hyperviscous DNS (
 $\beta = 2$
) in figure 9: figure 9(a) shows log–log plots of the energy spectrum
 $E(k,t)$
versus the wavenumber
 $k$
at representative values of the time in the range
 $0 \leqslant t \leqslant 820$
; figures 9(b) and 9(c) display log–log plots versus
 $t$
of the total energy
 $E(t)$
and the integral length scale
 $L(t)$
, respectively. To uncover possible power-law regimes in the log–log plots of the total energy
 $E(t)$
and
 $L(t)$
, in figures 9(b) and 9(c), respectively, we plot logarithmic local slopes in the insets of these figures. In the inset of figure 9(b), we see that this slope first goes below the naïve prediction, for the decay exponent at early times, namely,
 $-4/3$
, and then approaches the naïve prediction, for the decay exponent at late times, namely,
 $-10/9$
. After this cross-over region, the log-slope inset shows a narrow plateau around
 $-10/9$
and finally departs from it when the peak of the energy spectrum reaches the smallest wavenumber (cf. the spectrum
 $E(k,t)$
in figure 9
a); this departure occurs when the second power-law regime
 $k^{1.5}$
is lost as
 $E(k,t)$
evolves in time. The decay of
 $E(t)$
is somewhat consistent with the naïve prediction, if we interpret the first turnover as a plateau around the naïve decay-exponent value
 $-4/3$
for the
 $k^{3}$
part in the initial energy spectrum
 $E(k,t=0)$
. However, the integral scale
 $L(t)$
does not show a turnover near the first exponent
 $1/3$
for
 $k^{3}$
, but exhibits a plateau at the second naïve growth exponent
 $4/9$
for the
 $k^{1.5}$
part in the initial energy spectrum
 $E(k,t=0)$
.
Furthermore, the extents in time of the plateaux in the logarithmic local slopes in
 $E(t)$
and
 $L(t)$
(in the insets of figures 9
b and 9
c) do not coincide well with each other. The departure from the naïve expectation
 $E(t) \sim t^{-10/9}$
occurs in the range
 $100 \lt t \lt 200$
, as can be surmised from the temporal evolution of
 $E(k,t)$
in figure 9(a). Specifically, the energy spectrum at
 $t = 102$
, which is the fourth curve from below in figure 9(a), does not have the
 $k^{1.5}$
part in the low-wavenumber region. In contrast, the departure from the naïve prediction
 $L(t) \sim t^{4/9}$
occurs approximately one decade earlier than its counterpart for
 $E(t)$
. This may be caused by the bottleneck effect (Frisch et al. Reference Frisch, Kurien, Pandit, Pauls, Ray, Wirth and Zhu2008), which is enhanced by the hyperviscosity, as can be seen from the nearly flat regions of the energy spectra at intermediate times.
Results for the decay of energy from our DNS for the hyperviscous 3DNSE with a two-power-law initial energy
 $E(k, t=0) \propto k^{1.5}$
and
 $E(k, t=0) \propto k^3$
, i.e.
 $(n_1, n_2) = (1.5,\,3)$
in (4.4). (a) Log–log plots of the energy spectrum
 $E(k,t)$
versus the wavenumber
 $k$
at representative values of the time in the range
 $0 \leqslant t \leqslant 820$
; (b) and (c) display log–log plots versus
 $t$
of the total energy
 $E(t)$
and the integral length scale
 $L(t)$
, respectively; in (b) and (c) logarithmic local slopes are given in the insets, where
 $F(n) = -2 (n + 1)/(n + 3)$
is the naïve prediction for the power-law exponent for the decay of
 $E(t)$
, if
 $E(k, t=0) \sim k^n$
and
 $G(n) = 2/(n + 3)$
is the corresponding prediction for the growth exponent of the integral scale
 $L(t)$
.

In summary, then, our DNSs with hyperviscosity (
 $\beta =2$
) have helped us to unveil the non-self-similar decay of
 $E(t)$
and growth of
 $L(t)$
for the two-power-law initial energy spectrum (4.4). The cross-over from one decay or growth exponent to another is subtle and may be viewed as an example of intermediate asymptotics à la Barenblatt & Zel’Dovich (Reference Barenblatt and Zel’dovich1972) and Barenblatt (Reference Barenblatt1996). To uncover these cross-overs completely is a challenging numerical problem because high spatial resolution is required to achieve sufficient scale separation between different power-law regimes in the wavenumber
 $k$
, and we must carry out very long runs.
5. Conclusions
We have discussed freely decaying turbulence in 1-D Burgulence and 3-D NS turbulence. Our studies have been designed to explore how different types of initial conditions that lead to non-self-similar temporal decay of the energy
 $E(t)$
and, hitherto unanticipated, large-scale multifractality. In table 1 we give an overview of our principal results, which we discuss in detail below.
Summary of our results. Top panel: rigorous results for 1-D Burgulence. Middle panel: numerical results for 1-D Burgulence. Bottom panel: numerical results for 3-D NS turbulence.

We have first investigated the decay of the energy
 $E(t)$
in 1-D Burgulence, for a FBM initial potential, with Hurst exponent
 $H$
. We have then given the first rigorous proof that
 $E(t)\sim (t/t_*)^{-({2-2H})/({2 - H})}$
, with
 $t_*$
is any positive reference time; furthermore, we have established the boundedness of
 $E(t)$
for all
 $t \gt 0$
, a non-trivial result given that the initial datum is an FBM. Next, we have introduced a new type of FBM that we call an OFBM
 $_H$
, with Hurst exponent
 $H$
. We have proved that 1-D Burgulence, with an OFBM
 $_H$
initial potential
 $\varphi _0(x)$
, exhibits intermittency and large-scale bifractality or multifractality, which we have uncovered via the exponents
 $s(m)$
that follow from
 $\langle |u(x,t)|^{m}\rangle \sim t^{s(m)}$
(see (2.20)). Multifractality is proved to occur if
 $H$
is sampled for the OFBM
 $_H$
as in § 2.3.2. We expect that OFBMs will have applications in other fields of physics, chemistry, biology and finance; we will explore this in future work.
We have provided the first rigorous proof of genuine multifractality for turbulence in a nonlinear hydrodynamical PDE; the specific PDE we consider is the 1-D Burgers equation. We emphasise that the large-scale multifractality we have uncovered is non-universal, in as much as it depends on the initial condition; by contrast, conventional small-scale multifractality (see, e.g. Frisch Reference Frisch1995) is believed to be universal. Multifractality has been proven in the Kraichnan model (see Kraichnan Reference Kraichnan1968) for passive-scalar advection (see, e.g. Falkovich, Gawedzki & Vergassola Reference Falkovich, Gawȩdzki and Vergassola2001); however, in this passive-scalar problem, the advection–diffusion equation is linear and the statistics of the advecting velocity field are specified. Earlier studies of 1-D Burgulence have obtained the exponents
 $\zeta _p$
analytically, but these results have always led to bifractality (see, e.g. Vergassola et al. Reference Vergassola, Dubrulle, Frisch and Noullez1994; Frisch & Bec Reference Frisch and Bec2002 and Bec & Khanin Reference Bec and Khanin2007). A mathematical proof of multifractality in 3-D NS turbulence remains a challenging open question.
We have then explored non-self-similar decay via DNSs of freely decaying 1-D Burgulence, with the following initial data:
-
(i)
 $\varphi _0(x)$
a multifractal random walk, for which we have developed a spatially periodic generalisation of the multifractal random walk of § 3, which crosses over to an FBM for lengths greater than a prescribed cross-over scale
$\mathcal{L}$
(see § 3.2). The decay (growth) of
$E(t)$
(
$L(t)$
) is non-self-similar; the multifractality of the initial condition persists, but, at very long times, the energy decays with the power-law exponent associated with the simple scaling for a FBM with Hurst exponent
$H$
(see § 2.1); indeed, by tuning the value of
$\mathcal{L}$
, the cross-over from small-scale to large-scale multifractality becomes feasible. We note that if
$\mathcal{L}_B$
is the linear size of the domain, of course,
$ \mathcal{L} \lt \mathcal{L}_B$
. Eventually, we are interested in the limit
$\mathcal{L}_B \to \infty$
, which can be taken in the following two ways: (i)
$\mathcal{L}_B \to \infty$
with
$\mathcal{L}$
held fixed
$\mathcal{L}/\mathcal{L}_B \to 0$
, so we only have small-scale multifractality; (ii) both
$\mathcal{L}_B$
and
$\mathcal{L}$
tend to infinity, such that the ratio
$\mathcal{L}/\mathcal{L}_B$
goes to a finite, non-zero constant, so we can make
$\mathcal{L}$
large enough to get large-scale multifractality; indeed, by tuning the value of this ratio, the cross-over from small-scale to large-scale multifractality becomes feasible.
-
(ii) Initial energy spectra
$E_0(k)$
with one or more power-law regions, as a function of the wavenumber
$k$
, which lead, respectively, to self-similar and non-self-similar decay of
$E(t)$
with time. If any one of these power-law exponents is greater than
$1$
, then the evolving spectrum exhibits a Gurbatov-type effect (see Gurbatov et al. Reference Gurbatov, Simdyankin, Aurell, Frisch and Tóth1997) with
$E(k,t)$
rising above
$E(k,0)$
in some ranges of
$k$
and
$t$
. The logarithmic corrections associated with the Gurbatov effect (see Appendix C) are not easy to obtain in a DNS that has limited spatial and temporal resolution.


We have then extended these studies to the 3-D viscous and hyperviscous NS equations. Our hyperviscous DNSs enable us to obtain
 $E(t)$
, for initial energy spectra
 $E_0(k)$
, with either one power law or two power laws. The former leads to self-similar decay of
 $E(t)$
and the latter to non-self-similar decay of
 $E(t)$
and the corresponding growth of
 $L(t)$
. The evolution of the energy spectra, the decay of
 $E(t)$
, and the growth of
 $L(t)$
are qualitatively similar to their counterparts in the 1-D Burgers case discussed in § 3.3. We also obtain Gurbatov-type phenomena (see Appendix C for the 1-D Burgulence counterpart).
Earlier suggestions of non-self-similar decay of
 $E(t)$
are based on the EDQNM closure. In particular, Eyink & Thomson (Reference Eyink and Thomson2000) have suggested that, with a steep power-law region in the initial spectrum
 $E_0(k)$
, a Gurbatov-type non-self-similar decay could occur in the 3DNSE. The EDQNM study of Meldi & Sagaut (Reference Meldi and Sagaut2012), with two-power-law initial energy spectra
 $E_0(k)$
, also yields non-self-similar decay of
 $E(t)$
and Gurbatov-type phenomena. It is interesting to note that closure schemes, e.g. EDQNM, can capture the non-self-similar decay of
 $E(t)$
. Of course, such closures cannot capture either small-scale or large-scale multifractality.
The decay of passive-scalar turbulence has also been investigated by Son (Reference Son1999), Eyink & Xin (Reference Eyink and Xin2000), Chaves et al. (Reference Chaves, Eyink, Frisch and Vergassola2001) and Rowan (Reference Rowan2024). Our study is different from these passive-scalar investigations in the following important way: the advection–diffusion equation for a passive scalar is linear unlike the nonlinear 1-D Burgers and 3-D NS equations we consider. In the following sentences, we give brief descriptions of some of these passive-scalar results; and we refer the reader to the original references for details. Eyink & Xin (Reference Eyink and Xin2000) have found all of the self-similar decay solutions for the Kraichnan passive-scalar problem (see Kraichnan Reference Kraichnan1968); they have also suggested a breakdown of the permanence of large eddies, for certain initial data, that is reminiscent of the Gurbatov et al. (Reference Gurbatov, Simdyankin, Aurell, Frisch and Tóth1997) effect in decaying Burgulence, which we have discussed above. Davidson (Reference Davidson2023) has discussed the decay of a passive scalar evolving in freely decaying turbulence, especially for Saffman-type initial data. Rowan (Reference Rowan2024) has carried out a rigorous study of the decay of the passive scalar in the Kraichnan model and shown an ‘exponential rate of
 $L^2$
decay in the expectation of the passive scalar’.
We end with a discussion of the possibility of investigating – theoretically, numerically and experimentally – large-scale multifractality in freely decaying or forced, statistically steady NS and Magnetohydrodynamics (see, e.g. Kalelkar & Pandit Reference Kalelkar and Pandit2004) turbulence. In our discussion of large-scale multifractality in § 2.3, we have worked with the Lagrangian variable
 $a$
. Therefore, when we try to look for signatures of large-scale multifractality in experiments or numerical studies, a Lagrangian framework might well prove to be useful. Our study of freely decaying 3-D NS turbulence in § 4 has, so far, used an Eulerian description. In future work we will extend this by tracking Lagrangian particles. In Burgulence, Lagrangian particles get trapped at shocks, so we must take this into consideration (see, e.g. De, Mitra & Pandit Reference De, Mitra and Pandit2023 and De, Mitra & Pandit Reference De, Mitra and Pandit2024).
It was shown by Frisch et al. (Reference Frisch, Pouquet, Léorat and Mazure1975) (for a recent overview see Alexakis & Biferale Reference Alexakis and Biferale2018)), that there are good reasons to believe that an injection at intermediate wavenumbers of magnetic helicity could drive an inverse cascade of magnetic helicity. It is important to investigate under which conditions this inverse cascade might display large-scale intermittency.
We end with suggestions for experiments that might be performed to examine large-scale multifractality in freely decaying turbulence. The natural way to design such experiments would be to begin with earlier studies of decaying turbulence in wind tunnels with fractal grids (see, e.g. Krogstad & Davidson Reference Krogstad and Davidson2011; Valente & Vassilicos Reference Valente and Vassilicos2011) and then generalise them using multifractal grids. The simplest realisation of such grids could employ the algorithm that we have used in § 3.2 to obtain a multifractal initial condition for the initial potential in the 1-D Burgers equation, where the cross-over length
 $\mathcal{L}$
can be tuned to move from small-scale to large-scale multifractality. It could well turn out that Lagrangian measurements might be best suited to uncover large-scale multifractality.
Acknowledgements
We thank E. Aurell, C. Bardos, L. Biferale, M. Blank, M.-E Brachet, P. Davidson, H. Frisch, S.S.V. Kolluru, A. Lanotte, A. Mailybaev, D. Mitra, G. Molchan, S. Nazarenko, C. Rampf, S.S. Ray, A. Sobolevski and L. Székelyhidi for their thoughtful comments.
Funding
UF, KK, RP, and TM were partially supported by the French ministry of education. TM is funded by Grants-in-Aid for Scientific Research KAKENHI (C) No. 19K03669 and 23K03247 from JSPS. UF is also grateful to the Université Côte d’Azur for support. RP and DR thank the Anusandhan National Research Foundation (ANRF), the Science and Engineering Research Board (SERB) and the National Supercomputing Mission (NSM), India, for support, and the Supercomputer Education and Research Centre (IISc), for computational resources. RP and TM were supported by the Research Institute for Mathematical Sciences, an International Joint Usage/Research Center located in Kyoto University.
Declaration of interests
The authors report no conflict of interest.
Appendix A
A.1. Proof of the boundedness of
$E(t)$
for
$t \gt 0$


In § 2.2 we had outlined the proof of the boundedness of
 $E(t)$
for
 $t \gt 0$
. We give below the details of this proof for any finite time
 $t$
, e.g. at
 $t=1$
.
In (2.18), we had for an arbitrary fixed
 $U\,{\geqslant}\, 0$
 \begin{equation} \langle u^2(0,1)\rangle \leqslant U^2 {\mathcal P}\left ( |u(0,1)|\leqslant U \right) + \sum _{k=1}^\infty {(2^kU)^2\mathcal P\big(2^{k-1}U \lt |u(0,1)|\leqslant 2^kU\big)}\,, \end{equation}
with
 $\mathcal P$
the probability distribution corresponding to the random initial condition
 $\varphi _0(a)=W_H(a)$
, namely, the FBM with Hurst exponent
 $H$
. We had divided the range of values of
 $|u(0,1)|$
into the initial interval
 $[0,U]$
and the sequence of intervals
 $[2^{k-1}U,\; 2^kU]\,, \textrm {for} \; {\textrm {integers}}\; k\,{\geqslant}\, 1$
. We had used, for
 $|u(0,1)|$
, an upper bound
 $U$
, in the initial interval, and the bounds
 $2^kU$
, in the intervals with
 $k\,{\geqslant}\, 1$
. The squares of these upper bounds appear in the estimate (A1), in the corresponding interval. Recall that the Lagrangian coordinate
 $a=a_{x,t}$
, corresponding to the location
 $x$
at time
 $t$
, gives the location at
 $t=0$
corresponding to the maximum of
 $ (\varphi _0(a) - {(x-a)^2}/{2t})$
(see the max formula (2.4)); and
 $a=x-tu(x,t)$
, for a fixed
 $t$
, is the inverse of the Lagrangian map from
 $a$
to
 $x$
. In particular, if
 $t=1$
, then the estimate
 $2^{k-1}U \lt |u(0,1)|\leqslant 2^kU$
implies that the Lagrangian coordinate
 $a$
, corresponding to
 $x=0$
at time
 $t=1$
, satisfies the same estimate
 $2^{k-1}U \lt |a|=|u(0,1)| \leqslant 2^kU$
. Since
 $\varphi (0,1)= \varphi _0(a) - a^2/2$
, and
 $\varphi (0,1)$
corresponds to maximising over all
 $a$
, we have
 $\varphi _0(a) - a^2/2\,{\geqslant}\, \varphi (0,0)=0$
. Hence,
 $\varphi _0(a)\,{\geqslant}\, a^2/2\gt (2^{k-1}U)^2/2$
. It follows that, for the last term in (A1)
 \begin{equation} \begin{aligned} \mathcal P\left (2^{k-1}U\lt |u(0,1)|\leqslant 2^kU\right) \leqslant \mathcal P\left (\max _{-2^kU\leqslant a \leqslant 2^kU}{\varphi _0(a)}\,{\geqslant}\, \frac {1}{2}(2^{k-1}U)^2\right) \\ \leqslant \mathcal P\left (\max _{-2^kU\leqslant a \leqslant 0}{\varphi _0(a)}\,{\geqslant}\, \frac {1}{8}2^{2k}U^2\right) + \mathcal P\left (\max _{0\leqslant a \leqslant 2^kU}{\varphi _0(a)}\,{\geqslant}\, \frac {1}{8}2^{2k}U^2\right)\\ = 2\mathcal P\left (\max _{0\leqslant a \leqslant 2^kU}{\varphi _0(a)}\,{\geqslant}\, \frac {1}{8}2^{2k}U^2\right). \end{aligned} \end{equation}
Using the exact scaling invariance of
 $\varphi _0(x)$
, we have
 \begin{equation} \mathcal P\left (\max _{0\leqslant a \leqslant 2^kU}{\varphi _0(a)}\,{\geqslant}\, \frac {1}{8}2^{2k}U^2\right)=\mathcal P\left (\max _{0\leqslant a \leqslant 1}{\varphi _0(a)}\,{\geqslant}\, \frac {1}{(2^kU)^H}\frac {1}{8}2^{2k}U^2\right). \end{equation}
We now exploit the following result of Piterbarg & Prisyazhnyuk (Reference Piterbarg and Prisyazhnyuk1978):
 \begin{equation} \mathcal P\left (\max _{0\leqslant a \leqslant 1}{\varphi _0(a)}\,{\geqslant}\, \mathcal{M}\right)\sim C_0\mathcal{M}^{\mathfrak{h}}\int _{\mathcal{M}}^\infty {e^{-x^2/2}\textrm{d}x}\,, \end{equation}
where
 $\mathfrak{h}=\max \{(({1})/{H}-2)\,, 0\}$
. This result provides the exact asymptotic behaviour of the probability that the maximum of the FBM, on the interval
 $[0,1]$
, exceeds the large level
 $\mathcal{M}\gt 0$
. In fact, we just need an estimate from above for the probability
 $\mathcal{P} (\max _{0\leqslant a \leqslant 1}{\varphi _0(a)}\,{\geqslant}\, \mathcal{M})$
. It follows from the relation (A4) that there exists
 $\bar {\mathcal{M}}$
such that, for all
 $\mathcal{M}\,{\geqslant}\, \bar {\mathcal{M}}$
, the following estimate holds:
 \begin{equation} \mathcal P\left (\max _{0\leqslant a \leqslant 1}{\varphi _0(a)\,{\geqslant}\, \mathcal{M}}\right)\leqslant C_1\mathcal{M}^{\mathfrak{h}}e^{-\mathcal{M}^2/4}\,, \end{equation}
where
 $C_1=3C_0\sqrt {\pi }$
. If we denote
 \begin{equation} M_k=\frac {1}{8(2^kU)^H}2^{2k}U^2=\frac {1}{8}U^{2-H}2^{(2-H)k}\,, \end{equation}
and assume that
 $U\,{\geqslant}\, {1}/{2}(8\bar {\mathcal{M}})^{1/(2-H)}$
, then, for all
 $k\,{\geqslant}\, 1$
, we have
 $M_k\,{\geqslant}\, \bar {\mathcal{M}}$
. Then, using (A1), (A2), (A3), (A5), we obtain
 \begin{equation} \langle u^2(0,1)\rangle \leqslant U^2 + C_1\sum _{k=1}^\infty {(2^kU)^2 M_k^{\mathfrak{h}}e^{-M_k^2/4}}\,. \end{equation}
It follows that the series in (A7) converges, given that the term
 $e^{-M_k^2/4}$
dominates
 $2^{2k}M_k^{\mathfrak{h}}$
. Hence, boundedness of energy at time
 $t=1$
is established. We note the existence of all positive moments of the velocity
 $u(0,1)$
follows also from Molchan (Reference Molchan1997).
Appendix B
B.1. Oblivious fractional Brownian motion
In this appendix we give the details of the construction of initial potentials that lead to large-scale multifractality in freely decaying 1-D Burgulence, which we had discussed briefly in § 2.3. First we will construct initial potentials that lead to large-scale bifractality; then we will generalise this construction to obtain an initial potential that leads to genuine large-scale multifractality.
Consider a sequence of iid intervals in the Lagrange variable
 $a$
. We assume that the length
 $l$
of the intervals has the PDF
 $p(l)$
, where
 $p(l)\sim l^{-\gamma }$
as
 $l\to \infty$
, with the tail exponent
 $\gamma \gt 1$
. We are interested in random initial potentials with stationary increments, so we must ensure that the point process, corresponding to the endpoints of the intervals, is translationally invariant. This can be achieved by the following procedure: We start with some large negative
 $a=-L$
, and then begin adding iid intervals, sampled according to the PDF
 $p(l)$
in the positive direction. In the limit
 $L\to \infty$
, the starting point
 $a=-L$
plays no role, so we obtain, in this limit, a translationally invariant point field of the endpoints of the intervals. Although the above construction is conceptually correct, it is not easy to implement numerically. Below we describe a better way to achieve our goal of constructing a translationally invariant point field of the endpoints of the intervals. It can be shown that, for a fixed non-random point, the distribution of the length of the interval containing this point is different from the PDF
 $p(l)$
. Indeed, it is more probable that long intervals contain a given point; the corresponding PDF is proportional to
 $lp(l)$
. Now, the construction of the translationally invariant point field can be described as follows. We first sample the length
 $l_0$
of the interval
 $\varDelta _0$
, containing the origin
 $a=0$
, using its PDF, which is proportional to
 $lp(l)$
. Then we sample the location of the origin uniformly within the interval of length
 $l_0$
, i.e. we choose
 $\varDelta _0=[-\varepsilon, l_0-\varepsilon]$
, where
 $\varepsilon$
is distributed uniformly in
 $[0, l_0]$
. Next, we add intervals
 $\varDelta _{-i}, \; i\gt 0$
and
 $\varDelta _i, \; i\gt 0$
to the left and to the right of
 $\varDelta _0$
. The length of each interval
 $\varDelta _i, \; i\neq 0$
is an independent random variable with the distribution given by the PDF
 $p(l)$
; this construction can be carried out only if the exponent
 $\gamma \gt 2$
; otherwise,
 $\int _0^\infty {lp(l)\textrm{d}l}=+\infty$
and a probability distribution with the PDF proportional to
 $lp(l)$
does not exist.
We now construct the initial potential
 $W(a), \, a\in \mathbb R^1$
. In each of the intervals
 $\varDelta _i, \; i \in \mathbb{Z}$
, we choose an independent realisation of a FBM with the Hurst exponent
 $H$
. Notice that these FBMs are not extended beyond
 $\varDelta _i$
. For the interval
 $\varDelta _0$
, we assume that the FBM starts at the origin; for all other
 $\varDelta _i$
, we assume that it starts at the leftmost point of
 $\varDelta _i$
for positive
 $i$
, and at the rightmost point of
 $\varDelta _i$
for negative
 $i$
. Our potential
 $W(a)$
must be continuous, so we next move the FBMs inside
 $\varDelta _{-1}$
and
 $\varDelta _1$
vertically, so that the values at the endpoints of
 $\varDelta _0$
are matched (see figure 1). We repeat this matching process for the intervals
 $\varDelta _{-i}$
and
 $\varDelta _i$
consequently for
 $i= 2, \, 3, \ldots{\kern1.5pt}$
. The process constructed above is exactly the one that we call an OFBM with the Hurst exponent
 $H$
(
 $\text{OFBM}_H$
). Notice that by construction the increments of the process
 $W(a)$
, within different intervals
 $\varDelta _i$
, are independent.
B.2. Large-scale bifractality
Case A (
 $0\lt H\lt 1/2$
). We are interested in the averages of the powers of the speed, i.e.
 $\langle |u(x,t)|^{m}\rangle$
for
 $m\gt -1$
. Consider first the contribution from the typical events, when the intervals
 $\varDelta _i$
are not anomalously long. To estimate the variance of
 $W(L)$
, as
 $|L|\to \infty$
, we note that the average length of intervals
 $\varDelta _i$
is finite because
 $\gamma \gt 2$
. Hence, the total length of the union of intervals
 $\varDelta _i, \, i\in [-n,n]$
is of the order of
 $n$
. The FBMs inside each one of the intervals
 $\varDelta _i$
are independent, so the variance
 $\langle W^2(L)\rangle$
is of the order of
 \begin{equation} \sum _{0\leqslant i \leqslant n} {|\varDelta _i|^{2H}}, \end{equation}
where
 $|L|$
and
 $n$
are of the same order. It can be shown that the PDF for
 $|\Delta |^{2H}$
is
 \begin{equation} \frac {p(l^{1/2H})l^{1/2H}}{2Hl}\,,\;\textrm{{which decays as}} \;\; \sim \frac {1}{l^{1+(\gamma -1)/2H}}, \;\;{\textrm {as}} \;\; l\to \infty \,. \end{equation}
Below we will use the following well-known asymptotic formula (see, e.g. Feller Reference Feller1991)) for sums of positive iid random variables with heavy-tailed PDFs. Let
 $\xi _i, \, i \in \mathbb{N}$
be positive iid random variables, with their PDF decaying as
 $\xi ^{-(1+\tau)}$
. Then
 \begin{equation} \sum _{1\leqslant i\leqslant n}{\xi _i}\sim \begin{cases} n^{\frac {1}{\tau }}, \ \ \text{if} \ \ \tau \lt 1\\ n\log {n}, \ \ \text{if} \ \ \tau =1\\ n, \ \ \text{if} \ \ \tau \gt 1. \end{cases} \end{equation}
Note that the condition
 $\tau \gt 1$
corresponds to the case when
 $\langle \xi \rangle$
is finite. We now use the asymptotic relation (B3), with
 $\tau = (\gamma -1)/2H$
. We are considering the case
 $0 \lt H \lt 1/2$
, so we get
 $\tau = (\gamma -1)/2H\gt 1$
, and hence
 \begin{equation} \sum _{0\leqslant i\leqslant n} {|\varDelta _i|^{2H}}\sim n\,. \end{equation}
Since the total length is also of the order
 $n$
, the relation (B4) implies that
 $\langle W^2(L)\rangle$
, namely, the variance of
 $W(L)$
, scales as
 $|L|$
as
 $|L| \to \infty$
. This relation allows us to find the asymptotic behaviour of the Lagrangian coordinate
 $a=L(t)$
, corresponding to space-time location
 $(x=0,t)$
. Note that the order of
 $L(t)$
is determined by the relation
 \begin{equation} t\,\left (\frac {L(t)}{t}\right)^2\sim \sqrt {\langle W^2(L(t))\rangle } \sim \sqrt {|L(t)|}\,, \end{equation}
from which it follows that
 \begin{equation} |L(t)| \sim t^{\frac {2}{3}}, \, \, \, |u(0,t)|=\frac {|L(t)|}{t}\sim t^{-\frac {1}{3}}\,, \end{equation}
and finally we get
 \begin{equation} |u(0,t)|^{m}\sim t^{-\frac {m}{3}}, \end{equation}
which gives the order of the contribution to
 $\langle |u(0,t)|^{m}\rangle, \, m\gt -1$
coming from the typical events mentioned above.
Next we consider the case when the interval
 $\varDelta _0$
is so long that the velocity at the origin is determined by the FBM with fixed Hurst exponent
 $H$
inside this interval. We denote by
 $q_H(u,1)$
the PDF for the velocity
 $u(0,1)$
at time
 $t=1$
. It is easy to show that
 $q_H(u,1)$
is a continuous function that tends to a positive constant as
 $u\to 0$
. This PDF decays rapidly as
 $|u| \to \infty$
, namely,
 \begin{equation} -\log {q_H(u,1)}\sim \frac {1}{4}|u|^{4-2H}\,. \end{equation}
The above relation also follows from Molchan (Reference Molchan1997). To see why (B8) holds, we again use the variational principle (2.4). Let
 $u$
be a large positive velocity. If we denote by
 $P_\epsilon (u)$
the probability that
 $(1-\epsilon)u\leqslant \,u(0,1)\leqslant \,(1+\epsilon)u$
, then
 \begin{equation} P_\epsilon (u)\leqslant \mathcal P\left (\max _{0\leqslant a \leqslant (1+\epsilon)u}{\varphi _0(a)}\,{\geqslant}\, \frac {(1-\epsilon)^2u^2}{2}\right)\,. \end{equation}
In fact, it is easy to see that
 $P_\epsilon (u)$
and
 $\mathcal P (\max _{0\leqslant a \leqslant (1+\epsilon)u}{\varphi _0(a)}\,{\geqslant}\, ({(1-\epsilon)^2u^2})/{2})$
are of the same order. From the scaling invariance of
 $W(a)$
, within the interval
 $\varDelta _0$
, we obtain
 \begin{equation} \mathcal P\left (\max _{0\leqslant a \leqslant (1+\epsilon)u}{\varphi _0(a)}\,{\geqslant}\, \frac {(1-\epsilon)^2u^2}{2}\right)=\mathcal P\left (\max _{0\leqslant a \leqslant 1}{\varphi _0(a)}\,{\geqslant}\, \frac {1}{2}\frac {(1-\epsilon)^2u^2}{((1+\epsilon)u)^H}\right)\,. \end{equation}
Using the asymptotic relation (A4) we get
 \begin{equation} - \log {P_\epsilon (u)}\sim \frac {(1-\epsilon)^4}{4(1+\epsilon)^{2H}}u^{4-2H}\,, \end{equation}
and thence, in the limit
 $\epsilon \to 0$
, we obtain (B8). The case of large negative values of
 $u(0,1)$
can be considered in a similar way.
We now use the exact scaling relation
 \begin{equation} u(x,t)=u(x,1)t^{-\alpha (H)}\,,\;\; {\textrm {where}}\;\; \alpha (H)= (1-H)/(2-H)\,, \end{equation}
which should be understood in the distributional sense that is, having the same probabilistic law in the sense used in (2.7) and (2.15) for conventional FBM to get the following expression for the PDF of the velocity field
 $u(0,t)$
at time
 $t$
:
 \begin{equation} q_H(u,t)=t^{\alpha (H)}q(ut^{\alpha (H)},1). \end{equation}
Here, the distributional sense is the same as used in (2.7) and (2.15) for conventional FBM. It follows that
 \begin{equation} \langle |u(0,t)|^{m}\rangle =\int _{-\infty }^{\infty }{|u|^{m}q_H(u,t)\textrm{d}u}=t^{-\alpha (H)m}\int _{-\infty }^{\infty }{|u|^{m}q(u,1)\textrm{d}u}, \end{equation}
which, in particular, implies that the moments
 $\langle |u(0,t)|^{m}\rangle$
are finite for
 $-1\lt m$
. Also, since the speed
 $|u(0,t)|$
scales like
 $t^{-\alpha (H)}$
, we have
 \begin{equation} |L(t)|\sim t^{1-\alpha (H)}=t^{1/(2-H)}\,. \end{equation}
If
 $|\varDelta _0|$
is much larger than
 $|L(t)|$
, then, with large probability,
 $L(t)$
will be inside
 $\varDelta _0$
. It is easy to see that, in this case, the speed
 $|u(0,t)|$
will, indeed, scale like
 $t^{-\alpha (H)}$
. To estimate the probability of such an event we note that the PDF of the length of
 $\varDelta _0$
is given by
 $p_0(l)={1}/{M}lp(l)$
, where
 $M=\int _0^{\infty }lp(l)\textrm{d}l$
. Thus, we have
 \begin{equation} \mathcal{P}\big(|\varDelta _0|\gt t^{\frac {1}{2-H}}\big) =\frac {1}{M}\int _{t^{\frac {1}{2-H}}}^\infty {lp(l)\textrm{d}l}\sim \frac {\gamma -2}{M}\frac {1}{t^{\frac {\gamma -2}{2-H}}}\,. \end{equation}
Hence it follows that the contribution to
 $\langle |u(0,t)|^{m}\rangle$
, coming from such an event with a long interval
 $\varDelta _0$
, is
 \begin{equation} |u(0,t)|^{m}\sim t^{-\alpha (H)m-(\gamma -2)/(2-H)}\,. \end{equation}
In order to establish multifractality, we are interested in the behaviour of the scaling exponent
 $s(m)$
that is defined by the scaling relation
 \begin{equation} \langle |u(0,t)|^{m}\rangle \sim t^{s(m)}\,. \end{equation}
From the (B7) and (B17), we conclude that
 \begin{equation} s(m)\,{\geqslant}\, \max {\left[\left\{-\frac {m}{3}\right\}\,, \, \{-\alpha (H)m-(\gamma -2)/(2-H)\}\right]}\,. \end{equation}
Note that
 $\alpha (H)-(\gamma -2)/(2-H)\gt 1/3$
, for the tail exponent in
 $2\lt \gamma \lt 2+ {1-2H}/{3}$
, so we can use (B12) to show that
 $s(m)$
is not a linear function of
 $m$
. In summary, this result is obtained as follows: (a) typical events provide the dominant contribution in the case of small
 $|m|$
, so we conclude that the scaling exponent
 $s(m)$
behaves as
 $-{m}/{3}$
in the limit when
 $m\to 0$
; (b) by contrast, the rare events (see (B14) and (B16)) lead to the contribution
 $t^{-\alpha (H)m-(\gamma -2)/(2-H)}$
, so
 $s(m)\,{\geqslant}\, \,-\alpha (H)m-(\gamma -2)/(2-H)$
. Hence, for such values of
 $\gamma$
and for
 $m$
close enough to
 $-1$
, we have
 $s(m)\gt -{m}/{3}$
. It follows that
 $s(m)$
is not a linear function which is a manifestation of the bifractal nature of
 $\langle |u(0,t)|^{m}\rangle \sim t^{s(m)}$
for large
 $t$
. The terms
 $-{m}/{3}$
and
 $-\alpha (H)m-(\gamma -2)/(2-H)$
provide the dominant contributions in the whole range of the scaling exponent
 $m\gt -1$
, so
 $s(m)=max \, {\{-{m}/{3}, \, -\alpha (H)m-(\gamma -2)/(2-H)\}}$
. Hence, for
 $2\lt \gamma \lt 2+ ({1-2H})/{3}$
we have
 \begin{align} s(m)&=-m/3\quad { \textrm{for}}\, \;\; m\,{\geqslant}\, m_A(H,\gamma)\equiv -\frac {3(\gamma -2)}{1-2H};\nonumber \\ s(m)&=-\alpha (H)m-\gamma -2/2-H \quad { \textrm{for}}\, -1\lt m\lt m_A(H,\gamma)\,. \end{align}
This is an example of bifractal scaling, because
 $s(m)$
is a piecewise linear function of
 $m$
; later we will show how to generalise the OFBM
 $_H$
, by introducing a range of Hurst exponents
 $H$
, to obtain genuine multifractality.
Case B (
 $1/2\lt H\lt 1,\; \tau = (\gamma -1)/2H \gt 1$
). Our construction and analysis in the second case, with
 $1/2\lt H\lt 1$
, is very similar to our discussion for case A above. Again, we consider
 $\text{OFBM}_H$
and assume that
 $\gamma \gt 2$
and
 $\tau =(\gamma -1)/2H\gt 1$
; this inequality is satisfied if
 $\gamma \gt 1+2H$
. Since
 $\tau \gt 1$
, all asymptotic behaviours in the main probability event remain the same as in case A, so
 $|u(0,t)|$
scales as
 $t^{-1/3}$
. Our estimates in the case of a long
 $\varDelta _0$
are also unchanged. The speed
 $|u(0,t)|$
scales as
 $t^{-\alpha (H)}$
if
 $|\varDelta _0|\sim t^{1/(2-H)}$
. Hence, the contribution to
 $s(m)$
remains the same as in case A, namely,
 $-{m}/{3}$
and
 $-\alpha (H)m-(\gamma -2)/(2-H)$
. The only difference is that we now have
 $1/2\lt H\lt 1$
, so
 $\alpha (H)\lt 1/3$
. It follows that, in the case of long
 $\varDelta _0$
, the speed
 $|u(0,t)|$
is larger than in the main probability event. Hence, there exists
 $m_B(H,\gamma)\gt 0$
such that
 $s(m)=-\alpha (H)m-(\gamma -2)/(2-H)$
gives the dominant contribution for
 $m\gt m_B(H, \gamma)$
, while the term
 $-{m}/{3}$
dominates for
 $-1\lt m \leqslant m_B$
. An easy calculation gives
 $m_B(h,\gamma)={3(\gamma -2)}/{2H-1}$
; and since
 $\gamma \gt 1+2H$
, we have
 $m_B(h,\gamma)\gt 3$
. Finally, we get
 \begin{align} s(m)&=-m/3, \quad {\textrm{for}}\; -1 \lt m \leqslant m_B(H, \gamma) ;\nonumber \\ s(m)&=-\alpha (H)m-(\gamma -2)/(2-H), \quad {\textrm{for}}\; m \gt m_B(H, \gamma). \end{align}
Again, this is an example of bifractal scaling.
Case C (
 $1/(2\lt H\lt 1);\; \tau = (\gamma -1)/(2H \lt 1)$
). In case B above, we assumed
 $1/2\lt H\lt 1$
and
 $\tau \gt 1$
. Let us now consider the last possible case when
 $1/2\lt H\lt 1$
and
 $\tau \lt 1$
, so
 $2\lt \gamma \lt 1+2H$
. Our analysis in the case of a long interval
 $\varDelta _0$
remains unchanged; again, the contribution to
 $s(m)$
remains
 $-\alpha (H)m-(\gamma -2)/(2-H)$
. However, the asymptotic analysis for the main probability event is different. Since
 $\sum _{i=1}^n{|\varDelta _i|^{2H}}\sim n^{1/\tau }$
and
 $L(t)\sim \sum _{i=1}^n{|\varDelta _i|}\sim n$
, we have
 \begin{equation} t\left (\frac {L(t)}{t}\right)^2\sim \sqrt {\langle W^2(L(t))\rangle } \sim \sqrt {n^{\frac {1}{\tau }}} \sim L(t)^{\frac {1}{2\tau }}\,. \end{equation}
It follows that
 \begin{equation} |L(t)| \sim t^{\frac {2\tau }{4\tau -1}}=t^{\frac {\gamma -1}{2\gamma -2-H}}, \, \, \, |u(0,t)|=\frac {|L(t)|}{t}\sim t^{-\frac {\gamma -1-H}{2\gamma -2-H}}. \end{equation}
We finally get that the contribution to
 $s(m)$
is equal to
 $-m ({\gamma -1-H})/({2\gamma -2-H}).$
We compare the two contributions
 $-\alpha (H)m-(\gamma -2)/(2-H)$
and
 $-m ({\gamma -1-H})/({2\gamma -2-H})$
; then a simple calculation gives the following expression for the threshold
 $m_C(H,\gamma)$
:
 \begin{equation} m_C(H,\gamma)=\frac {2\gamma -2-H}{H}. \end{equation}
Hence,
 $s(m)=-m ({\gamma -1-H})/({2\gamma -2-H})$
, for
 $-1\lt m\leqslant m_C(H,\gamma)$
; and
 $s(m)=-\alpha (H)m-(\gamma -2)/(2-H)$
, for
 $m\gt m_C(H,\gamma)$
.
In summary, we obtain bifractal behaviour with
 \begin{align} s(m)&=-m \frac {\gamma -1-H}{2\gamma -2-H},\quad {\textrm{for}}\; -1 \lt m \leqslant m_C(H, \gamma) \,;\nonumber \\ s(m)&=-\alpha (H)m-\gamma -2/2-H,\quad { \textrm{for}}\; m \gt m_C(H, \gamma)\,. \end{align}
Note that the energy corresponds to the exponent
 $m=2$
. For this value of
 $m$
, in the first two cases considered above, the dominant contribution to
 $s(m)$
comes from the term
 $-{m}/{3}$
. Hence, the energy decays as
 $t^{-2/3}$
. The threshold
 $m_C(H,\gamma)$
is
 \begin{align} m_C(H,\gamma)&\leqslant 2 \;\; { \textrm{in}}\, \;\; C_1\equiv \{(H,\gamma): 2/3\lt H\lt 1,\;\; 2\lt \gamma \leqslant 3H/2 +1\}\,;\nonumber \\ m_C(H,\gamma) &\gt 2 \;\; {\textrm{in}}\, \;\; C_2 \equiv \{(H,\gamma): 1/2\lt H\lt 1, \; \max \, {\{2, 3H/2+1\}}\lt \gamma \lt 1+2H\}. \end{align}
The areas
 $C_1$
and
 $C_2 = C\setminus C_1$
are shown in figure 2 in § 2.3. Therefore, the energy decays as follows:
 \begin{align} E(t)&\sim t^{-(\gamma -2H)/(2-H)},\quad {\textrm {for}}\; (H,\gamma) \in C_1; \end{align}
 \begin{align} E(t)&\sim t^{-(1-H/(2\gamma -2-H))},\quad {\textrm {for}}\; (H,\gamma) \in C_2. \end{align}
The exponent
 $(\gamma -2H)/(2-H)\leqslant 1/2$
, when
 $(H,\gamma) \in C_1$
, whereas, if
 $(H,\gamma) \in C_2$
, the exponent
 $1/2\lt 1-H/(2\gamma -2-H)\lt 2/3$
. Note that in all three cases there is also a subdominant contribution to
 $E(t)$
with a faster decay in the limit
 $t\to \infty$
.
B.3. Large-scale multifractality
B.3.1. Genuine large-scale multifractality
In all three cases A, B and C considered above, the exponent
 $s(m)$
consists of two different pieces that are linear in
 $m$
, so we have bifractal scaling. We now generalise the OFBM
 $_H$
, which we used in cases A–C above, to build an initial condition that leads to genuine large-scale multifractality. The crucial idea is to choose the Hurst exponent
 $H$
in OFBM
 $_H$
from a PDF for
 $H$
and use an
 $H$
-dependent tail exponent
 $\gamma =\gamma (H)$
. More precisely, we first sample the Hurst exponent
 $H$
and choose the parameter
 $\gamma =\gamma (H)$
. Then, we sample intervals
 $\varDelta _i, \, i\in \mathbb{Z}$
using the exponent
 $\gamma$
, and finally generate the OFBM
 $_H$
process
 $W(a)$
. Notice that, by construction, we use the same Hurst exponent
 $H$
for all intervals
 $\varDelta _i, \, i\in \mathbb{Z}$
. Hence, the analysis presented above remains valid. Below, we provide the details for case B.
We proceed as in case B above, by choosing
 $H_0$
,
 $\gamma _0$
and
 $m_0$
with
 $1/2\lt H_0\lt 1$
,
 $\gamma _0\gt (1+2H_0), \; {\textrm{and} \, }\; m_0 \gt m_B(H_0,\gamma _0)$
. We then sample
 $H$
uniformly from the interval
 $[H_0-\epsilon,H_0+\epsilon]$
, where
 $\epsilon$
is small and positive. We also use the tail exponent
 $\gamma =\gamma (H)$
and set
 $\gamma (H_0)=\gamma _0$
. The exact dependence of
 $\gamma$
on
 $H$
will be specified below. Given the continuity of
 $m_B(H,\gamma)$
, we can say that, for some small
 $\delta \gt 0$
, which depends on
 $\epsilon$
, the whole interval
 $[m_0-\delta, m_0+\delta]$
will be above the threshold
 $m_B(H,\gamma (H))$
, for all
 $H\in [H_0-\epsilon,H_0+\epsilon]$
. Then, for all
 $m\in [m_0-\delta, m_0+\delta]$
, we have
 \begin{equation} s(m)=\max _{H\in [H_0-\epsilon,H_0+\epsilon] }{s_{H,\gamma (H)}(m)}= \max _{H\in [H_0-\epsilon,H_0+\epsilon] }\left \{-\alpha (H)m-\frac {\gamma (H)-2}{2-H}\right \}\,. \end{equation}
We now choose
 $\gamma (H)$
in such a way that, for
 $m=m_0$
, the maximum in the above expression is attained at
 $H=H_0$
. Namely, we require that
 \begin{equation} \frac {\textrm{d}}{\textrm{d}H}\left [-\alpha (H)m_0-\frac {\gamma (H)-2}{2-H}\right](H_0)=0\,;\; \, \frac {\textrm{d}^2}{\textrm{d}H^2}\left [-\alpha (H)m_0-\frac {\gamma (H)-2}{2-H}\right](H_0)\lt 0\,. \end{equation}
An easy calculation shows that the first condition is satisfied if
 \begin{equation} \frac {\textrm{d}\gamma }{\textrm{d}H}(H_0)=\frac {m_0-\gamma _0+2}{2-H_0}\,. \end{equation}
The second condition requires that
 \begin{equation} \frac {\textrm{d}^2\gamma }{\textrm{d}H^2}(H_0)\gt 0. \end{equation}
We can now set
 \begin{equation} \gamma (H)=\gamma _0 + \frac {m_0-\gamma _0+2}{2-H_0}(H-H_0) + A (H-H_0)^2, \end{equation}
where
 $A\gt 0$
is an arbitrary positive constant. To find
 $s(m)$
for
 $m\in [m_0-\delta,m_0+\delta]$
, we have to find
 $H(m)$
by solving a quadratic equation
 \begin{equation} \frac {\textrm{d}\gamma }{\textrm{d}H}(H)= \frac {m_0-\gamma _0+2}{2-H_0} + 2A(H-H_0)=\frac {m-\gamma (H) +2}{2-H}\,, \end{equation}
then find
 $\gamma (m)=\gamma (H(m))$
, and, finally, substitute
 $H=H(m), \, \gamma =\gamma (m)$
into the expression
 $s(m)= -({1-H})/({2-H})m- ({\gamma -2})/({2-H})$
.
If we use, as an example, the values
 $H_0=3/4, \, \gamma _0=3, \, m_0=7$
, we can proceed as follows. We first choose
 $\epsilon =1/4$
, which means that the Hurst exponent
 $H$
is sampled within a maximum possible interval
 $1/2\lt H\lt 1$
. We shall use the suggested expression (B33) and choose
 $A=16$
. After substituting the values
 $H_0=3/4, \, \gamma _0=3, \, m_0=7, A=16$
, we get
 $\gamma (H)=3+6(4H-3)/5 + (4H-3)^2$
. Note that this choice of
 $\gamma (H)$
corresponds to area
 $B$
for all
 $1/2\lt H\lt 1$
(see figure 2 in § 2.3). Differentiating
 $s(m;H)= -(1-H)/(2-H)m- (\gamma (H)-2)/(2-H)$
with respect to
 $H$
, we get that
 $\textrm{d}s(m;H)/\textrm{d}H$
vanishes only if
 $H$
satisfies the following condition:
 \begin{equation} m= \frac {\textrm{d}\gamma }{\textrm{d}H}(H)(2-H) + \gamma (H) -2\,. \end{equation}
Substituting
 $\gamma (H)=3+6(4H-3)/5 + (4H-3)^2$
in (B35), we get the quadratic equation
 $H^2-4H+({32+m})/{16}=0$
with two solutions
 $H=2\pm \sqrt {32-m}/4$
. Since we are interested in the interval
 $H\in (1/2, 1)$
, only the solution
 $H_{-}=2 - \sqrt {32-m}/4$
is of interest to us. We can check that
 $1/2\lt H_{-}\lt 1$
for
 $-4\lt m\lt 16$
. Given that
 $\textrm{d}s(m;H)/\textrm{d}H\gt 0$
for
 $1/2\lt H\lt H_{-}$
and
 $\textrm{d}s(m;H)/\textrm{d}H\lt 0$
for
 $H_{-}\lt H\lt 1$
, we get
 $\max _{H\in [1/2,1]}s(m;H)= s(m; H_{-})$
, when
 $-4\lt m\lt 16$
. In the case
 $m\,{\geqslant}\, 16$
, the maximum of
 $s(m;H)$
, over the interval
 $H\in [1/2, 1]$
, is attained at
 $H=1$
. Note that we only consider the case when
 $m\gt -1$
; otherwise, the average speed raised to the power
 $m$
diverges. Substituting
 $H_{-}=2 - \sqrt {32-m}/4$
, we get the following result for a contribution to
 $s(m)$
coming from long intervals
 $\varDelta _0$
:
 \begin{equation} s(m)=\frac {224}{5}-m -8\sqrt {32-m}, \, m\in (-1,16) \quad {\text{and}} \quad s(m)=-\frac {16}{5}, \, m \,{\geqslant}\, 16\,. \end{equation}
We also have to take into account a contribution
 $-m/3$
coming from the main probability event. It can be shown that the term
 $-m/3$
is the dominant one for
 $-1\lt m\lt 24 (\sqrt {5}-1)/5$
. This leads to the following final answer for
 $s(m)$
(see figure 3 in § 2.3):
 \begin{equation} s(m)=\begin{cases} -\dfrac {m}{3}, & \, -1\lt m\leqslant \dfrac {24(\sqrt {5}-1)}{5} \\ \dfrac {224}{5}-m -8\sqrt {32-m}, & \, \dfrac {24(\sqrt {5}-1)}{5}\lt m\lt 16 \\ -\dfrac {16}{5}, &\, m\,{\geqslant}\, 16. \end{cases} \end{equation}
Clearly, (B37) implies genuine multifractality because
 $s(m)$
has truly nonlinear dependence on
 $m$
, and it is not just a combination of different linear functions of
 $m$
(as, e.g. in (B20)).
Appendix C
C.1. Energy decay in 1-D Burgulence with multifractal initial data
C.1.1. Initial data for the velocity: MRW with
$H=0.5$

We considered freely decaying turbulence in the 1-D inviscid Burgers equation (2.1), with the MRW initial condition obtained using (3.2)–(3.6) with
 $H=1/2$
for the initial potential
 $\varphi _0$
(cf. type A initial data in She et al. Reference She, Aurell and Frisch1992). We now consider such decay with MRWs for the initial velocity (cf. type B initial data in She et al. Reference She, Aurell and Frisch1992). In our numerical studies, which use (2.4) and (3.1), we discretise the system with
 $N=2^{14}$
points.
In figure 10(a) we show log–log plots of the energy spectrum
 $E(k,t)$
versus the wavenumber
 $k$
at different representative times
 $t$
; at early times
 $0 \leqslant t \lesssim 10^{-5}$
, this spectrum is not of a simple, power-law form because of the multifractal initial condition for the velocity; however, for
 $10^{-4.5} \lesssim t$
, the spectrum has the power-law form
 $E(k,t) \sim k^{-2}$
because of the formation of shocks. The decay of the total energy
 $E(t)$
is shown in the log–log plot of figure 10(b); the temporal decay does not have a single-exponent, power-law form for
 $0 \leqslant t \lesssim 1$
; however, at later times, it shows the power-law decay
 $E(t) \sim t^{-2}$
, once the integral length scale becomes comparable to the system size. We compute the order-
 $p$
velocity structure functions
 $S_p(\ell,t) \equiv [u(x+\ell,t) - u(x,t)]^p$
and plot it versus the separation
 $\ell$
(see the log–log plot in figure 10
c); we obtain the multiscaling exponents
 $\zeta _p$
, which follow from the power-law form
 $S_p(\ell,t) \sim \ell ^{\zeta _p}$
for
 $\ell$
in the pink-shaded region in figure 10(c). We use a local-slope analysis (figure 10
d) to extract these exponents, which we plot versus the order
 $p$
in figure 10
e at
 $t=0$
(red curve) and
 $t=10^{-3}$
(blue curve). We observe that multifractality is present at
 $t=10^{-3}$
(see figure 10), insofar as
 $\zeta _p$
is a nonlinear function of
 $p$
.
Log–log plots of (a) the energy spectrum
 $E(k,t)$
versus the wavenumber
 $k$
, at some representative values of
 $t$
(the inset shows the initial spectrum
 $E(k,0)$
in detail in the wavenumber range
 $5\times 10^2\leqslant k\leqslant 6 \times 10^2$
) and (b) the scaled total energy
 $E(t)/E(t=0)$
versus the time
 $t$
for the multifractal initial condition (3.2)–(3.6), for the velocity, with Hurst exponent
 $H=1/2$
; the inset shows a plot of the local slope. We compute structure functions in figure 11 at the point in time that lies at the centre of the interval indicated by the blue vertical lines.

Plots for the multifractal initial condition, for the velocity, with Hurst exponent
 $H=1/2$
at
 $t=10^{-3}$
: (a) log–log plots versus
 $\ell$
of the structure functions of order
 $p=1, \ldots, 5$
. (b) Plots of
 $\zeta _p^{loc}$
, obtained from local slopes of the structure functions in (a), versus
 $\ell$
. (c) Plots of
 $\zeta _p$
versus
 $p$
(in blue) at
 $t=10^{-3}$
; the red curves show
 $\zeta _p$
(in red) for the multifractal random walk of 3).

Log–log plots of (a) the energy spectrum
 $E(k,t)$
versus the wavenumber
 $k$
, at some representative values of
 $t$
(the inset shows the initial spectrum
 $E(k,0)$
in detail in the wavenumber range
 $5\times 10^2\leqslant k\leqslant 6 \times 10^2$
) and (b) the scaled total energy
 $E(t)/E(t=0)$
versus the time
 $t$
for the multifractal initial condition ((3.2)–(3.6)), for the potential
 $\varphi _0$
, with Hurst exponent
 $H=0.75$
; the inset shows a plot of the local slope. We compute structure functions in figure 13 at the point in time that lies at the centre of the interval indicated by the blue vertical lines.

Plots for the multifractal initial condition, for the potential
 $\varphi _0$
, with Hurst exponent
 $H=0.75$
at
 $t=10^{-5}$
: (a) log–log plots versus
 $\ell$
of the structure functions of order
 $p=1, \ldots, 5$
. (b) Plots of
 $\zeta _p^{loc}$
, obtained from local slopes of the structure functions in (a), versus
 $\ell$
. (c) Plots of
 $\zeta _p$
versus
 $p$
(in blue) at
 $t=10^{-5}$
.

Log–log plots of (a) the energy spectrum
 $E(k,t)$
versus the wavenumber
 $k$
, at some representative values of
 $t$
, and (b) the scaled total energy
 $E(t)/E(t=0)$
versus the time
 $t$
for the multifractal initial condition ((3.2)–(3.6)), for the velocity, with Hurst exponent
 $H=0.75$
; the inset shows a plot of the local slope. We compute structure functions in figure 15 at the point in time that lies at the centre of the interval indicated by the blue vertical lines.

Plots for the multifractal initial condition, for the velocity, with Hurst exponent
 $H=0.75$
at
 $t=10^{-4}$
: (a) log–log plots versus
 $\ell$
of the structure functions of order
 $p=1, \ldots, 5$
. (b) Plots of
 $\zeta _p^{loc}$
, obtained from local slopes of the structure functions in (a), versus
 $\ell$
. (c) Plots of
 $\zeta _p$
versus
 $p$
(in blue) at
 $t=10^{-4}$
; the red curves show
 $\zeta _p$
(in red) for the multifractal random walk of 3.

C.1.2. Initial data for the potential and velocity: MRW with
$H=0.75$

In addition, we consider multifractal initial conditions, with
 $\tilde {B}_n$
, increments in the (periodised) FBMs with Hurst exponent
 $H=0.75$
, to construct the following sequence of random numbers:
 \begin{equation} \tilde {A}_n = \tilde {B}_n e^{\Omega _n}, \quad 1 \leqslant n \leqslant N. \end{equation}
Then we consider the sequence
 \begin{equation} \tilde {A}^{\prime}_n = \tilde {A}_n - \frac {1}{N}\sum _{i=1}^{N} \tilde {A}_i\,, \end{equation}
from which we obtain a multifractal random walk using
 $A^{\prime}_n$
as follows:
 \begin{equation} \tilde {M}_n = \begin{cases} 0, & \quad n=1 \\ \sum _{i=1}^{n-1} \tilde {A}^{\prime}_i, & \quad n \gt 1. \end{cases} \end{equation}
For the multifractal initial condition for the potential
 $\varphi _0$
, with Hurst exponent
 $H=0.75$
, we present plots for energy spectra, energy decay, structure functions and exponents in figures 12 and 13. For the multifractal initial condition for the velocity, with Hurst exponent
 $H=0.75$
, we present plots for energy spectra, energy decay, structure functions and exponents in figures 14 and 15.
C.2. Energy decay in 1-D Burgulence with power-law initial energy spectra and connections to the Gurbatov effect
We begin with some well-known results (see, e.g. Gurbatov et al. Reference Gurbatov, Simdyankin, Aurell, Frisch and Tóth1997) for the case when the initial (average) energy spectrum
 $E_{0}(k)$
is
 \begin{equation} E_{0}(k) = \big \langle \big | \widetilde {u}_{k}(0) \big |^{2} \big \rangle = A \, \mathcal{E}(k) \, \exp \! \left [ - 2 k^{2}/k^{2}_{c} \right], \end{equation}
where
 $\left \langle \boldsymbol\cdot \right \rangle$
is the average over realisations. The energy spectrum
 $E(k,t)$
at time
 $t$
is defined as
 \begin{equation} E(k,t):= \big \langle \big | \widetilde {u}_{k}(t) \big |^{2} \big \rangle. \end{equation}
Furthermore, we define the (average) energy
 \begin{equation} E(t):= \left \langle \int _{ - \infty }^{ \infty } \text{d} k \left | \widetilde {u}_{k}(t) \right |^{2} \right \rangle, \end{equation}
and the integral length scale
 \begin{equation} L(t):= \frac {1}{E(t)}\displaystyle \left \langle \int _{-\infty }^{\infty } \text{d} k \, k^{-1} \left | \widetilde {u}_{k}(t) \right |^{2} \right \rangle. \end{equation}
The single-power-law case
 \begin{equation} \mathcal{E}(k) = |k|^{n} \,, \end{equation}
where the exponent
 $n$
satisfies
 $-1 \lt n \lt 2$
, was studied by Gurbatov et al. (Reference Gurbatov, Simdyankin, Aurell, Frisch and Tóth1997) in detail. We recall here that, for
 $-1 \lt n \lt 1$
, the energy decay is self-similar with
 \begin{equation} E(t) \propto t^{ e_{E}}, \quad \text{where}\; e_{E} = \displaystyle \frac {- 2 (n +1)}{n+3} \,. \end{equation}
The integral length scale
 $L(t)$
increases with time as
 \begin{equation} L(t) \propto t^{e_{I}}, \quad \text{where} \; e_{I} = \displaystyle \frac {2}{n+3} \,. \end{equation}
For
 $1 \lt n \lt 2$
, we encounter the Gurbatov phenomenon, namely,
 $E(k,t) \gt E_0(k)$
for wavenumbers
 $k \leqslant K(t) \sim 1/L(t)$
. This leads to non-self-similar decay (growth) of the total energy (integral length scale) because of the following logarithmic corrections (see Gurbatov et al. Reference Gurbatov, Simdyankin, Aurell, Frisch and Tóth1997 and Roy Reference Roy2021):
 \begin{align} E(t) &\sim t^{-1}\sigma _\psi \ln ^{-1/2}(t/t_{nl})\,; \;\; L(t) \sim t^{1/2} \sigma _\psi ^{1/2}\ln ^{-1/4}(t/t_{nl})\,.\nonumber \\ {\textrm {Here,}}\;\;\sigma _\psi ^2 &\equiv \left\langle \int _{-\infty }^{\infty } \textrm{d}k k^{-2} |\tilde {u}_k(0)|^2\right\rangle; \;\; t_{nl} \equiv \frac {\sigma _\psi }{\int _{-\infty }^\infty \textrm{d}k E_0(k)}\,. \end{align}
If we use a single sharp peak in the initial energy spectrum
 $E_0(k)$
, with the passage of time
 $t$
, the spectrum
 $E(k,t)$
develops a
 $k^2$
part at small
 $k$
and a
 $k^{-2}$
part at large
 $k$
(see figure 8.2 in Roy Reference Roy2021), the former because of Proudman–Reid-type beating interactions (discussed for 3-D NS turbulence in § 4) and the latter because of the development of shocks. The total energy
 $E(t)$
shows the power–law decay
 $\sim t^{-1}$
at intermediate times (by analogy with the single-power-law case discussed above), because of the
 $k^2$
part in
 $E(k,t)$
; this crosses over to a decay of the form
 $\sim t^{-2}$
at large times, when the integral length scale, which grows with
 $t$
, becomes comparable to the system size.
C.3. Initial data with energy spectra that have two-power-law spectral ranges
In § 3.3.1 we presented results where
 $E_0(k)$
has two power-law spectral ranges are present in the initial spectrum (see (3.8) and (3.9) in § 3.3.1). Here, we consider three more such cases with different combinations of power laws for the two spectral ranges. We recall that the general form for a composite two-range initial spectrum is written in terms of the power laws
 $\mathcal{E}_1(k)$
and
 $\mathcal{E}_2(k)$
with exponents
 $n_1$
and
 $n_2$
, respectively (see (3.8) and (3.9) in § 3.3.1). We consider the following three cases by considering different values for the exponents
 $n_1$
and
 $n_2$
:
-
(a) Case Ib:
$n_1 = 0.25, n_2 = 0.75$
. -
(b) Case Ic:
$n_1 = 1.50, n_2 = 0.5$
. -
(c) Case Id:
$n_1 = 1.25, n_2 = 1.75$
.


We describe our results for these cases below.
Log–log plots for (a) the energy spectrum
 $E(k,t)$
versus the wavenumber
 $k$
at representative times
 $t$
, (b) the decay of the total energy
 $E(t)$
with time
 $t$
and (c) the growth of integral length scale
 $L(t)$
with time
 $t$
for case Ib, with a two-power-law initial energy spectrum (see § 3.3.2 where figure 6 gives the analogous plots for case Ia); the insets show local slopes that can be used to estimate the decay and growth exponents in (b) and (c), respectively. (d)–(f) are the counterparts of (a)–(c) for case Ic; (g)–(i) are the counterparts of (a)–(c) for case Id.

Case Ib: as in case Ia (§ 3.3.1), there is exactly one peak at
 $k_{p}(t)$
. Depending on
 $k_{p}(t)$
, the spectrum has different behaviours as observed in figure 16(a). When
 $k_{1} \lt k_{p}(t) \lt k^{2}_{1}$
,
 $E(k,t)$
is the same as
 $E_{0}(k)$
for some
 $k^{\prime}$
with
 $k\lt k^{\prime} \lt k_{1}$
; also, there is a spectral interval
 $k^{\prime\prime} \lt k \lt k^{\prime\prime\prime}$
with
 $k^{\prime}\lt k^{\prime\prime}$
and
 $k^{\prime\prime\prime}\lt k_{p}(t)$
, where
 $E(k,t) \sim k^{2}$
with
 $E(k,t)\gt E_{0}(k)$
. A continuous curve bridges these two spectral regions. This is reminiscent of the Gurbatov phenomenon discussed in Gurbatov et al. (Reference Gurbatov, Simdyankin, Aurell, Frisch and Tóth1997). When
 $k_{p}(t)\lt k_{1}$
, i.e. in the low-wavenumber region, the peak height diminishes with time until the second spectral range, where the spectrum was proportional to
 $k^{2}$
, vanishes. Eventually, the spectrum becomes such that
 $E(k,t) \leqslant E_{0}(k)$
for all
 $k$
. Thus the memory of the initial spectral range with
 $n_{2} =1.5$
lingers in the system for a long time.
The decay of
 $E(t)$
shows two main regimes. In our DNS, the first regime occurs approximately for
 $t \in [10^{-8}, 10^{-3}]$
, whereas the second regime is seen for
 $ 10^{0} \lesssim t \lesssim 10^{3}$
. Although we observe
 $E(t) \sim t^{-1}$
in the first regime, the power-law decay in the second regime is not very clear. Only towards the end of the second regime do we observe that
 $E(t)\sim t^{ - 0.9}$
(see the inset in figure 16
b). The exponents for the growth of
 $L(t)$
are not clear (see figure 16
c).
Case Ic: there is a single peak at
 $k_{p}(t)$
in the spectrum just as in the case Ib. Again the decay of
 $E(t)$
shows two power-law regimes. However, this case appears to be simpler than case IIb as we can see by comparing in the plots of
 $E(k,t)$
in figures 16(a) and 16(d). When
 $k^{\prime}\lt k_{p}(t) \lt k^{\prime\prime}$
the decay is exactly like the single-power-law case with
 $n = 0.5$
. The exponent for the decay of
 $E(t)$
is
 $\simeq -0.9$
. But, for
 $ k_{p}(t) \lt k^{\prime}$
, we observe the Gurbatov phenomenon, i.e. the behaviour resembles the single-power-law case with
 $n = 1.5$
(see figures 16
e and f).
Case Id: the evolution of
 $E(k,t)$
exhibits the Gurbatov phenomenon (figure 16
g). The decay forms for
 $E(t)$
and the growth of for
 $L(t)$
are similar to their counterparts for a single-power initial spectrum
 $E_0(k) \sim k^n$
for
 $1\lt n\lt 2$
(see Gurbatov et al. Reference Gurbatov, Simdyankin, Aurell, Frisch and Tóth1997). The exponents for the decay of the energy decay and the growth of the integral length scale are roughly
 $-1.0$
and
 $0.5$
(figures 16
h and 16
i), but they should have logarithmic corrections (as discussed in Gurbatov et al. Reference Gurbatov, Simdyankin, Aurell, Frisch and Tóth1997).
C.4. Initial data with energy spectra that have four-power-law spectral ranges
In § 3.3.2 we presented results for
 $E_0(k)$
with four power-law spectral ranges (see (3.11) in § 3.3.2 for case IIa). The exponents
 $n_i$
in (3.11) are
 $n_1=n_3 = 1.5, n_2 = n_4 = -1.5$
in case IIb. We describe our main observations for this case below.
Log–log plots for (a) the energy spectrum
 $E(k,t)$
versus the wavenumber
 $k$
at representative times
 $t$
, (b) the decay of the total energy
 $E(t)$
with time
 $t$
and (c) the growth of integral length scale
 $L(t)$
with time
 $t$
for case IIb, with a four-power-law initial energy spectrum (see § 3.3.2 and figure 7 for case IIa). The insets show local slopes that can be used to estimate the decay and growth exponents in (b) and (c), respectively.

We consider, at time
 $t$
, the peak in the spectrum at
 $k_{p}(t)$
. When
 $k_{p}(t)$
is in the first and the third spectral ranges (see figure 17
a), we observe that some part of the spectrum rises above the initial spectrum. The local slope corresponding to the exponent for the energy decay is approximately
 $-1.0$
(figure 17
b). The exponent for the growth of the integral length scale remains constant at approximately
 $0.5$
only when
 $k_{p}(t)$
is in the first spectral range (figure 17
c). When the peak is in the third spectral range, the exponent rises close to the value
 $1$
(see the inset in figure 17
c). We also observe a short period of slowing down of the energy decay and the growth of the integral-length-scale growth when
 $k_{p}(t)$
passes through the junction of the second and the third spectral ranges.
Thus, we have considered different types of initial spectra in cases I–II where the energy decay can have complicated dependences on time
 $t$
in different temporal ranges. By carrying out this study, we have gone beyond the results for simple spectral ranges, presented in the study by Gurbatov et al. (Reference Gurbatov, Simdyankin, Aurell, Frisch and Tóth1997). For similar studies on the NS turbulence, the reader is referred to Meldi & Sagaut (Reference Meldi and Sagaut2012), which treats this decay using closure theory, and the numerical studies in § 4.
Appendix D
D.1. Navier–Stokes: definitions of the integral quantities
For our NS studies in § 4 the total energy
 $E(t)$
and the energy spectrum
 $E(k, t)$
are related to the Fourier series for the velocity field as follows:
 \begin{align} \boldsymbol{u}(\boldsymbol{x}, t) &= \sum _{\boldsymbol{k}} \hat {\boldsymbol{u}}(\boldsymbol{k}, t) \textrm{e}^{\textrm{i} \boldsymbol{k}\boldsymbol\cdot \boldsymbol{x}}\,;\nonumber \\ E(t) &= \sum _{\boldsymbol{k}} \frac {1}{2}|\hat {\boldsymbol{u}}(\boldsymbol{k}, t)|^2 = \frac {1}{(2\pi)^3}\int \frac {1}{2} |\boldsymbol{u}(\boldsymbol{x}, t)|^2 \textrm{d}\boldsymbol{x}\,; \end{align}
 \begin{align} E(k, t) &= \sum _{\substack {\boldsymbol{k} \\ k \leqslant |\boldsymbol{k}| \lt k + \Delta k}} \frac {1}{2}|\hat {\boldsymbol{u}}(\boldsymbol{k}, t)|^2 \frac {1}{\Delta k}\,. \end{align}
The carets denote spatial Fourier transforms, we take
 $\Delta k = 1$
, and we use the following standard definitions of the root-mean-square velocity, the integral length and the large-scale turnover time:
 \begin{equation} u_{ {rms}}(t) = \left (\frac {2 E(t)}{3}\right)^{1/2}\,;\;\; L(t) = \frac {\pi }{2 u^2_{ {rms}}} \sum _{k = 1}^{k_{ {max}}} k^{-1} E(k, t) \Delta k\,;\;\; \tau (t) = \frac {L(t)}{u_{ {rms}}(t)}\,. \end{equation}
Here,
 $k_{ {max}}$
is the largest integer that lies below the truncation wavenumber
 $\sqrt {2}N/3$
.
D.2. Navier–Stokes: decay of the two-power-law spectrum
Studies of the decay of
 $E(t)$
in freely decaying 3-D NS turbulence have a long history. For a summary see § 1.1 and Panickacheril John et al. (Reference Panickacheril John, Donzis and Sreenivasan2022). We summarise some more results below:
-
(i) If we use a single sharp peak in the initial spectrum
$E_0(k)$
, the decay of
$E(t)$
is qualitatively similar to that in 1-D Burgulence (see Appendix C.2). In particular,
$E(t)$
is expected to decay with a single power law (self-similar decay), but the measurements of the decay exponent are spread over a considerable range. Furthermore, the spectrum
$E(k,t)$
develops a
$k^4$
part at small
$k$
and a
$k^{-5/3}$
part at large
$k$
, the former because of the Proudman & Reid (Reference Proudman and Reid1954) beating interaction and the latter because of the evolution towards a K41 spectrum, in the sense of the spectrum introduced in Kolmogorov (Reference Kolmogorov1941). These regimes show up clearly in our DNSs, especially for the hyperviscous NS equation, but they are not reported here because we concentrates on initial data for which the initial spectrum
$E_0(k)$
has power-law regions (see (b) and (c) below). Of course, there are corrections to the K41 spectrum because of small-scale multifractality (see, e.g. Frisch Reference Frisch1995, Parisi & Frisch Reference Parisi and Frisch1985 and Ray, Mitra & Pandit Reference Sankar Ray, Mitra and Pandit2008). -
(ii) A single power law in
$E_0(k) \sim k^n$
, with
$ 2 \lt n \lt 4$
, cut off at large
$k$
: The decay of
$E(t)$
is qualitatively similar to that in 1-D Burgulence: In particular,
$E(t)$
is expected to decay with a single power law (self-similar decay), but the measurements of the decay exponent are spread over a considerable range (see, e.g. Panickacheril Meldi & Sagaut Reference Meldi and Sagaut2012; John et al. Reference Panickacheril John, Donzis and Sreenivasan2022). The cases
$n=4$
and
$n=2$
yield different powers as expected (see, e.g. Panickacheril John et al. Reference Panickacheril John, Donzis and Sreenivasan2022). We have discussed our results for the case
$n=4$
in detail in § 4. Note also the study by Biferale et al. (Reference Biferale, Boffetta, Celani, Lanotte, Toschi and Vergassola2003) of decaying anisotropic turbulence; their ‘
$\ldots$
initial conditions are taken from the stationary ensemble of a forced random Kolmogorov flow’. -
(iii) Two or more power-law regimes in
$E_0(k)$
, cut off at large
$k$
, as discussed in detail in § 4. In short, the evolution of the energy spectra, the decay of
$E(t)$
and the growth of
$L(t)$
are qualitatively similar to their counterparts in 1-D Burgulence (see § 3.3.1).


We study two additional cases of energy decay in the hyperviscous 3DNSE of the type that we have studied in § 4.1.2.
We first consider the pair of spectral exponents
 $(n_1, n_2) = (3, 1.5)$
with
 $k_1 = 60$
in (4.4) and
 $\nu _2 = 1.66 \times 10^{-8}$
. Our results are displayed in figure 18, which is the counterpart of figure 9 in § 4.1.2. The logarithmic local slopes of
 $E(t)$
and
 $L(t)$
, shown in the insets of figures 18(b) and 18(c), support our qualitative conclusion in figure 9 of § 4.1.2: Energy decay is non-self-similar, but, at large times, the energy-decay exponent is determined by the
 $k^{n_1} = k^3$
part in the low-
 $k$
region of the energy spectrum. Here, we do not observe a decay exponent that is close to the naïve expectation for the
 $k^{n_2}$
part in the initial energy spectrum. With this pair of values
 $(n_1, n_2) = (3, 1.5)$
, we do not observe a mismatch of the time windows for the plateaux in the logarithmic local slopes of
 $E(t)$
and
 $L(t)$
(unlike what we found for the pair
 $(n_1, n_2) = (1.5, 3)$
in figure 9 of § 4.1.2).


Finally we consider
 $(n_1, n_2) = (1.5, 2)$
with
 $k_1 = 60$
in (4.4), with
 $n_1$
quite close to
 $n_2$
; we set
 $\nu _2 = 1.32 \times 10^{-8}$
. Our DNS results are depicted in figure 19, which is the counterpart of figure 9 in § 4.1.2. The logarithmic local slope of
 $E(t)$
, shown in the inset of in figure 19(b), is similar to its counterpart in figure 9 in § 4.1.2.
 $(n_1, n_2) = (1.5, 3)$
shown in figure 9(b). It is interesting that the two small plateaux agree with the naïve predictions for energy-decay exponents for initial energy spectra with
 $k^{1.5}$
and
 $k^{2}$
power-law forms. However, the local slope of the integral scale does not have a well-developed plateau, hence, it is at variance with the naïve predictions for the growth exponents for
 $L(t)$
. Therefore, with this pair,
 $(n_1, n_2) = (1.5, 2)$
, the decay of
 $E(t)$
is non-self-similar; and it does not support the dominance of the
 $k^{n_1}$
part of the energy spectrum at large times.
In summary, our hyperviscous DNS (
 $\beta = 2$
) elucidates the subtle dependence of the decay of
 $E(t)$
on the powers
 $n_1$
and
 $n_2$
that characterise the initial energy spectrum in (4.4).