

I. A negative case for enforcement
This article deals with the factors that could elucidate the occurrence of a “negative case” with respect to enforcement powers attributed to EU agencies. The study of such a negative case is particularly relevant, as the emergence of enforcement powers has been considered a new type of spillover.Footnote 1 As this argument is grounded on functionalist assumptions, it raises questions about what accounts for the non-emergence of enforcement powers, which should unfold as a functional necessity once a given stage of institutional development has been reached. Of course, it may be that some EU agencies simply do not match the scope conditions of the theory, or, in other words, that they do not (yet) possess the characteristics that should produce the spillover, eg in terms of their institutionalisation, tasks, regulatory capacity, and so forth. If so, they would correspond to so-called irrelevant negative cases, ie those for which the phenomenon of interest is not theoretically expected, and indeed it does not occur. Instead, this paper focuses on a negative case – the Agency for the Cooperation of Energy Regulators (ACER) – that could theoretically display the outcome, as it is largely comparable to positive cases where the phenomenon of interest does occur, such as the European Securities and Markets Authority (ESMA),Footnote 2 and yet it does not. The central claim of this research strategy is that this negative outcome – the non-attribution of enforcement powers – should depend on one (or some) underlying factor(s) of theoretical interest that characterises the specific case at stake, and namely, as I will argue in what follows, on the role of business interest groups. It is also worth noting that European networks and agencies are extremely relevant for studying contemporary lobbying dynamics, as they epitomise the unfinished and multifaceted process of transnationalisation of governance, which is – to a considerable extent – where political authority is increasingly being relocated.Footnote 3
Why would one expect that business interest groups matter for the issue at stake, and that they would do so negatively? While the general literature on interest group representation is abundant,Footnote 4 the dynamics of interest representation in transnational governance settings such as those unfolding in European regulatory networks (ERNs) that preceded the establishment of EU agencies, and in EU agencies themselves, are much less studied. In particular, the role of business interest groups in advancing or hindering enforcement, and, more generally, in shaping changes in governance arrangements, is an important topic that has so far been overlooked. Nonetheless, several features suggest that business interest groups may play an important role. ERNs and EU agencies typically deal with the meta-regulation of technical matters, involving topics such as market integration, the interconnectedness of operators or the need to provide information about tariffs, wherein one would expect a policy making style close to “board room politics”, whereby decisions are made by an elite of bureaucrats, professionals and business groups, excluding citizens and politicians.Footnote 5 In addition, loose transnational arenas provide fertile ground for the political involvement of business interests.Footnote 6 In that regard, studies on international organisations such as the WTOFootnote 7 and the World BankFootnote 8 have emphasised the openness, the diversity and the volatility of interest representation in these settings. Comparative work on national-level policy networks has shown that business interests, mainly represented through associational forms and by the direct political action of large companies, represent a significant percentage of actors within these communities (roughly around 50%), even though the weight of business interests varies across sectors and policy areas.Footnote 9
How to conceptualise and operationalise this weight? As Truman put it, “power of any kind cannot be reached by a political interest group, or its leaders, without access to one or more key points of decision in the government. Access, therefore, becomes the facilitating intermediate objective of political interest groups. The development and improvement of such access is a common denominator of the tactics of all of them”.Footnote 10 Albeit access does not guarantee influence, it should be considered as a crucial condition for the exercise of power in policymaking. The question of interest representation can thus be fruitfully framed from this perspective, at least for exploratory purposes. The literature on lobbying has typically dealt with the question of access. In their extensive study of lobbying in the US, Baumgartner et alFootnote 11 have found that, when looking at the frequency of lobbying activities in Congress, business associations, corporations and professional associations all together constitute as much as 74% of the sample, in comparison with just 15% for citizen groups. Nonetheless, when citizens groups do participate, they seem to have a strong voice. They slightly outnumber trade and business associations as the most frequently cited type of “major participant” in a large sample of policy debates, with a score of 26% to 21%. Business corporations come third with 14%, the rest being shared among various actors such as professional associations, unions and think tanks. As regards influence, however, citizen groups are considered to have a disproportionally weaker effect on policy outputs, because they lack financial resources and staff in comparison with business corporations and associations.
The picture of lobbying activities in the EU shows quite complex and diverse patterns. To begin with, the EU is particularly dependent on secondary channels for interest representation, because of the weakness of ordinary representative institutions such as the European Parliament;Footnote 12 in turn, the system of interest representation in the EU is exceptionally remote from civil society, as most EU interest groups are in fact “associations of associations”.Footnote 13 The very nature of policy making in the EU is prone to interest group intermediation, given its high reliance on regulation, which is often presented as a technocratic mode of governance that requires sector-specific knowledge.Footnote 14 Similarly, the limited staff size of the Commission makes it dependent on external actors for providing information and expertise. A rough estimation using data adapted from Greenwood indicates that trade associations and professional associations represent 38% of all interest groups active in EU affairs, followed by citizen groups (17%), corporations (14%) and regions (10%).Footnote 15 These figures show a clear dominance of business, well above the US position. However, it is unlikely, the EU polity being multi-level and fragmented, that a single narrow interest can capture a policy domain, still less the entire system. The notion of “elite pluralism” is sometimes employed to make sense of this situation, meaning that “access is generally restricted to a few policy players, for whom membership is competitive and strategically advisable”.Footnote 16 Correspondingly, Klüver noted that lobbying success in the EU varies with the issue context, depending on the relative size of lobbying coalitions and the salience of policy issues, whereas individual group characteristics do not exhibit any systematic effect.Footnote 17 At the same time, resource endowment and organisational structures, as in the American case, do play a crucial role for effective lobbying.Footnote 18
Therefore, a double-sided expectation with respect to the role of business interest groups will be explored. On the one hand, it is expected that the opposition of important interest groups at a critical junctureFootnote 19 – brief phases of change whereby choices are made, other choices are discarded, leading to the establishment of institutions that generate self-reinforcing path-dependent processes, which are difficult to alter, such as agency design and reform – is a key factor that could lead to a negative outcome, that is, the non-assignment of enforcement powers to a EU agency possessing the theoretical features that would otherwise favour the functional spillover.Footnote 20 Such an opposition is expected to occur as business interest groups – especially in the case under investigation – consider pan-European regulators with enforcement powers to be too intrusive and insensitive to domestic variations in terms of market structure.Footnote 21 On the other hand, a negative case of enforcement should also depend on the actual capacity of interest groups to concretise their preferences. Thereby, it is expected that in negative cases such as the one under investigation, interest groups opposing the attribution of enforcement powers to EU agencies will be found to have a particularly preponderant role both in terms of access and (potential) influence on the governance of the policy area that is at stake at EU level, ie energy policy.
II. Research strategy
The main conceptual challenge of studying negative cases consists of selecting cases that could theoretically display the outcome of interest, as they are largely comparable to positive cases as regards the explanatory variables, and yet they do not.Footnote 22 They correspond to relevant negative cases, whose investigation is especially helpful to delimitate the scope of causal propositions, to refine causal theories, or to generate new hypotheses. Process tracing approaches provide the appropriate tools to examine these cases by pointing to the observable manifestations of the phenomenon of interest within the case itself.Footnote 23 This in-depth study enables researchers to assess the congruence between empirical findings and concrete theoretical expectations.Footnote 24 Furthermore, counterfactual reasoning provides a complementary perspective to the study of negative cases, consisting in conjecturing on whether the outcome of interest would have occurred in the hypothetical absence of the specific factor of theoretical interest as mentioned above.Footnote 25 Starting with these premises, the analytical framework adopted in this paper relies on the within-case analysis of a single unit – a methodology that is appropriate for exploratory research applied to informal, hardly detectable phenomena.
The case of ACER fits neatly into this research strategy. This agency can be considered as a “typical” instance of EU agencies that could acquire enforcement powers, meaning that it is representative of the (small) population under investigation.Footnote 26 To begin with, energy regulation is confronted with the classic dilemma of coordinating policies and ensuring transnational cooperation in a field that involves “hard” politics associated with security concerns and national strategic issues. In the EU, energy regulation is specifically confronted with the highly complex task of ensuring the convergence of the gas and electricity markets in a context of path dependence on the existing infrastructures and on technical and economic domestic structures.Footnote 27 At the same time, supranational institutions have to manage the natural interconnectedness of energy policies and infrastructures in a context shaped by strong national interests.Footnote 28 ACER itself was established by the Third Energy Package as an independent EU agency and has been operational since 2011 to further progress the completion of the internal energy market for electricity and natural gas.Footnote 29 The statutory goals of this EU agency are to coordinate and complement the activities of independent energy regulators at the domestic level, to monitor the harmonisation of regulatory frameworks within the framework of the EU’s energy policy objectives, and to provide advice on the process towards the achievement of the single EU energy market for electricity and natural gas. ACER’s organisational structure is composed of permanent staff and experts from domestic regulators. Oversight of the agency’s regulatory activities is ensured by a board of regulators, comprising senior representatives of national agencies in the field of energy in Member States. An administrative board appointed by EU institutions supervises administrative and budgetary activities. Finally, an independent board of appeal deals with complaints against ACER decisions.
The first step of the empirical analysis is exceedingly simple. It consists of looking for clues in official documents that support the expectation that business interest groups had an unconditional preference for blocking the attribution of enforcement competencies to ACER. In line with the logic of process tracing and congruence analysis, the descriptive inference comes from the systematic examination of diagnostic evidence.Footnote 30 The second step of the empirical analysis, whose goal is to examine the extent to which these preferences could have been concretised, is more demanding.Footnote 31 It requires a measuring of the importance of the role of business interests in the governance of the EU policy area at stake. Finding a univocal, direct measure of such a “diffuse” influence is difficult, especially due to the quite informal nature of the processes under investigation and related data availability limitations. However, a good proxy of business interest access and influence in EU energy policy governance is their active participation in the network that preceded the establishment of ACER, and at the same time still overlaps with it. Indeed, national energy regulators began to coordinate actively in an informal way from 1997. Then, in 2000, the Council of European Energy Regulators (CEER) was established as a voluntary association to institutionalise these informal exchanges. ERGEG (European Regulators Group for Electricity and Gas) was created by the EU in 2003 as an advisory group intersecting with CEER, but remained largely irrelevant until its transformation into ACER. In fact, actual decisions were made within CEER, that is, when representatives of the EU Commission are absent. From the organisational side, CEER and ERGEG can be considered as a single networked organisation, as they largely overlap in practice. At the outset, interactions among regulators were limited to technical exchanges of information and did not imply the discussion of policy issues; however, quite soon a number of soft rules in the form of principles, guidelines and recommendations were agreed upon and adopted at network level – for instance the “balancing markets” guidelines and the “information and transparency” guidelines, which aim to encourage competition in the energy markets and to establish a consistent strategy across Europe for the provision of information to market participants.
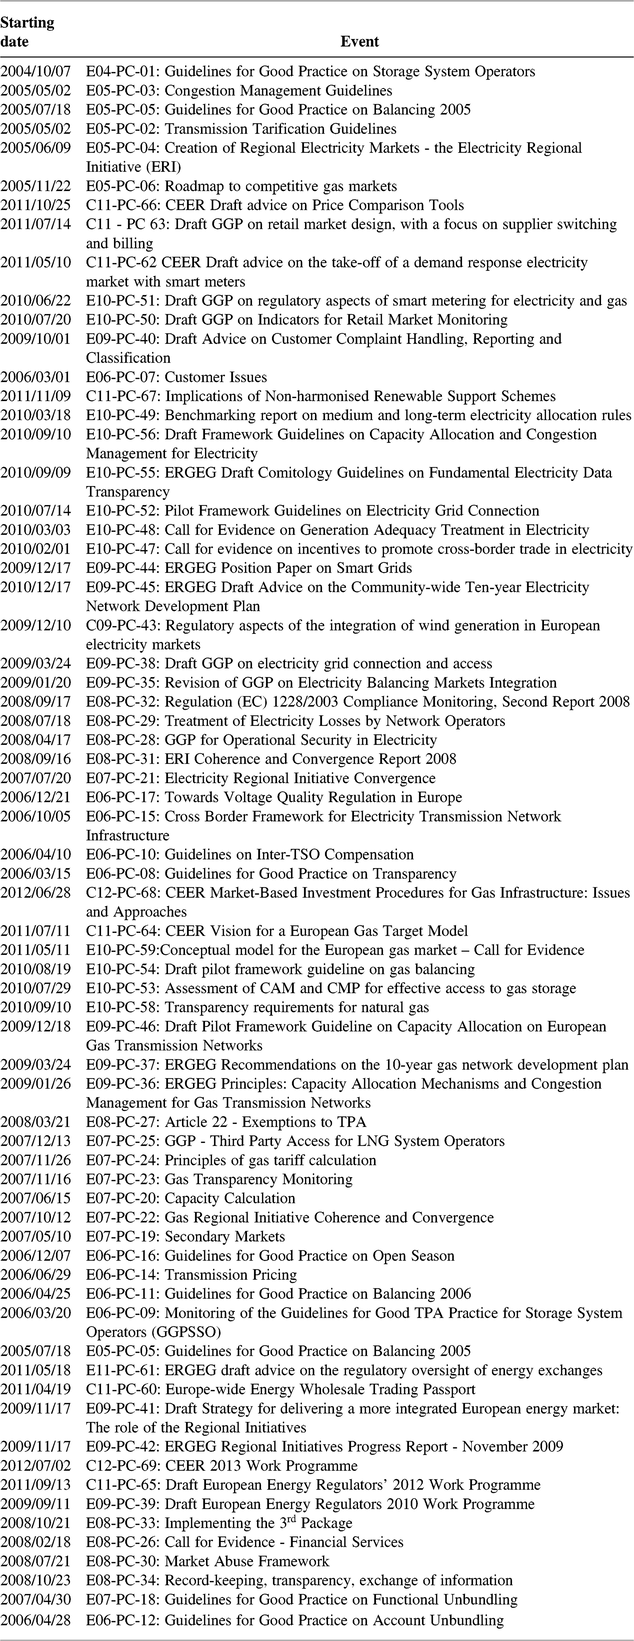
This article will thus examine the access and the potential influence of “external actors” in the policy process of CEER/ERGEG. The starting point involves the comparative examination of the proportion of all external actors that were consulted and took part in the hearings leading to the policy outputs of this networks, that is, the drafting and agreement upon all principles, guidelines and recommendations issued by the CEER/ERGEG. The temporal framework corresponds to the network’s active operation, which is the period 2004–2011. These actors consist of 481 entities that can be systematised in 11 distinct types, as follows: (1) firms; (2) business associations; (3) experts; (4) trade unions; (5) NGOs and non-profit; (6) firm networks; (7) government and agencies; (8) consultants; (9) universities; (10) insurances and pension funds; (11) investors and financial institutions. The 68 policy processes (or “events”) that occurred during the investigated period pertain to the reliability of supply, cost-effectiveness, risks minimisation, and to the transnational coordination, cooperation and communication of energy regulations. Examples are transmission tarification guidelines, congestion management guidelines, or procedures for transparency monitoring (cf Table 2 in the Appendix, below).
Afterwards, regarding the potential influence of external actors, my approach is to use some basic tools of social network analysis to identify the most central actors in the network. To grasp a sense of the trends over time, I will break down the analysis on a yearly basis, which represents the basic unit of the network’s policy cycle, before aggregating data for the whole period. To do so, I will compute a two-mode matrix for each year, with the predefined actors in the rows and the events (ie guidelines, recommendations, etc) in the columns, by filling the cells with a value of one (1) where an actor actively participated in an event, and with a value of zero (0) where an actor did not participate. This two-modes (actor-event) matrix will be transformed into a one-mode (actor-actor) matrix applying the adequate procedure in UCINET.Footnote 32 This transformation creates a matrix containing symmetric relations between all pairs of actors participating in decision-making processes, year-by-year. As an example: a value of 5 in the cell 6-7 of the matrix related to the year 2008 means that both actors 6 and 7 jointly participated in five events in the year 2008. Then, these matrices can be analysed with social network analysis tools to derive centrality measures such as the degree and the betweenness centrality of actors, representing respectively their local popularity and their relative prominence in ensuring the connectivity of the network; they are thus complementary measures.Footnote 33 I will use the former as the main indicator of potential influence and the second as a robustness check. In order to implement this procedure, I have put together a new dataset, based on publicly available data found on the CEER and ERGEG websites and completed with an email inquiry to the network’s secretariat (see the Appendix for more details).
III. Interest groups and patterns on non-enforcement
As said above, ACER is interesting from the point of view of enforcement because it is a “typical” EU agency that however does not enjoy enforcement powers. The opportunity of granting enforcement powers – through the application of fines – to ACER has been concretely discussed in due time, namely following a recommendation by the EU Parliament.Footnote 34 However, these enforcement mechanisms were considered not appropriate by the EU CommissionFootnote 35 and by the EU Council, and were ultimately not conceded.Footnote 36 On paper, this choice has been motivated on the grounds of the “Meroni doctrine”, which would prevent the delegation of “hard” regulatory powers such as enforcement competencies to EU agencies. The boundaries of the Meroni doctrine are however becoming rather indefinite. Indeed, as previously mentioned, ESMA, an EU agency that is largely comparable to ACER, has eventually received enforcement powers that are very similar to those suggested for the energy agency. The legitimacy of this entrustment process has also been confirmed by a ruling of the Court of Justice of the European Union (CJEU). Thereby, going by the book alone cannot explain this difference.
Instead, there are clues indicating that energy stakeholders mattered, especially business interest representatives. To begin with, it appears that business interests have been consistently opposed to this option. Since these issues are mostly dealt with informally, especially in the pre-ACER era, it is difficult to find smoking-gun evidence of their role.Footnote 37 However, it is possible to put together some documentary evidence that goes in this direction. Official reports of stakeholder meetings and consultations indicate widespread support for the prescription that enforcement procedures and practices should remain a prerogative of national regulatory agencies, in conformity with the Third Energy Package and the Regulation on Wholesale Energy Market Integrity and Transparency.Footnote 38 At the same time, a broad stakeholder consultation launched by ACER in 2012 has shown that these enforcement procedures and practices were largely non-harmonised.Footnote 39 Interestingly, a more recent report has indicated that enforcement powers are not only weakly consistent, they are also insufficient overall to guarantee compliance.Footnote 40 Nevertheless, the European Network of Transmission System Operators (ENTSO-E), which represents the most important external stakeholders as regards business interests in the energy sector, expressed a clear opposition to the attribution of enforcement powers to ACER, however limited they might be – a finding that tends to corroborate the first expectation:Footnote 41
“ENTSO-Eopposed the Commission’s proposals to give ACER additional competences in the network code development process and considered the oversight role of ACER on regional cooperation as counter-productive and at odds with better regulation.”
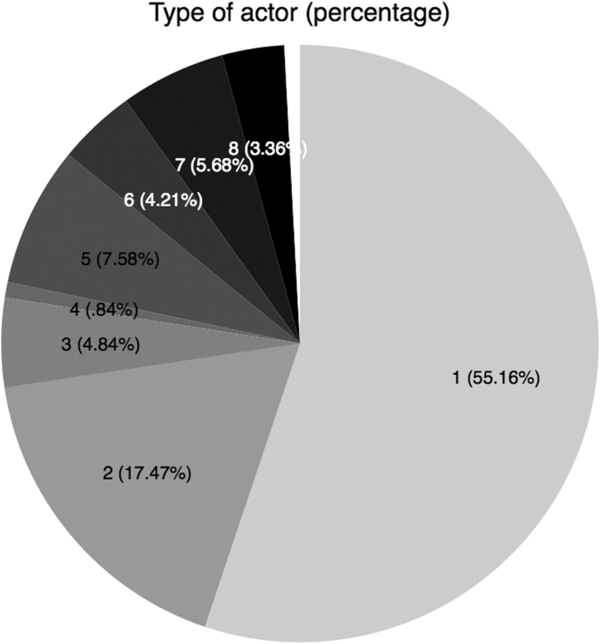
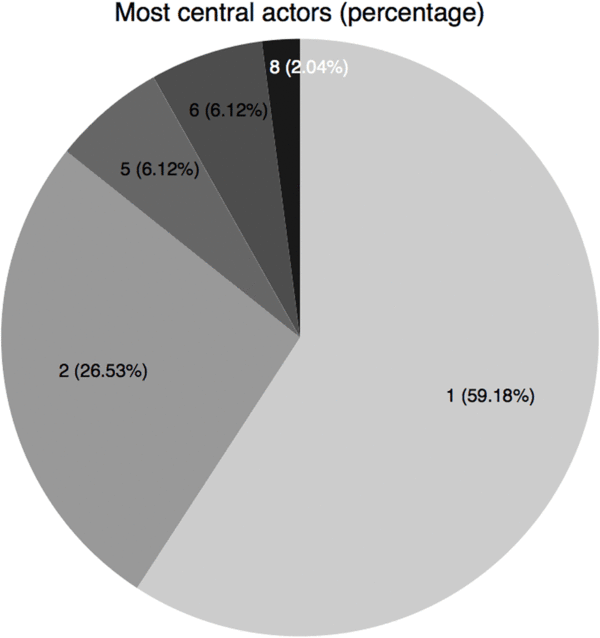
The next step is to assess the extent to which these stakeholders hold enough power to impose their preferences in this policy area, using the patterns of interest groups representation in CEER/ERGEG as a proxy. When we look at the aggregated figures, we find considerable support for the expectation about the preponderance of business interests in the energy network. Indeed, firms and professional associations represent 72% of all the external actors included in the decision-making process of CEER/ERGEG in the years 2004–2011 (Figure 1). Most importantly, this percentage grows to 85% when only the 10% most central actors (in terms of degree centrality) are considered (Figure 2). This means that business interests are virtually the only ones that are potentially influential in the production of policy outputs in the form of principles, guidelines and recommendations within the CEER/ERGEG.Footnote 42 This result confirms previous findings, for instance those of CoenFootnote 43 and Culpepper,Footnote 44 according to which business actors are very successful in their lobbying activities, especially in technical fields. However, the scale of the phenomenon is impressive. These networks seem particularly vulnerable to be colonised by the external actors that have more financial resources and staff to get actively involved, at the expenses of pluralist representation that is more common in democratic institutions at the national and, to some extent, at the more institutionalised EU level.
participation

most central actors (10%)


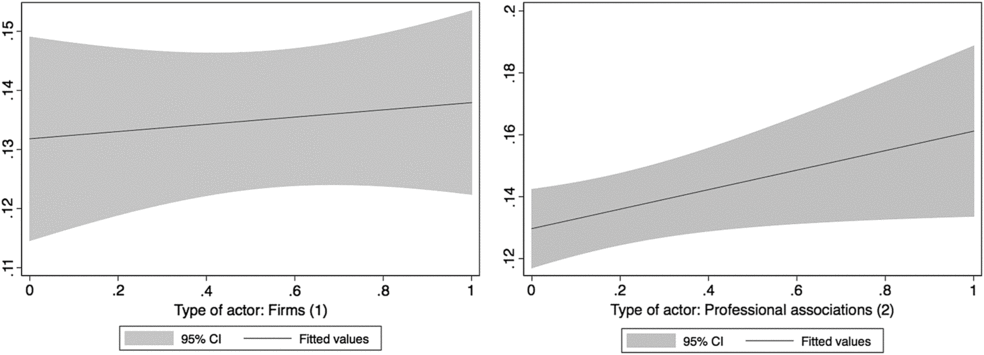
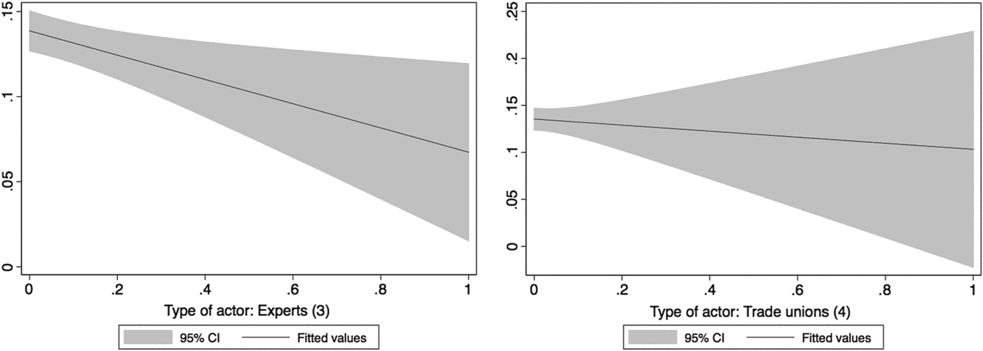
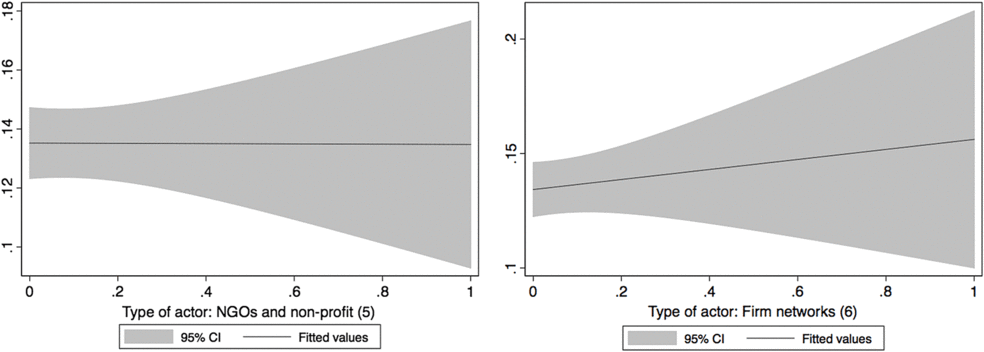
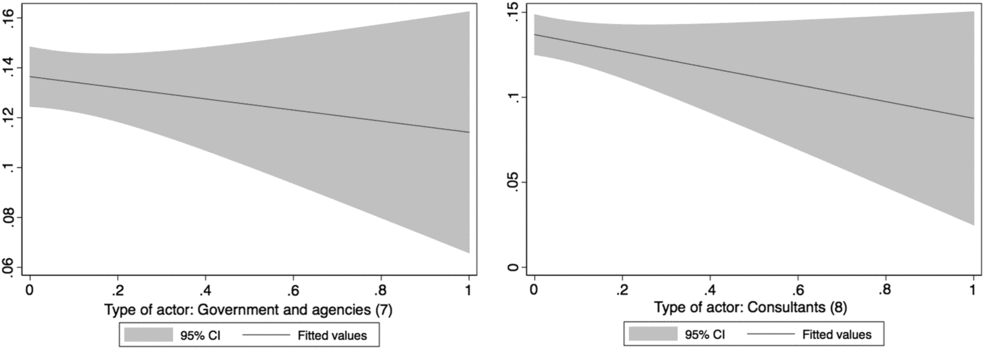
Bivariate regressions can be used to give a sense of the association between the occurrence of each type of actor (measured as a dummy variable) and their overall centrality. As shown in Figures 3 to 13, this association is not so clear-cut (regression tables are not reported). The only significant effects of the type-of-actor dummies on centrality occur for professional associations, whose presence tends to be positively associated with centrality, and for experts, which appears to be inversely related to the dependent variable. However, the overall trends corroborate the results mentioned above.
bivariate regressions (centrality)

bivariate regressions (centrality)

bivariate regressions (centrality)

bivariate regressions (centrality)

bivariate regressions (centrality)

bivariate regressions (centrality)

When the single-actor degree centrality of the most central actors is considered (Figure 14), it is possible to conclude that some large corporations seem very influential indeed, such as Edison SpA (an energy company headquartered in Milan, Italy), E.ON (a large holding company based in Essen, Germany, which runs electricity utility service providers), Centrica (a British multinational utility company whose principal activity is the supply of electricity and gas to businesses and consumers), EDF (a French electric utility company, mostly owned by the French government), ExxonMobil (an American multinational oil and gas corporation), and SSE (a British energy company). They rank consistently among the very most central actors, meaning that they were actively involved in many of the decision-making processes in the period under consideration. However, business associations are also equally relevant. Examples are EURELECTRIC (an association that represents the interests of electricity generation and distribution companies) and GEODE (which represents independent energy distribution companies), BDEW (an interest group representing the German energy and water industries), CEDEC (a Brussels-focused organisation representing the interests of local and regional energy companies in Austria, Belgium, Bulgaria, France, Germany, Italy, the Netherlands, Norway and Switzerland). Furthermore, in line with this expectation, the data shows that no single actor appears to dominate the policy process at network level for the entire period under investigation.
single-actor centrality

There is a trend towards even more representation of business interests over time; this is corroborated by this empirical analysis, although with some qualifications (Figure 15). The social network of external actors included in the CEER/ERGEG evolved considerably in the course of the period under consideration. It is possible to note an expansion both in the number of events per year and in the share of consulted actors. Above all, this development goes with a progressive reinforcement of business actors. The diachronic analysis of network centrality indeed shows that, although some public agencies and groups representing consumers and civil society were able to achieve moderately central positions in the first years of network existence, their potential influence stagnated or even declined as time went by. Instead, business interest groups monopolise the most central positions especially since 2009. Conversely, the relative weight of firms and business associations is quite stable over time.
cumulative centrality year-by-year

At the end of the day, it appears that, in line with the second expectation, business interests were clearly overrepresented in CEER/ERGEG, indicating that is it likely that they have been able to concretise their preferences about the non-attribution of enforcement powers to ACER. It is also plausible to hypothesise that, if business interest groups had not been opposed or had not had a preponderant role in the governance of this policy area, the functional spillover would have been more likely.
IV. Concluding remarks
This article has put forward exploratory evidence about the preference of business interest groups for the denial of enforcement powers to ACER, the EU agency in charge of the meta-regulation of the energy sector. What is more, it has shown that business interests are clearly overrepresented in CEER/ERGEG, the network that preceded the establishment of ACER, and at the same time still overlaps with it, much more than in national and European institutions. Not only do business interest representatives have ever more frequent access to decision-making processes within the network, but they are also able to occupy very central positions, meaning that they have high potential influence on the outputs of these processes. The most central actors are a relatively small number of firms and business associations. While no single actor dominates the process, a distinct type of interest group, representing business interests, is increasingly predominant in the network, achieving an almost hegemonic position. These findings suggest that business interest groups play a particularly pre-eminent role in this area, both in terms of participation and of potential influence, which makes them potentially able to concretise their preferences for the non-attribution of enforcement powers to the sector-specific EU agency. Further research should cross-validate this exploratory finding with comparative evidence on the role of business interest groups in other sectors.
Some more general implications can be drawn from this exploratory study of a negative case of enforcement. The networks under investigation appear to be largely colonised by external actors that have the capacity, motivation and resources to influence their decision-making processes, more than is usually found in democratic institutions at the national and, to some extent, the EU level. A possible explanation – that would deserve further attention – could relate to the distinctive organisational and institutional characteristics of networked organisations, which could make them effective governance tools, but also more vulnerable to some special interests. On the one hand, their flexibility, informality and openness make them particularly permeable. On the other, as they are relatively opaque vis-à-vis broader audiences, weakly accountable to representative democracy institutions, and relying on technocratic legitimacy, they do not have to justify the differential inclusion of business interest groups in front of public opinion. What is more, they appear as primary lobbying targets for interest groups. Although trade associations are found to be less relevant than they used to be in domestic-level interest intermediation, their role is extremely important in the governance network under investigation. This may suggest that these associations are redirecting their efforts to other levels, where real decisions are considered to be made.
Given that ERNs and EU agencies are bringing into being a double delegation of powers – from domestic governments to independent regulators and then from independent regulators to regulatory networks and/or agencies – coupled with a selective inclusion of interest groups as external actors, the question of ensuring their democratic accountability stands out as crucial. The question remains open about the factors shaping the special role played by interest groups in this negative case of enforcement related to the governance of EU energy policy with respect to positive cases for which the function spillover did occur. It may depend on the specific public-private nature of the energy industry and on the unusual collective action capacity of their stakeholders, but, again, further research is needed to clarify the scope conditions.
Appendix
List of actors

List of events