The past several decades have seen a ‘third wave’ of democratization with the collapse of the Soviet Union and the spread of political rights and democratic elections in South America, Asia, many parts of Africa,Footnote 1 and now, possibly, the Middle East. While the trend has hardly been irreversible, by the millennium there were eighty-six countries (representing 38 per cent of the world's population) that could be considered democracies using fairly rigorous standards. This constitutes more than a 100 per cent increase in less than thirty years.Footnote 2 We may wonder, however, how well all of these new and more established democracies are doing. That is, what is the quality of the democratic representation they provide?
This is not an easy question to answer, for it requires a standard of judgement. Political scientists who have studied democratic elections comparatively have traditionally focused attention on turnout.Footnote 3 Indeed, comparative turnout rates have been studied so frequently that the very health of a democracy is often judged in terms of its election turnouts.Footnote 4 In most democracies, furthermore, declining turnout rates are seen as a reason for concern about the quality of representation.Footnote 5 Thus one way we could answer this question is to look at the proportion of adult citizens that typically votes in national elections.
Such a focus on turnout, however, implicitly assumes that all votes are equal – that is, contribute equally to democratic representation – an assumption we do not believe is completely justified. We propose another criterion. Over a decade ago Lau and Redlawsk introduced the notion of correct voting – the extent to which voters, inevitably under conditions of incomplete information, nonetheless actually choose the candidate they would have chosen had they been fully informed about the issues and candidates running in that election.Footnote 6 Proposing a standard for correct voting very explicitly allows for the possibility that some people do not meet that standard: that some citizens vote, for lack of a better term, incorrectly. If ‘the will of the people’ is achieved in a democracy in large part by citizens electing representatives who share their own values and priorities, that mechanism can only work if citizens actually choose those parties or candidates who do indeed best represent their own views. Incorrect votes undermine democratic representation by helping to elect officials who do not accurately represent the views of their voters, and by misleading other government officials who might try to assess public opinion based on those election results. We argue that democracies must not only engage their citizens in the decision-making process by encouraging them to vote; they must also provide the information, motivation and institutional arrangements to allow their citizens to choose candidates who are consistent with their preferences. Healthy democracies should encourage both voting and voting correctly. No level of turnout can compensate for relatively high levels of incorrect voting.
Lau and colleagues have developed their theory of correct voting within the American context. They have validated their measure with both experimental data and surveys from nine recent US presidential elections.Footnote 7 Their underlying theoretical perspective is derived primarily from psychology and the decision-making literature, and thus focuses on individual-level predictors. While it is important to replicate Lau and Redlawsk's major findings in a broader context, we believe that individual variation is only part of the story. Democracies differ in their constitutionally mandated electoral systems, which shape the motivations and incentives provided to both political parties and individual citizens. Democracies differ in party systems that have developed as a result of both historical and institutional pressures, which in turn determine the number and type of alternatives confronting voters. Democracies also differ in the type of government that gets elected and provides the most immediate and salient context in which voters make their choices.
All of these institutional factors should help determine whether it is more or less difficult for citizens to cast a correct vote. But do they? Lau et al. have explored several higher-order factors that vary over time within the United States, but of course this only represents a very narrow view of the total institutional variation provided by modern democracies. The major contribution of this article is to expand a theory of correct voting to account for wider institutional variation, and to test that expanded theory with survey data from thirty-three established and emerging democracies (and sixty-nine head-of-government elections within those democracies) around the world, using the Comparative Study of Electoral Systems (CSES) data.
What is a correct vote?
Determining the quality or ‘correctness’ of a vote decision is no easy task. Who is to decide what is correct? Should we impose a particular set of values upon the judgement? Following Dahl, Lau and Redlawsk adopt a theoretical middle ground by defining correctness based on the ‘fully informed’ interests of individual voters. As Dahl writes, ‘a person's interest or good is whatever that person would choose with fullest attainable understanding of the experiences resulting from that choice and its most relevant alternatives’.Footnote 8 In any modern-day national political campaign, voters are inundated with far more information than they can possibly process. This in turn impedes access to the information that is actually relevant to the dimensions of judgement the voter actually cares about. Almost by necessity, then, most voters are choosing with less (and often with a lot less) than full information. Thus Lau and Redlawsk define a correct vote decision as one that is the same as the choice that would have been made under conditions of full information.
Lau and Redlawsk present two measures of correct voting.Footnote 9 The first is only available in a controlled experimental setting in which ‘all alternatives in the choice set’ and ‘all dimensions of judgement’ can be carefully controlled, and complete information can be provided to voters after they have made their decisions; the voters then can determine for themselves if, had they known everything they know now, they would have changed their decision. These restrictions of course limit the usefulness of this first measure of correct voting.
Lau and Redlawsk's second measure, which is closely related to the first empirically, can be estimated with fairly standard survey data in which voters report their own values and interests. The researcher then applies objective criteria to determine which candidate is the voter's correct choice, given those values and interests. For example, most citizens hold a party identification that can be easily matched to the parties and candidates competing in an election. Respondents tell us which political issues they care about (at least enough to report a position), which can then be compared to the actual stands of candidates or parties (where ‘actual’ is determined by political experts) on those policies. People tell us how much they care about an incumbent's job performance (again by answering survey questions), which can be used to weigh expert judgements about the incumbent's actual job performance in an overall vote calculus. In some surveys, respondents report whether they ‘identify with’ or ‘feel close to’ different social groups that are widely believed (again, by experts) to benefit from one party or another being in power. They may also assess the competence or integrity of party leaders. These different evaluative considerations can be combined into overall ‘utility’ scores associated with each party or candidate. The correct vote is for the party/candidate with the highest total. Lau and Redlawsk call this second measure of correct voting normative naïve – naïve in that it is based on the voter's own preferences and determination of what criteria of judgement are important, and normative because (1) it is based on experts’ judgements of which party or candidate is closest to the voter's expressed preferences and (2) the same criteria of judgement must be applied to all candidates or parties in the choice set. We build upon this second procedure here.
First, however, it is worth considering more carefully what ‘fully informed preferences’ actually are, even in theory, and whether there are any boundaries to the type of alternatives or dimensions of judgement that should be considered in determining a correct vote, especially when the number of alternatives (particularly in systems that allow for write-in candidates or parties) and potential dimensions of judgement are almost infinite. If correct voting allows citizens to determine for themselves what dimensions of judgement they care about, then ‘fully informed’ must apply only to those particular criteria. We would not expect people to be true experts on any of those judgement criteria, only that they would know (at most) what the ‘reasonably informed citizen’ would know: that they would be aware of the official policies or public statements from party leaders about the topics (even if they are not a major part of the current election campaign), and that they would be aware of any approximate consensus among elite opinion leaders as to significant differences (or lack thereof) between the parties or candidates on those topics. If voters prioritize multiple considerations by relative importance, then fully informed preferences should somehow reflect that rank ordering as well.
As to boundaries, we might begin by limiting consideration to those aspects of society over which government has some control (governments should not be held accountable for the weather, for example), and by focusing on past government performance (to the extent this can be objectively determined) or factors that could influence future performance, such as policy proposals that are meant to address the important issues of the day. We want to include both retrospective and prospective concerns in any definition of correct voting, because they have both been normatively associated with democratic representations.Footnote 10 Purely idiosyncratic personal concerns (fixing the pothole in the street at the end of my driveway) are excluded on normative grounds; there has to be some larger social (though not necessarily societal) aspect to the consideration.Footnote 11 Thus social identifications with a class, ethnicity or religion that are associated with a party or leader – and that might reasonably be expected to benefit all members of the group if that party or candidate were elected – should be considered because they affect us, not just me. The most obvious and directly relevant such social identification would be with a political party. In almost every country, political parties represent historical social divisions and current and past policy performance reflecting those divisions, and as such are very relevant to determining a correct vote. Aspects of political leaders’ personality that could likely influence government performance, such as their intelligence, experience, competence or integrity, are very legitimate considerations for correct voting; other ‘personal’ factors (such as a leader's attractiveness) would not be relevant if they do not directly influence government performance – even though such factors might sometimes be very important determinants of actual vote choices. So-called strategic concerns about the electability of a particular party or candidate would also be very relevant, because no party can influence government if they cannot get elected.Footnote 12
In practice, of course, the alternatives in the choice set and dimensions of judgement that can be used to try to estimate correct voting will be limited to the alternatives and dimensions a (survey) researcher has chosen to ask about. While such compromises are inevitable in any shift from the conceptual to the manifest level, this particular compromise does not strike us as unusually troubling. Given what we know about the typical citizen's civic knowledge and political interest, we doubt that most citizens ever consider voting for any but the most prominent parties and candidates who are discussed in the media, and we strongly suspect that the major dimensions of judgement for almost all voters will again be those that have been primed and framed by elite discussion. These are exactly the parties and dimensions of judgement that are most likely to be included in high-quality election surveys, and thus available for analysis. No measure will ever capture every consideration of every voter, but the type of information one gets from the typical high-quality election survey should include the major considerations of most voters.
Before grappling with those more practical issues, we want to be very clear about our purpose. Correct voting is not meant to describe what voters actually do; there is a huge voting behaviour literature that addresses that question. Correct voting is a normative criterion representing what voters ‘ought’ to do, given their own values and relative priorities. We take these – at least for the election immediately at hand – as exogenous and fixed. Our question is: how many voters chose the party or candidate that best represents their own expressed values and priorities? The very essence of democracy is undermined if large numbers of voters fail to do so.
What should predict correct voting?
Democracy works best when citizens are interested in political matters, knowledgeable about constitutional rules and regulations that give responsibility for specific political outcomes to different political actors, attentive to the performance of people and parties in government, and aware of historical and regional comparisons to put those performances in proper context. Such ideal democratic citizens would also be very likely to have the information and perspective to vote correctly. Unfortunately, because of limited cognitive resources, very few people in any democracy have the time and energy to develop this type of knowledge about (and enduring interest in) politics. Home, family, children and work all regularly make more immediate and compelling demands on our time.
Following Payne, Bettman and Johnson and Lau and Redlawsk,Footnote 13 we believe that all decision makers are typically guided by two chief motivations: the desire to make a good decision, and the desire to make an easy decision. In mass politics, where the stakes are rarely very high and the probability that one's vote will change the outcome of the election is essentially zero, ease is almost always the dominant motivation. Thus anything that makes the choice easier for cognitively limited decision makers should increase the probability of a correct vote, while anything that makes the choice more difficult should decrease correct voting. Similarly, anything that would make consequences of the election more salient to voters, factors that should increase motivation, should increase the probability of a correct vote. Our ultimate goal is to present a multilevel model that combines institutional- and individual-level predictors into a single analytic framework.
Individual differences
Prior researchFootnote 14 suggests that at the individual level, ability (particularly decision-relevant knowledge), experience and effort should all be associated with higher levels of correct voting.
-
(1) In any domain, it is far easier for people with greater pre-existing knowledge – those with general knowledge about the world and domain-specific expertise – to process new incoming information and link it to relevant prior knowledge in their memory. Thus people with higher levels of political knowledge in particular, and more education in general, should have a greater capacity for thinking about politics and therefore a higher probability of voting correctly.Footnote 15 We adopt the term Political Sophistication to represent this concept.Footnote 16
-
(2) The more election campaigns citizens have experienced, the more familiar they are with the peculiarities of the political system and the more sophisticated and efficient the heuristics they have developed to aid decision making – in short, the older people are, the more likely they are to vote correctly. When it comes to politics (as with many other domains of life), Age and experience impart wisdom.Footnote 17 (We will modify this hypothesis after introducing higher-lever factors below.)
-
(3) The more citizens try to make good decisions – the more it matters to them which candidate wins – the higher the probability they will vote correctly.Footnote 18 No direct measure of motivation is available in the CSES surveys, but this construct is measured indirectly by Political Efficacy. People who believe they have the ability to influence their political outcomes should generally be more strongly motivated to put in the effort to try to vote correctly than those with little or no political efficacy.
Thus our first three hypotheses suggest that ability (political sophistication), experience (age) and motivation (political efficacy) should all be positively associated with correct voting. Each of these hypotheses has found strong support from American data,Footnote 19 and our priors are high that they will find similarly strong support from other electoral systems. But it is always important to confirm such expectations.
Institutional Factors
Characteristics of the individual decision maker are not the only things that should affect correct voting, however. The difficulty of the choice itself should also affect the probability of a correct vote. In the decision literature this factor is referred to generically as ‘task demands’. We will consider how a country's electoral institutions – its laws, the party system that has developed in response to those laws, and its incumbent government – all influence the difficulty of the choice voters are asked to make, or the motivations they have for making a good choice, and hence the probability of a correct vote. These considerations provide eight additional hypotheses for testing.
We begin with the Age of the Democracy. The longer citizens have been choosing their leaders, the longer a set of rules have been in place (no matter what those rules are) and the easier it ought to be for people to choose the leaders they want. We take the log of this measure, as is standard in the literature. Indeed, an individual's political experience can only have its predicted effect if a country has been democratic for longer than the citizen has been an adult. Thus we also hypothesize a positive cross-level interaction between individual-level political experience – age – and the years a country has been democratic.
The greater the number of constitutionally mandated political freedoms a country enjoys, and the more open its media environment, the more aware its citizens ought to be about what the government has accomplished, the more easily they should be able to discuss political matters with others, the more informed they should be about what various out-parties are promising, and in the end the easier it ought to be for them to make informed decisions. Readily available relevant information reduces information costs and makes a decision easier to reach. Political rights are an indirect measure of information availability, but the standard measures (for example, the ‘Polity2’ variable (Democracy – Autocracy) from the Polity IV Project, or the Freedom House ratings of political rights and civil liberties) vary little in our sample of countries. Instead, we measure information availability more directly with a summary measure of the Density of the Media Environment, the mean number of telephones, televisions, newspapers, radios and people with internet access per 1,000 adult citizens. The higher this mean, the greater the access to the larger world enjoyed by citizens in a country, the more political information should be readily available, and the easier it ought to be for them to cast a correct vote.
We hypothesize a second cross-level interaction, between Media Density and Political Efficacy. Efficacy should translate into a higher probability of a correct vote only if voters have the opportunity – the freedoms, rights and access to information – to translate their motivation into effective action. Without such information, political efficacy would be largely delusional.
Electoral laws have most frequently been studied in terms of how fairly or equitably they allocate seats to parties, but these laws also allocate seats to candidates within parties. Our interest is in whether electoral laws encourage party-based or candidate-based voting. Control over the ballot (for example, open-list vs. closed-list systems), vote ‘pooling’ and how votes are cast (for candidates or for parties) can all make electoral systems relatively more candidate or party oriented. Such differences have been studied previously primarily because they influence the extent to which candidates have incentives to develop personal relationships with constituents.Footnote 20 We focus on a second consequence of this difference: the degree to which voters are required to learn new information each election. It should be more difficult for citizens to vote correctly in candidate-centred political systems, compared to more party-centred systems, for the simple reason that the particulars of each new candidate must be learned anew, while party reputations are much more stable, and party affiliation provides a valuable heuristic cue for many voters. We employ Carey and Shugart'sFootnote 21 rank ordering of electoral systems in terms of the degree to which candidates have incentives to distinguish themselves from their political parties. We hypothesize a negative relationship between systems that encourage a Personal Vote and correct voting because the informational demands on voters must in general be higher in those systems.
Since the classic work of Duverger,Footnote 22 political scientists have known that electoral laws strongly influence the number of parties that compete in an election. Time and again, studies find that proportional representation systems have more competitive political parties than majoritarian systems.Footnote 23 Political scientists have studied how the number of competitive parties (the electoral ‘supply’) influences a wide variety of potentially interesting dependent variables, including strength of partisan attachment, political efficacy, turnout and other types of political behaviour, how actively parties campaign, party polarization, the likelihood that extremist parties will be represented in government, and how satisfied citizens are with democracy.Footnote 24
We focus on a different consequence of the number of parties. All else equal, the greater the number of parties/candidates running in an election (and thus the greater the number of alternatives voters must consider), the more information must be gathered, the more difficult the choice, and consequently the lower the expected probability of a correct vote. This hypothesis comes directly from the decision-making literature,Footnote 25 but has also been recognized in political scienceFootnote 26 and has already found considerable support in the case of American presidential electionsFootnote 27 We operationalize this concept using the familiar Effective Number of Electoral Parties (ENEP)Footnote 28 measure, which we extend using the same formula to the results of presidential elections, but we need not invoke any sophisticated theory of party system structure to make this prediction. Even if voters chose randomly, we would observe higher levels of ‘correct’ voting with fewer alternatives on the ballot. That is, in politics or any other domain, the more alternatives there are, the harder it generally is to select the best one.
An equally straightforward extension of the behavioural decision-making literature suggests that the more distinctive the alternatives are, the easier it is for voters to distinguish between them, and thus all else equal, the greater the probability of a correct vote. Some scholars have begun referring to this as ‘party polarization’ without the pejorative overtones that term has become associated with in the American context,Footnote 29 but we prefer the clarity of party choices, or more simply, Ideological Distinctiveness. Again, Lau and Redlawsk have already found support for this hypothesis in the rather ideologically restrictive context of American presidential elections, and we can only expect even more support in electoral systems that encourage greater ideological variation among parties. This concept is measured by Dalton'sFootnote 30 party polarization index, which is roughly the standard deviation of the distribution of parties along the ideological dimension. The larger this index, the greater the variance of party ideologies and the easier it ought to be to distinguish between the available alternatives on ideological grounds.
When institutional arrangements make it clear who is in control of government, and thus who is responsible for government successes and failures, motivation to reward or punish those in power should increase, as should the desire to make a good decision. When institutional arrangements and/or election results blur the lines of responsibility, however, they also decrease the expected tangible consequences associated with the election, thus reducing incentives for voters to try very hard to figure out how to vote. At first blush we might think this difference coincides with presidential vs. parliamentary systems, but this is too gross a distinction.Footnote 31 The president's party may also control the legislature (‘unified’ government) or share power with another party (‘divided’ government). Likewise, parliamentary governments can be controlled by a single majority party (as is often the case in ‘British’ parliamentary systems, although not in the current British government) or by a coalition of several smaller parties. We employ a simple dummy variable to operationalize Clear Lines of Responsibility, distinguishing between parliamentary systems with single majority parties and presidential systems of unified government (coded 1), and parliamentary systems with coalition governments and presidential systems with divided government (coded 0).
Our theoretical framework for predicting correct voting thus includes individual differences that reflect ability, experience, motivation, constitutional factors, party system characteristics and the nature of the incumbent government. Our interest here is limited to a relatively short period of time – an election campaign, say – but we acknowledges the likely presence of certain relationships that would have a longer time horizon – for example, socio-economic status should be associated with both political sophistication and political experience; laws could influence the nature of a person's political experience, the level of their motivation and so on.
Method
Lau et al.Footnote 32 were able to compare levels of correct voting across recent US presidential elections because the American National Election Study (ANES) survey data includes a large ‘core’ of items that were asked in an identical manner across election years. Although not all items were asked in every election year, enough of them were that Lau et al. did not hesitate to make cross-election comparisons. While high-quality survey data are certainly available from national elections across numerous other advanced democracies around the world, making a case for even conceptual similarity of these questions across different national election studies becomes much more problematic.
Fortunately, the CSES data is designed to overcome this difficulty by establishing a common set of questions that is asked in an identical manner in election surveys cross nationally. We examined every Module 1 and Module 2 survey in the CSES in which, as in presidential elections in the United States, the head of government was being elected. The major trade-off in using the CSES data is that there is a relatively small number of questions asked in its core. While Lau and Redlawsk were able to employ an average of twenty-three criteria from the ANES data to calculate correct voting in the United States, we have far fewer available from the CSES core – essentially only three. Still, there are solid estimates of retrospective performance evaluations,Footnote 33 policy (ideological) considerationsFootnote 34 and basic historical party-based attachmentsFootnote 35 from the CSES data that we hope will be enough to reliably estimate correct voting. If we had to limit ourselves to only three considerations, it would be these three.
Together, these considerations provide a mix of instrumental and more expressive benefits or ‘utility’ to citizens. Correct voting makes no attempt to distinguish between different types of utility, or to tell people what criteria should be important. If a voter indicates that he or she cares about a given criterion (usually by answering survey questions about it), and that criterion can be objectively applied to all of the different alternatives under consideration, we will include it as a standard for determining a correct vote.
-
(1) Retrospective performance was measured in Module 1 by combining evaluations of the current state of the country's economy and judgements about change in the economy over the past year. For Module 2, these questions were modified to refer to how well the government handled the problem the voter ‘cared the most about’. Favourable evaluations were assumed to impact positively on evaluations of the incumbent candidate or party (and in the case of governing coalitions, to impact positively on all members of that coalition), and to impact negatively on evaluations of all challengers. Negative evaluations were assumed to have the opposite effects.Footnote 36 Thus following Lau and Redlawsk's normative naive procedures, this criterion combines objective or normative components with respondents’ own evaluations and opinions into a criterion for determining correct voting.
-
(2) Respondents placed themselves on an 11-point left-right ideology scale, which we used as a measure of ideological self-identification that, in the absence of more specific questions, we use as a proxy for prospective policy-based considerations. The survey researchers provided expert judgements about where the political parties stand on the left-right scale, and we combined these expert judgements with respondents’ own ideological self-placement to construct ideological closeness scores to each of the major political parties.Footnote 37 Again, this criterion combines both objective (expert judgement) and subjective (self-placement) evaluations.
-
(3) Respondents were asked whether they usually think of themselves as close to any particular political party in their country, and if so to state how close they felt to each party.Footnote 38 Party identifications are usually learned from parents, often reflect basic social divisions within a society and are primarily expressive in nature. This identification is completely subjective – that is, the closeness evaluations come entirely from each individual respondent, and it is easy to match them to the different parties or candidates competing in an election.
These three variables are all standard predictors in the vote choice literature, although some authors see performance evaluations as mostly partisan rationalizations and others think that party identification, in many multiparty systems, is little more than a restatement of the vote choice. If these reservations applied to large numbers of our survey respondents, then multiparty systems would be positively (though artificially) related to correct voting. As will soon be seen, however, the results are just the opposite. Thus while we certainly reject the overly simplistic view of party identification as a permanent ‘unmovable mover’ of political attitudes and behaviours that is never influenced by political events or past behaviour, we nonetheless believe that for most voters in the run-up to an election, party identification is reasonably exogenous and plays both a direct and often an indirect causal role in determining a vote decision.
Each of these three measures was re-scaled to range from 0 to 1. We then combined the party, ideology and performance judgements into summary ‘utility scores’ associated with each of the major political parties or candidates running in the national election.Footnote 39 We do this in two slightly different ways, first treating each of these three criteria equally, then using a weighting scheme that treats each criterion of judgement somewhat differently, depending on both subjective individual and aggregate-level differences between respondents and countries (see Appendix A for details). The weighting scheme, consistent with various ‘heterogeneous’ models of vote choice,Footnote 40 assumes that party, economic or ideological considerations should be more important, for some voters or in some electoral or institutional contexts, than others. Notice, however, that before any weighted or unweighted mean utilities are calculated, voters tell us which considerations of judgement are important to them by their answers to the survey questions. If a respondent says they do not feel close to any political party (48.8 per cent), or they do not place themselves on the left-right ideology scale (16.4 per cent), or they cannot make a performance evaluation about the incumbent party (3.0 per cent), that criterion does not factor into determinations of which party is correct. If respondents answer any of those questions, however, the criterion is applied equally to every party or candidate in the choice set. We assume that respondents should have voted for the alternative associated with the highest utility. We then compare our judgement of which candidate is correct with the respondent's reported vote choice to calculate overall rates of correct voting in an election.Footnote 41
Let us be clear in distinguishing between correct voting and ‘sincere voting’ – that is, voting for the candidate you like best.Footnote 42 We use the term ‘utility’ rather than ‘evaluation’ to help keep our meanings distinct. From our perspective, voters could choose the party or candidate they ‘like’ the most and still vote incorrectly. Of course, they might also rationally choose to vote for a less preferred party if they believed that party had a better chance of actually winning a seat. Unfortunately we do not have the survey questions to include such ‘strategic’ concerns in our determination of which candidate is correct. We address the relationship between ‘strategic voting’ and correct voting more fully below.
We have put a great deal of effort into assuring ourselves that these three considerations do a surprisingly good job of faithfully representing the original concept introduced by Lau and Redlawsk. We reserve the details for online Appendix B, but briefly we have located the full national election studies for nineteen of the sixty-nine elections studied here, and operationalized correct voting with the much larger number of potentially relevant considerations (on average, just under twenty) within each individual country. This comparison produces two major results. First, relative to a measure of correct voting based on the much larger number of items available from the full national election studies conducted in these countries, the measure available in the CSES data overestimates levels of correct voting by an average of 10 per cent.Footnote 43 Secondly, the relative rankings of these nineteen elections produced by the two different measures strongly agree with each other (r = 0.77, p < 0.001) and the individual-level variables that predict them are very similar across the two different operationalizations. For the purposes of this article, to identify the individual- and institutional-level predictors of correct voting, the latter finding is far more important. As we discuss in the online appendix, any measure based on twenty considerations has to be more reliable than a measure based on only three considerations, and all else equal we would always prefer the more reliable measure. But all else is not equal. The more reliable measure is only available to us for nineteen elections from nine countries, which greatly limits the breadth of institutional variation that can be invoked to explain cross-national differences in observed levels of correct voting. We could expand the number of elections by adding election years outside those included in the CSES data, but could not greatly expand the number of countries under consideration. We therefore now analyse the CSES data to take advantage of this greater institutional-level variation, while acknowledging that measurement of the dependent variable is less than ideal and that, for this reason, our findings are preliminary.
Online Appendix C provides detailed information on scale construction and data sources for aggregate-level predictors. Because the scale of the individual-level survey variables is arbitrary, we have recoded them to have a 1-point range. However since most of the higher-level variables are familiar and widely available to researchers in the discipline, we therefore keep their original scale (see Online Appendix Table C1). With the standard rule of thumb that one should have at least ten cases per predictor, we should include at most seven higher-order predictors.Footnote 44 All analyses presented below conform to these guidelines.
We test these hypotheses with a non-linear multilevel model using the program HLM6,Footnote 45 in which the individual-level predictors are all nested within elections. The dependent variable, correct voting, is dichotomous, and our hierarchical model involves a logit link. We employ robust standard errors. We report results from the weighted version of correct voting because it seems more likely to represent the way people actually make such decisions, but repeat all analyses with the unweighted variant as a check on the robustness of the results. There are 72,328 Level 1 survey respondents in our analyses, divided across sixty-nine elections in thirty-three different democracies (Level 2).Footnote 46
Before presenting the results we want to address one further issue. Our standard procedure treats all incorrect votes as if they were equally wrong, but with three or more parties in the choice set, it is easy to imagine that one could vote for a party that by our calculations has only slightly less utility than one's ideal choice, or vote for one that has considerably less utility. Somehow we would like to capture this ‘degree of error’ variation, but in practice this proves to be impossible to do convincingly. The basic problem is that ‘utility’ is a joint function of the individual voter's values and beliefs and the objective placement of the available parties on the criteria of judgement. This variation means that even voters in the same election do not face the same difficulty of choice. The correct choice is a unique calculation for every individual voter. Thus while there is always a best choice (the correct vote) and a worst choice for every voter (and with more than two parties, often choices that fall somewhere in between), making the ‘distance’ between best and worst somehow quantifiable, and thereby comparable across respondents, is virtually impossible. We therefore limit consideration to a dichotomous dependent variable that indicates whether voters chose the party or candidate that was best for them. Distinguishing between the egregiousness of the errors made by different incorrect voters is a topic for future research.
Results
Mean Levels of Correct Voting Across Sixty-Nine Elections
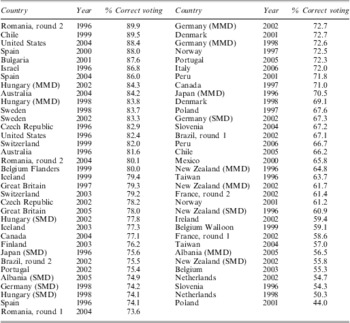
Table 1 presents our estimates of correct voting in sixty-nine head-of-government elections across thirty-three different democracies, including evidence from two rounds of voting for three elections for which we have the data, and evidence from both a single-member district (SMD)-based vote and a multimember district (MMD) proportional vote from countries with a ‘mixed’ electoral system. It varies between a low of only 44 per cent in the 2001 election in Poland to a high of almost 90 per cent in round two voting in the 1996 presidential election in Romania, with an overall mean across these sixty-nine elections of 72.3 per cent and a standard deviation of 10.6 per cent. This is the basic data our theory aims to explain; there is clearly considerable variation across elections to be explained.
Correct Voting Across Sixty-Nine Elections in Thirty-Three World Democracies

Note: Reported levels of correct voting average across the weighted and unweighted versions of the measure described in the text.
Looking at cross-election variation within countries, we see that in most cases, estimates of correct voting are quite stable over time – in a few cases (the MMD elections in Germany and Hungary; Great Britain, Sweden) amazingly so. Across the twenty-six instances of multiple elections within countries in our dataset, the mean absolute difference in estimated levels of correct voting is 6.3 per cent. Although some of this discrepancy is undoubtedly due to sampling error, some of it may also be due to systematic changes in the political environment or the nature of the political options offered to voters. Either way, this leaves even more of the variance to be explained by cross-national differences in electoral institutions.
Explaining Cross-National Variation in Correct Voting
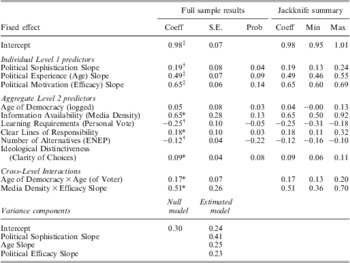
Table 2 presents the results of a non-linear multilevel model that predicts cross-national levels of correct voting, which is the primary focus of this article. As all of our hypotheses are directional, a one-tailed significance level is appropriate. The model includes the three individual-level predictors, each of which has their hypothesized effect: the more sophisticated voters are, the more experience (age) they have, the more motivated (efficacious) they should be to make good decisions and the higher their predicted probability of voting correctly should be. Holding all other predictors at their mean or modal value (and thus starting from an overall mean of 72.6 per cent), moving from the lowest to the highest value of political sophistication increases the probability of a correct vote by about 4 per cent. Sixty years of political experience increases the probability of a correct vote by over 9 per cent, and the most efficacious are about 14 per cent more likely to vote correctly than the least efficacious. The estimated effects of political experience and political motivation are very similar to what Lau et al.Footnote 47 found in the United States, but political sophistication has a much smaller effect in the CSES data than Lau et al. report from the United States, which we suspect is due primarily to a weaker measure of political knowledge in the CSES data (based most frequently on correct answers to three factual questions, compared to an average of over twenty in the typical ANES survey).
The estimated multilevel model also includes six institutional level predictors, and they are our primary focus here. The number of years a country has been democratic (logged) has its hypothesized positive effect, but one that is about half the size of its standard error and thus not reliably different from zero. But this is the only institutional-level predictor in the model that did not at least approach conventional levels of statistical significance. In contrast, the greater the availability of political information (represented by Density of the Media Environment), the higher the predicted probability of a correct vote by about 13 per cent, all else equal.
Governments that provide voters with clear lines of responsibility – parliamentary systems with a single majority party, or presidential systems with unified executive and legislative branches – increase correct voting by almost 3.5 per cent, while electoral rules that encourage personal (as opposed to party) voting and thus require new learning each election decrease correct voting by about 5 per cent.
The strongest institutional-level variable is the number of political parties. When there are only two alternatives on the ballot, all else equal the model predicts almost 79 per cent correct voting, but when there are nine alternatives competing in an election, the probability of a correct vote drops precipitously to under 57 per cent. This is by far the largest effect present in our data. Voters are nonetheless doing considerably better than chance, but this demonstrates that the number of political parties has a huge estimated effect. However, the ideological distinctiveness of those alternatives works in the opposite direction and helps mitigate against the pernicious effect of too many alternatives in the choice set, increasing the probability of a correct vote by almost 8 per cent when the parties are, on average, most distinct.
There are two hypothesized cross-level interactions in our model, and they both prove to be significant. All else equal, young people have a relatively hard time voting correctly no matter how long their country's democracy has been in place. But in well-established democracies, a full adult lifetime of political experience can increase that probability by 14 per cent, compared to only 9 per cent in new democracies. Further, when media density is at its lowest observed level, political efficacy increases the probability of a correct vote by about 8 per cent. But as predicted, when media density is at its highest level and efficacy can logically be expected to have its strongest impact, this figure almost doubles to 15 per cent.
Incentives for Strategic Voting
In some cases, as mentioned earlier, citizens might consciously choose a less-preferred party or candidate in order to keep a more disliked alternative from winning. Although in theory such ‘strategic’ concerns could be incorporated into the determination of correct voting, in practice we do not have the survey questions available to do so. This opens the possibility that some voters who we have categorized as voting incorrectly would (and should) have been counted as voting correctly if the CSES surveys had included the necessary questions. No measurement is perfect, of course, but if our methods systematically miscategorize strategic voters as incorrect, then we will (1) underestimate the overall level of correct voting and (2) possibly incorrectly conclude that certain institutional characteristics are associated with lower levels of correct voting when in fact they are associated with greater incentives for strategic voting.
To explore this possibility, we have searched for aggregate-level indicators of incentives for strategic voting in our basic model presented in Table 2. If any of those indicators are statistically significant, we will know we have underestimated overall levels of correct voting. If, moreover, any of the important higher-level predictors in Table 2 lose their significance (or worse yet, change their sign), we will know that the basic model presented in Table 2 suffers from serious misspecification. The most obvious possibility is Mean District Magnitude, the average number of seats that are selected from each electoral district. The larger this number, the more ‘fairly’ votes can be translated into seats, and the lower the incentives for strategic voting.Footnote 48 If strategic considerations are confounding our estimates of correct voting, this variable should have a significant positive effect in our model. It does not. In fact the coefficient is negative (−0.06) and significant (see Online Appendix Table C2). We also considered Gschwend'sFootnote 49 scheme for ranking electoral systems according to how many incentives for strategic voting they provide. High incentives for strategic voting should be associated with less correct voting, according to this logic. But adding a dummy variable to the equation, thus isolating those elections with strong incentives for strategic voting, again proves disappointing. The coefficient is positive (0.01) – again, the opposite of the prediction – and much smaller than its standard error. We can only conclude that strategic voting, no matter how prevalent it may be in the CSES elections, is not systematically confounding any of the basic results reported here.
Multilevel Analysis of Correct Voting Across Sixty-Nine Elections and Thirty-Three Democracies

*p < 0.05; † p < 0.01; ‡ p < 0.001
Note: N = 72,328. The first two columns of the table report the final estimation of the fixed effects from the population-average non-linear multilevel model with robust standard errors and a logit link. The third column reports the change in the predicted probability of a correct vote when each predictor ranges from its lowest to its highest value, holding all other variables in the equation at their mean or modal value. We report the population average rather than the unit-specific results because the former are based on fewer assumptions, but in practice the two differ very little. Because all hypotheses are directional, significant levels are one-tailed.
Robustness Checks and Supplementary Analysis
Our results are very robust to alternative specifications of the basic model and different operationalizations of our primary predictors. Measuring cognitive ability with just political knowledge produces very similar results, although we lose half a dozen elections from the sample in which no knowledge questions were asked. Using years of education by itself produces a positive coefficient, but one that is not much larger than its standard error, so some element of political expertise seems to be important for maximum effect. Replacing respondent's age and the age of democracy X respondent age cross-level interaction with a single measure of the number of years respondents have lived in a democracy produces a rather convoluted variable, but one that has a significant positive effect. Using Freedom House's measure of freedom of the press has much the same effect as our scale of media density. Measuring the number of alternatives simply by counting the number of parties or candidates that received more than 5 per cent, or 10 per cent, of the vote rather than the more complicated ENEP measure does not affect things much. Nor does replacing the polarization measure of ideological distinctiveness with a more straightforward measure of the ideological range represented by the major parties in an election. At a reviewer's urging we considered several additional cross-level interactions, including sophistication by information availability and experience by information availability, but none of them even approached conventional levels of statistical significance.
We could think of no theoretical reason for gender to be related to correct voting, but it is measured in all of the surveys and we did include it in supplementary models. Females were slightly more likely to vote correctly, but not significantly so. We did speculate that gender might become a more important predictor in countries with greater female representation in the national legislature,Footnote 50 but in fact the percentage of female legislators has the opposite effect, significantly decreasing an already-small gender difference.
Does the presence or prevalence of referenda and initiative at the national level produce a more politically engaged electorate with higher levels of correct voting, as proponents of direct democracyFootnote 51 would seem to argue? No. And most importantly, given its strong association with greater satisfaction with democracy, the strength of the economy does not systematically translate into higher levels of correct voting. Whether we are talking about gross national product (GNP) per capita during the election year, change in GNP per capita over the past year or the past ten years, or the openness of a country's economy to world trade, again the answer is no. Correct voting has little or nothing to do with the state of the economy.
We replicated all of the analyses discussed above with the unweighted version of our dependent variable, and again the results proved quite robust against this slightly different operationalization of the dependent variable (see Table C2 in the online appendix). We also replicated all of our results with a technically more appropriate three-level model (with individuals nested within elections nested within countries), but again the results are hardly any different.
There is also a legitimate concern that, by restricting the measurement of correct voting to the three indicators employed here, we may be missing crucial determinants of vote choice in particular elections. Let us emphasize again that such restriction is by necessity, not by choice. We are very definitely not offering the three-item measure employed here as the gold standard for operationalizing correct voting. We would always rather have more, rather than fewer, considerations upon which to base this judgement. Surely there are election-specific factors in some of these elections that are not well captured by the party, ideological and retrospective considerations available to us, which would therefore lead some voters in those elections to be incorrectly categorized by our methods. This is another way of saying that a three-item measure is going to be less reliable than a 20-item measure. The issue is not whether we have measurement error in our dependent variable (for surely we do), but whether such errors are going to systematically occur more often in some countries or electoral contexts than others.
To assure ourselves that this possibility is unlikely to occur, we conducted a jackknife analysis by randomly dividing our sixty-nine elections into ten mutually exclusive groups; after systematically eliminating each of the groups one at a time, we re-estimated the basic model in the remaining 90 per cent of the cases.Footnote 52 If any of the basic results in Table 2 are being driven by one or two outlying cases in which our standard measurement of correct voting simply does not fit, we should be able to see this in the jackknife results. The last three columns of Table 2 report the mean estimate and the observed minimum and maximum estimates of each of our coefficients across the ten replications of the analysis. In every case these means are very close to the original full-sample estimates, and rarely do any of the significant effects lose their significance in the jackknife sample. There simply is no hint in any of these analyses that the results are being driven by a few problematic cases.
Discussion
All voters in a democracy, we contend, deserve to have their political concerns – their basic social identifications, their retrospective performance evaluations and their more forward-looking policy orientations – represented by their political system. Our measure of correct voting tries to capture these considerations. This is a normative judgement, an assumption we make at the outset. Granted this assumption, we ask what individual- and system-level factors make it more or less likely that they will be.
We find substantial support for ten of our eleven hypotheses: three at the individual level, five (of six) at the institutional level and two involving cross-level interactions. As predicted, more sophisticated voters, more experienced voters and more highly motivated voters all had a higher probability of voting correctly. These results replicate past findings from US elections. Together, holding the institutional predictors at their mean or modal value, but setting the three individual-level predictors at their lowest values (no sophistication, experience or efficacy), results in a predicted probability of voting correctly of only 0.55; setting these three variables at their highest value raises the expected probability to 0.83, a very substantial increase due entirely to individual-level factors that citizens would carry with them in any political system.
We also found that most of the hypothesized institutional-level predictors also had a significant impact on levels of correct voting. In particular, larger numbers of alternatives confronting voters, and electoral rules that encourage personal rather than party voting (and thus increase learning requirements), both decrease estimated levels of correct voting. On the other hand, a rich media environment that ensures easy access to political information, clear lines of responsibility for government actions (which should increase the motivation to make a good decision) and greater ideological distinctiveness among the competing parties or candidates are all associated with higher levels of correct voting. Only the number of years a country has been democratic did not have its hypothesized effect on correct voting, although this variable did have a significant cross-level interaction with political experience (that is, Age). Similarly, Media Density conditions the effect of motivation (Political Efficacy) on correct voting. Together, these results provide strong construct validity for our CSES-based measure of correct voting applied in a comparative context.
More importantly, these results point to the significance of institutional factors in determining the probability of a correct vote. A recent compilation of papers using the CSES data to explore various aspects of political attitudes and behaviour concluded that individual-level factors dominate, and that the effects of political institutions are ‘modest’.Footnote 53 Holmberg summarizes this finding best: ‘The electoral system matters, but it does not matter much.’Footnote 54 Because our dependent variable is dichotomous we cannot allocate variance between individual- and higher-level factors as neatly as one could with a linear model, but the effects of a ‘full dose’ of each predictor reported in Table 2 already hint at the importance of institutional factors on correct voting. We reported above that the three individual-level factors together increase estimated levels of correct voting from 0.55 to 0.83 when they vary from their lowest to their highest values, holding the higher-level factors at their mean or modal value. If we conduct a similar exercise with the institutional factors, holding the three individual-level predictors at their mean while varying the higher-level factors together from their most inhibiting to their more facilitating levels, the predicted probability of a correct vote varies from 0.36 to 0.89 – virtually the entire range of observed levels of correct voting, and almost twice as important as the individual-level factors combined. Institutions do matter for correct voting – and they matter a lot.
We would argue that voting correctly is a higher normative standard than turnout by which to judge democracies because it acknowledges that even freely chosen decisions can be misguided. If voting is the primary way that citizens influence their government, and election returns provide the most immediate feedback to government officials about how well they are doing their jobs, then correct voting at its very heart is about the accuracy of the signals that are sent to elites, and thus the quality of democratic representation provided by an electoral system. The higher the level of correct voting in an election, the more likely there will be a systematic connection between what people want and how they are represented. But people cannot choose wisely if they do not have the motivation to gather enough relevant information to make an informed choice, or if that information is not credible or easily available. Voters mindlessly parroting back the views of a political elite is not our sense of a successful democracy, even if a high proportion of eligible citizens were to show up at the polls on election day. To state this position as strongly as possible, voting by itself provides only the illusion of democracy; voting correctly provides true democratic representation.
But we would never say that turnout is irrelevant to the health of a democracy, and our statement about the greater accuracy of the signal sent to elites when more people are voting correctly assumes that the elites listen just as closely when turnout is 50 per cent as when it is 90 per cent – an assumption that seems pretty unlikely. Clearly, both correct voting and turnout are very important to the health of a democracy, but the measurement of correct voting is, by definition, limited to the actions of voters. Perhaps the next step is to somehow combine the decision to vote in the first place with the wherewithal to vote correctly. The two could work at cross purposes, with higher turnout bringing more less-knowledgeable and less-motivated voters to the polls (particularly if that turnout were coerced), which should then decrease levels of correct voting. But this is a topic for future research.
What are the implications of our results for assessing the quality of democracies around the world today, and what might concerned citizens or governments do to try to improve it? By our measure, approximately 73 per cent of citizens in the CSES samples voted correctly across the sixty-nine elections in our study. Is this number lower than some democratic ideal? It is difficult to say. If citizens voted randomly, we would expect somewhere between 27 per cent and 37 per cent correct voting in those same sixty-nine elections given the number of alternatives they face, so citizens are doing a lot better than chance. Surely we cannot expect 100 per cent correct choices on any complex decision, but even in countries where almost everyone votes, many people are still not voting correctly. Our results provide some hints as to why many citizens who care enough to vote still do not choose the party or candidate who best represents their interests and concerns. And they suggest some institutional changes that could increase overall levels of correct voting – and thus democratic representation.
While the United States has historically been quite reluctant to change its constitution, citizens of many other countries do not see it the same way. Italy, Israel, Japan and New Zealand have all undergone fairly major revisions of their electoral systems in the past decade or two. We would argue that high levels of correct voting – and the resulting more accurate representation of citizens’ wishes – is a criterion that all democracies should strive to achieve, and countries contemplating changing their electoral rules might look to our findings for guidance.
Consider the party list vote in Hungary in 2002, a relatively new democracy with a coalition government (and thus somewhat obscured lines of responsibility) that nonetheless experienced relatively high levels of correct voting. Voters in Hungary benefitted from a relatively small number of ideologically distinct parties. If those two variables changed to the sample means, our model predicts that correct voting in Hungary would have decreased by about 7 per cent. Or consider the presidential election in Peru in 2006, in which the observed level of correct voting is clearly below the sample mean. Voters in Peru had experienced a period of divided government, but if only the lines of responsibility had been more clear in 2006, our model predicts an increase in the level of correct voting of about four points from this variable alone.
Voting correctly, as we conceive it, by no means assures the stability or welfare-enhancing effects of a democratic system. That will depend, among other factors, not only on whether voters choose the candidates closest to their preferences, but also on what their preferences are, and on the aggregate effects of those preferences. But informed electoral choices are a sine qua non of any fully democratic system, and it should come as no surprise that some systems can provide those choices more easily than others. To the extent that democratic governments provide benefits to their citizens because of their ability to aggregate citizen preferences, we need a means to assess the accuracy of that aggregation process. In this article we have shown that correct voting provides a valid tool for making that judgement, and thus can be employed to assist lawmakers who seek to improve the calibre of democratic representation in their country by institutional reform.