We present a useful tool for augmenting bilingual research: a quick, easy-to-implement scale that can assess how much a participant leans towards one language or the other. We first describe why such a tool might be useful. We then describe the development of the scale we propose. Finally, we provide data from a word translation experiment and a sentence translation experiment that support the use of the scale. In the general discussion, we will illustrate how use of the scale can draw a different picture from the one obtained from dichotomous analyses.
When considering bilingualism globally, perhaps the only thing to be counted on is a diversity of experiences. Frequently, first languages (L1s) are the languages that are spoken at home, taught in schools, printed and heard in the national media, and used in daily commercial interactions, such as banking or shopping. Second languages (L2s) are often the languages that people learn deliberately, in school, for some future potential use. This describes the experience of American English speaking students who study French in high school, perhaps with an eye towards study abroad in Paris. A slightly different version has school L2s being learned for economic advantage (Graddol, Reference Graddol1997). This describes L2 learning in countries with few L1 speakers internationally-speaking. In these communities, international commerce or academic engagement requires facility with a major world language. Yet another version has people learning L2s because the L1s they speak are denigrated on the local or world stage. The power of a prestigious L2 can even eclipse an L1 spoken by the majority of a population; in Jamaica, students struggle to learn the official language, English, over their L1, Jamaican (Pryce, Reference Pryce1997).
Another view of bilingualism is illustrated by cross-linguistic immigrant groups. In many of these cases, L1s are the languages that are spoken at home and within minority cultural and linguistic enclaves, and L2s are the languages used in schools, media, and commerce. This describes many situations in the U.S. Although there is no official national language, English is widely accepted as the language necessary for economic and scholastic advantage. Although English is taught in schools as an L1 or L2 for all children, there are linguistic enclaves in the U.S. that are so large that a non-English L1 speaker can live a lifetime without learning English (Chiswick and Miller, Reference Chiswick and Miller2002). Generally, however, non-English L1 speakers in the U.S. are destined to be in lower-paying jobs (Chiswick and Miller, Reference Chiswick and Miller1995, Reference Chiswick and Miller2002).
A special category of bilingual speaker is the simultaneous bilingual speaker. The term simultaneous bilingual was originally introduced to describe bilingual language learners whose parents each spoke one language to them as children (Diaz, Reference Diaz1983). In theory, simultaneous bilingual speakers would learn both languages at the same time with the same relative frequency of use. In practice, simultaneous bilingual speakers may have differences in fluency depending on the fluency of each parent, the language used outside of the home, or the true level of distinct language use between parents and between parent/child interactions (Nicoladis, Mayberry and Genesee, Reference Nicoladis, Mayberry and Genesee1999). Often the term simultaneous bilingual is now used to describe many second-generation bilingual language learners within an immigrant family (see Hamers, Reference Hamers2004, p. 88, for an example of this conflation). The scale we developed is useful for both interpretations of simultaneous bilingual.
To summarize, people can learn an L2 as a supplemental language, or as a necessary language. They can learn their L2 as children in an L1 school, or as children in an L2 school. They may be able to read and write only in their L1, or only in their L2. They may use their L1 only at home or within their minority language community (Hakuta and D'Andrea, Reference Hakuta and D'Andrea1992). They may gain, maintain, or lose fluency in either their L1 or L2 throughout their lifetime as a result of shifting language attitude (Hakuta and D'Andrea, Reference Hakuta and D'Andrea1992; Gibbons and Ramirez, Reference Gibbons and Ramirez2004), economic shift and movement away from enclaves (Chiswick and Miller, Reference Chiswick and Miller2002), or widespread use of one language over the other. Indeed, immigrant populations tend to fully shift toward the majority language (often L2) by the third generation (Pease-Alvarez and Hakuta, Reference Pease-Alvarez, Hakuta, Phelan and Davidson1993; Tannenbaum, Reference Tannenbaum2003).
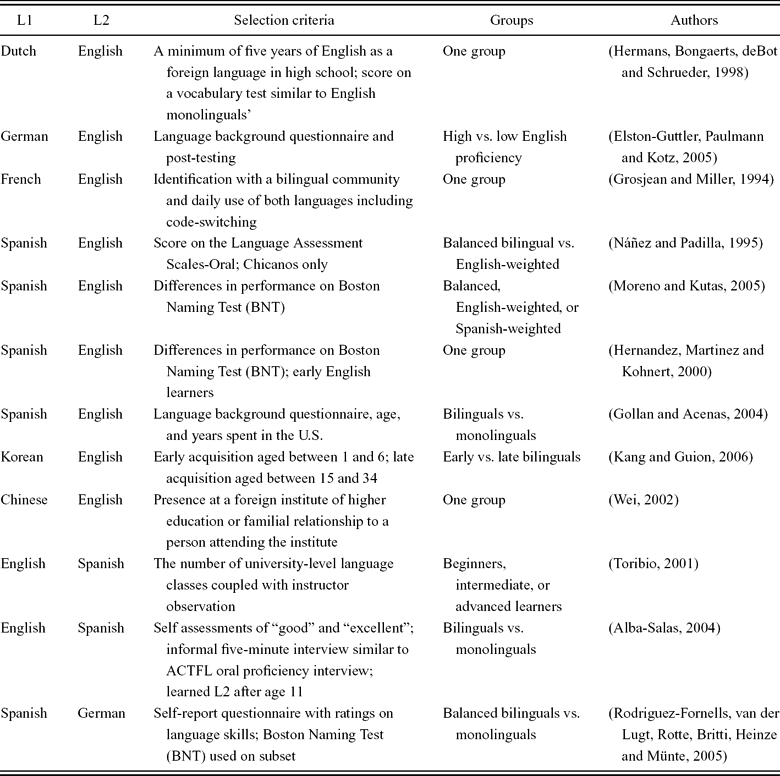
Despite the clear diversity of skills regarding facility with L1s and L2s, almost all researchers of bilingualism either describe participants in dichotomous terms (such as bilingual or not bilingual, balanced bilingual or non-balanced bilingual, or Spanish-dominant or English-dominant) or reflect their research back to bilinguals as a whole while only testing one facet of the spectrum of bilingual speakers. Table 1 illustrates some of the divergent approaches researchers have adopted in defining and selecting bilingual participants. Although simple dichotomies are sufficient for many research purposes, a speaker's strength in each language may affect performance in predictable ways.
Selection criteria and groupings in some previous bilingual studies.

A thorough overview of a wide range of methods for identifying bilinguals suggests that quick measurements of (i) age of acquisition (AOA) and (ii) L1 use successfully model language dominance as assessed by more time-consuming information obtained from translation tasks, mean sentence duration tasks, accent assessment, and self-ratings (Flege et al., Reference Flege, MacKay and Piske2002). But the AOA and L1 use divisions are not sensitive enough to place bilinguals on a scale of greater or lesser fluency, or greater or lesser dominance. A gradient scale has the potential to highlight aspects of bilingual behavior and performance that a dichotomous scale might mask.
One gradient fluency score was developed by Hakuta and D'Andrea (Reference Hakuta and D'Andrea1992). Each participant completed one of three tests: a productive vocabulary test, a grammatical errors test, or a cloze test where participants filled in the missing words to a story. Scores were standardized across tests and compared to a subset of participants’ performances on either a picture naming task (labeled “production task”) or a picture-word matching task (labeled “recognition task”). The more participants got right on the cloze task and the more words they were able to generate in the productive vocabulary task, the faster their responses on the production and recognition tasks. Furthermore, the higher people rated their proficiency at speaking, understanding, reading, and writing, the better their performances on the productive vocabulary test, grammatical errors test, and cloze test. This gradient score does not take into account an individual's relative proficiency in each language, however; English scores and Spanish scores were correlated separately. So these measures cannot elucidate relationships between dominance and performance.
Other language proficiency questionnaires have similar pitfalls with respect to quick and easy implementation, quick and easy scoring, and adaptability to nonliterate speakers. The Language Experience and Proficiency Questionnaire, LEAP-Q, evaluates each language independently, requires “high-school levels of literacy”, and takes about fifteen minutes to complete (Marian, Blumenfeld and Kaushanskaya, Reference Marian, Blumenfeld and Kaushanskaya2007, p. 962). The online language history questionnaire of Li, Sepanski and Zhao (Reference Li, Sepanski and Zhao2006) has twenty-nine questions, many with multiple parts, and no gradient measure of language dominance.
The dominance issue is particularly important for participants who are in the process of restructuring their languages (Grosjean, Reference Grosjean1998). Restructuring is when a bilingual speaker gains fluency in a second language while losing fluency in the first language (Grosjean, Reference Grosjean2002). For example, immigrant bilinguals often restructure their fluency toward their second language while losing some fluency in their first language. Similarly, bilingual participants who have recently moved to a new area, or entered a new working or educational arena, can often lose or gain lexical or syntactic knowledge in one or both of their languages (Grosjean, Reference Grosjean1998). Many researchers test participants who are highly likely to be in the process of restructuring one or both of their languages: high school and college age students in their mid-teens to early twenties experiencing a shift in living and work communities. In fact, Hakuta and D'Andrea's (Reference Hakuta and D'Andrea1992) participants might have been at the cusp of such changes (mean of 16 years of age). They were further likely to be experiencing a shift because they were recruited from Spanish as a Foreign Language classes and Spanish for Spanish-speakers classes. Assessing whether participants are restructuring or have restructured a language can add to indicators such as AOA and L1 use to give a more complete measurement of bilingual dominance. One way to assess restructuring is to include L2 use in assessing bilingual dominance. Both L1 use and L2 use usually change during restructuring, as the use of one language generally impacts the use of the other.
The quick, gradient Bilingual Dominance Scale we propose favors spoken fluency over written fluency. There are two reasons for this. One is that comparing across participants’ self-estimations of their writing abilities is problematic. Participants are notoriously bad at rating themselves (both writing and other abilities), with language ratings aligning more closely with language attitudes than actual language facility (Hakuta and D'Andrea, Reference Hakuta and D'Andrea1992). The second reason the scale favors spoken fluency is that accurate assessments of written fluency, based on tests of reading and writing ability, are time-consuming. A time-consuming test would not be a quick and easy method of assessing variable fluency in a population. On top of these two reasons, researchers and laypeople usually think of fluency in terms of ease of spoken communication; people don't generally think of themselves as bilingual with ancient Latin, for example.
In summary, direct writing and reading measures require either self-report on a Likert scale (known to be untrustworthy) or an actual test of writing or reading (which would take time and not be a quick and easy test). The questions on our scale are grounded in memory or fact, rather than ratings. Our proxy for writing can be viewed as the answers to the education question. Education has been found to be associated with reading ability (Knighton and Bussiére, Reference Knighton and Bussiére2006).
A quick, gradient bilingual dominance scale would be useful for researchers. We used (1) information obtained from other researchers’ approaches to bilingual dominance assessment, (2) an extensive survey of over a hundred Spanish–English bilingual speakers, and (3) an Exploratory Factor Analysis to develop such a scale. In the next section, we describe this process.
The Bilingual Dominance Scale
The Bilingual Dominance Scale was developed in two phases. In the first phase, a broad survey was conducted to collect information about how bilinguals acquired their languages, how they use their languages, and how they feel about their languages, including how they feel about taking fluency tests. The survey included both open-ended and closed-ended questions. Based on the principal findings of prior research, twelve closed-ended questions assessing age of acquisition, L1 and L2 language use, and restructuring were selected for the Bilingual Dominance Scale. The questions were discriminable, not open to interpretation, and did not rely on self-assessment.
An exploratory factor analysis was carried out to look at the underlying structure of these twelve items. The primary purpose of the factor analysis was to explore whether the questions we asked measured viable constructs. The goal was to show that the twelve items were indeed gauging aspects of language proficiency. The goal was not to carry out a confirmatory factor analysis with firm constructs.
In the second phase, a point system was developed for converting responses to a scale score. The point system was developed based on a theoretical foundation from prior studies, supplemented by responses to the open-ended questions in the survey.
Phase I: Exploratory Factor Analysis
Method
Participants
One hundred and two Spanish–English bilingual participants were recruited from two University of California universities via targeted email announcements to Latino/Spanish speaking groups from each campus (80% of participants) and from the University of California at Santa Cruz (UCSC) psychology participant pool (20% of participants). Emailed participants were encouraged to send the email announcement to other Spanish–English bilinguals they knew, regardless of university affiliation or residence in the United States; nonetheless, only five participants were not affiliated with a university in California (these same five were the only five who did not reside in the U.S.). Only the online survey assessed age, sex, and ethnicity. Of these participants, the mean age was 27, median age was 26, and the mode age was 18 (range of 18 to 84), with 61% female, 66.7% Latinos, 17.3% White/Caucasian, and 16% mixed racial identity.
Materials
A 66-item questionnaire was administered via the online survey service Survey Monkey or via a paper-and-pencil survey in the lab. The extended lab survey took approximately 25 minutes to complete. The questionnaire focused on L1 and L2 acquisition, L1 and L2 current and past language use, and language restructuring due to changes in environment and choices.
There were eight demographic questions on the online survey; the UCSC laboratory participants did not answer the demographic questions (yielding a 58-item survey for them).
There were eight open-ended questions such as: “How well do you speak, write, and read in Spanish?” and “Why do you think you feel embarrassed to speak Spanish?” (the latter for those who answered that they were sometimes embarrassed). These questions were included to help us assess how to weight items.
There were 14 Likert-type questions measuring how well participants rated their language abilities for a variety of tasks, such as reading a scientific paper or discussing politics. There were two Likert-type self-assessments of fluency. These types of questions are commonly found in research assessing bilingual fluency (Li et al., Reference Li, Sepanski and Zhao2006; Marian et al., Reference Marian, Blumenfeld and Kaushanskaya2007). We planned to contrast answers to these questions with answers to the Bilingual Dominance Scale questions.
There were 34 closed-ended questions assessing when, where, and how participants acquired their languages, the number of hours participants spoke one language or another and whether this number had recently changed, whether the participants had had bilingual schooling and if so how much, whether they had gained or lost fluency, and several other questions. Some of the closed-ended questions were tied to other questions; for example, participants were asked separately whether they had ever felt comfortable speaking a language, and at what age they felt comfortable. From the closed-ended questions, 12 were selected for the Bilingual Dominance Scale. The questions were selected in part based on discriminability. For example, participants’ judgements of fluency gain were similar across English and Spanish, but their judgements of fluency loss varied greatly. These questions were also selected because their answers were grounded in memory and fact rather than self-assessment.
The 12 closed-ended Bilingual Dominance Scale questions focused on the age of acquisition and comfort in a language, how much schooling participants had in a language and their preferences for using one language over another (“language use” below), and any loss of fluency in a language (“restructuring” below). The scale can be found in the Appendix, along with a breakdown of the points per question used to calculate the composite score (as discussed in the section “Phase II: Calculation of scale score” below). Participants saw only the questions, not the scoring information.
Age of acquisition and comfort in a language was assessed with questions about (i) when participants first encountered both languages (see Flege et al., Reference Flege, MacKay and Piske2002, for evidence showing the relationship between age of acquisition and language dominance), (ii) when participants first felt comfortable speaking both languages (see Montgomery, Reference Montgomery1992, and Weisskirch and Alva, Reference Weisskirch and Alva2002, for the concept of comfort in a language), and (iii) how much foreign accent participants felt they had in each language (see Mackay and Flege, Reference Mackay and Flege2004, for evidence associating ratings of foreign accent with late versus early age of acquisition). The use of the two measures, (a) age of acquisition and (b) age of comfort, help to distinguish early bilinguals who had lost dominance in their L1 from early bilinguals who did not feel comfortable using their L1 until later in life. For example, participants may have spoken Spanish from birth, but lost fluency in Spanish when they went to college and started to speak English almost exclusively. Other participants may have also spoken Spanish from birth, but not felt comfortable using Spanish until they joined a club in college or took supplementary classes in school. An example of this can be seen from a participant in our data: “My ‘peak’ was in high school when I spoke excellent Spanish because I was in Spanish 4. We spoke fluently during class and I spoke Spanish at home with my Salvadoran mother.” Though she spoke Spanish from birth, and at home, she felt much more comfortable speaking Spanish at age 17, after having taken classes at her school.
Language use was assessed with questions about (i) which language was predominantly used at home (see Hakuta and Pease-Alvarez, Reference Hakuta, Pease-Alvarez, Extra and Verhoeven1994, for a discussion about home language use and its influence on language proficiency), (ii) which language was used when calculating a mathematical problem (see Rose, Reference Rose1980, for an examination of language of thought and fluency), (iii) where participants were currently residing (see Flege and Liu, Reference Flege and Liu2001, for evidence showing that the length of time in a linguistic environment effects proficiency), (iv) total education in years for each language (see Hakuta, Bialystok, and Wiley, Reference Hakuta, Bialystok and Wiley2003, for a discussion of how level of education impacts bilingual proficiency), and (v) which language the participant would choose to keep if they had to lose one (see Cutler, Mehler, Norris and Segui, Reference Cutler, Mehler, Norris and Segui1989, for evidence of language choice reliably predicting slight dominance). As language use is such a complex and varied concept within language fluency, the language use questions targeted a wide range of areas, allowing participants to express their differing usage patterns and choices for each language. For example, some participants used Spanish only in their home, performed mathematical equations in Spanish, but still chose English if they had to choose one language for the remainder of their life. Other participants chose Spanish if they had to choose one language yet spoke English at home and had more schooling in English.
Restructuring was assessed by asking respondents (i) whether they were losing fluency in a language and (ii) the age at which they lost fluency. Only the loss of fluency was included in the Bilingual Dominance Scale calculation. The age at which fluency was lost was retained in the survey as a potential future participant variable. In future studies, it may be important to distinguish between participants who were currently restructuring their languages and those who had restructured languages in the near or distant past.
Restructuring has not been widely tested in prior research. However, qualitative evidence from our survey data suggested that it was an important component of bilingual dominance. Of the 58% of survey participants who responded that they had lost fluency in Spanish, 42% of them reported losing Spanish fluency during their college years (17–22 years of age). Without a question gauging restructuring, these participants would appear to be as fluent in Spanish as they had been at their peak.
Current linguistic environment (which country the participant is currently residing in) has also not been widely tested in prior research. However, similar questions gauging how long participants have resided in a given country show that both linguistic environment and restructuring can affect proficiency in second language acquisition (Flege and Liu, Reference Flege and Liu2001). The current scale teases apart the contribution of linguistic environment, restructuring, and age of acquisition.
The Exploratory Factor Analysis was run on the 12 items of the Bilingual Dominance Scale.
Results
The primary tool used to explore the underlying structure of large correlation matrices is Exploratory Factor Analysis (EFA; Kline, Reference Kline1993; Fabrigar, Wegener, MacCallum and Strahan, Reference Fabrigar, Wegener, MacCallum and Strahan1999). Prior to running an EFA on the Bilingual Dominance Scale questions, a bivariate correlation confirmed that some items were correlated with each other, but not all. Furthermore, the sample size (over 100) was sufficient to continue with an EFA. A principal component analysis (PCA) was conducted to ensure that the subsequent EFA would be worthwhile (PCA analyses account for all variance in the matrices and therefore are not fully exploratory). Finally, Bartlett's test of sphericity was significant at the .001 level, χ2 (66, N = 124) = 408. This indicates that the items are not an identity matrix. The Kaiser-Meyer-Olkin measure of sampling adequacy was .81. This indicates that the sample size was large enough to proceed with the factor analysis.
A maximum likelihood Exploratory Factor Analysis with a varimax rotation was performed. The maximum likelihood method was chosen as it allows the factors to be estimated from the data, therefore allowing for error in the data, unlike with a PCA (Kline, Reference Kline1993; Fabrigar et al., Reference Fabrigar, Wegener, MacCallum and Strahan1999). The two-factor solution was chosen for the following reasons: (a) it had a stronger factor structure with fewer items loading on multiple factors, (b) an examination of the scree plot showed a clear drop after two factors, and (c) the three-factor solution did not show clear conceptual differences between the factors.
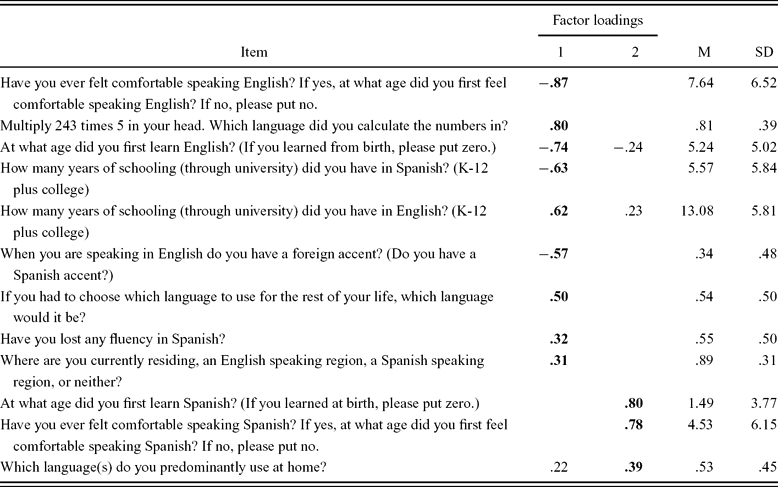
Table 2 shows the factor loadings, means, and standard deviations for each item in the EFA. The total amount of variance explained by these two factors was 43.3%. The first factor contained a total of nine items and accounted for 33.4% of the variance. This factor converged on the theme of English (L2) dominance over Spanish as L1. The second factor contained a total of three items and accounted for 9.8% of the variance. This factor converged on the theme of Spanish as L1, but not dominance. A similar factor structure was reported for a principal components analysis of Mexican-American high-school students’ language use (Hakuta and D'Andrea, Reference Hakuta and D'Andrea1992).
Maximum likelihood Exploratory Factor Analysis.

Note. Unique factor loadings >.30 in bold. Factor 1 = English (L2) dominance, Factor 2 = Spanish as L1 but non-dominant.
Discussion
The EFA results indicate that both L1 use and L2 use are important factors for the 102 participants tested, who by and large reflect the ages and life stages of most participants tested in psychological research (college students).
Results further support the use of questions aimed at language restructuring in a gradient scale of bilingual fluency. In this sample, the majority of participants used their L1 less than their L2, but have an L1 AOA of zero (birth). In other words, the L1 is used from birth in the home or Spanish language enclave, and the L2 is used almost everywhere else. Similarly, the participants have restructured their fluency toward English dominance and away from Spanish dominance. Thus, the three areas of the scale (language use, AOA, and restructuring) are made evident by the two-factor structure with the restructuring toward English being shown by the two items (i) language choice and (ii) language fluency loss, which, for this population of Latino-American bilinguals, fit into the L2 English dominance factor. Restructuring is dramatically illustrated by the fact that the majority of respondents reported that the amount of each language they spoke had recently changed. A third of participants reported a recent change in how much they spoke English (33%), with 10% reporting that they spoke English less often now and 23% reporting that they spoke it more often. A little over half (58%) reported a recent change in how much they spoke Spanish, with 32% reporting that they spoke Spanish less often now and 26% reporting that they spoke it more often.
Phase II: Calculation of scale score
The point system
A point system was created in order to calculate a continuous fluency score. Points were added to two separate fluency scores, one for L1 and the other for L2. The separate scores were then combined through subtraction. See Appendix for a summary.
Higher points (five points maximum) were given for younger ages of comfort and acquisition to highlight the importance age-related decline (Birdsong, Reference Birdsong2006). Similarly, five points were given to the language opposite the one participants indicated they had an accent in. For example, if participants stated that they spoke English with a Spanish accent, five points were added to their Spanish fluency score. The high point value accords with the findings that accents could be detected in L2 speakers who started learning their L2 when they were as young as three years of age (Flege, Munro and MacKay, Reference Flege, Munro and MacKay1995), that few L2 speakers who started learning over the age of 15 achieve native-like accents (Flege et al., Reference Flege, Munro and MacKay1995), and that, at the same time, L2-dominant bilinguals can avoid detectable foreign accents (Flege et al., Reference Flege, MacKay and Piske2002). Participants with an accent in both languages were give three points in each language; participants with no accent were given no points.
Five points were assigned to the language score of the language that was predominantly used at home, in further recognition of the importance of early learning influences and consistent use of a particular language. If both languages were used at home, each language was assigned three points.
Four points were assigned to the predominant language of the region where the participant was currently living. In answering the open-ended question “Describe your overall fluency”, many respondents spontaneously discussed the influence of the region they were living in. For example, the following participants currently living in California wrote:
(1) “I speak, write and read Spanish fluently. But since [I] conduct most of my everyday communications in English for the last 5 years I can be found searching for Spanish words or Spanish expressions from time to time.”
(2) “I have been in the U.S.A. more time now and I feel I am more fluent in English because of my education and career.”
(3) “Even if I learned English in Mexico my teachers were native speakers. Additionally, I used to travel to the U.S. at least once a year and I've lived in California for the last two years.”
The spontaneity in describing living situations is indicative of the influence of this variable on dominance.
These high points, five and four, reflect the fact that AOA and L1/L2 use were identified as important by prior research (Flege et al., Reference Flege, MacKay and Piske2002).
To gauge restructuring (Grosjean, Reference Grosjean1998), three points were subtracted from the corresponding language score if the participant reported losing fluency in a given language. In the following answer to an open-ended question, the participant describes restructuring away from Spanish: “Speaking is a bit of a problem for me now only because I don't have anyone to really practice with while I'm in school.” Three points were also added to the specified language score for mental language when performing a tough math question. Internal math-language has been shown to be modified by time spent using L2 (Tamamaki, Reference Tamamaki1992) and can be partially predicted by the general use of the language preferred, perceived proficiency, and age of acquisition, among others (Dewaele, Reference Dewaele2007). Because restructuring and mental language are mutable, we awarded them fewer points than other factors such as AOA or language used at home.
To separate those who had had extensive in-school language experience versus those who did not, or who had none at all, one point was added for between one and six years of schooling, and two points for seven or more years of schooling. We felt that too fine a distinction among the various years of schooling would lead to inaccuracies. Consider that six years of junior-high and high-school language training may be equivalent to two years of college-level language training. Our point system gave a nod to schooling without overweighting it in the overall picture. We viewed years of schooling as a way to tease apart more equally-balanced bilinguals, and therefore gave a relatively small weight to this variable.
Equally-balanced bilinguals were further teased apart by adding two points for the language chosen for retention if one had to be given up. The choice question has been used in the past to make a final differentiation of weightedness when all other measures indicated that a speaker was “perfectly balanced” (Cutler et al., 1998, p. 229). The majority of bilinguals tested by Cutler et al. (Reference Cutler, Mehler, Norris and Segui1989) were highly fluent bilinguals who had learned both languages simultaneously. The need for dichotomous groups in the research design prompted the use of the choice question, and the resulting dichotomous groups did indeed perform differently from each other in Cutler et al.'s (Reference Cutler, Mehler, Norris and Segui1989) task. The choice question was seen as a final determination of dominance when all other factors were equal. Similarly, we treated the choice question as one that could tip the scale. The weighting of two points gave a slight push toward one end of the scale or the other, rather than the heavier weighting given to age of comfort or language used at home. As with schooling, a smaller point value for this item ensured that answers would inform but not overwhelm the overall scores.
While other researchers might choose to weight responses differently, the current weightings modeled fluency in a way that matched other measurements of fluency such as vocabulary tests, as will be demonstrated in the studies below.
The algorithm
A composite score was created by subtracting one fluency score from the other. A score close to zero indicated that the participant was equally strong in both languages (a balanced bilingual). In our use of the scale, negative scores were English-dominant and positive scores were Spanish-dominant.
We conducted two experiments to test the viability of the scale. We tested participants’ production and comprehension in two different types of translation tests. One measured reaction time, the other measured spoken language performance.
Comparing task performance to scale scores
Lexical Translation Task
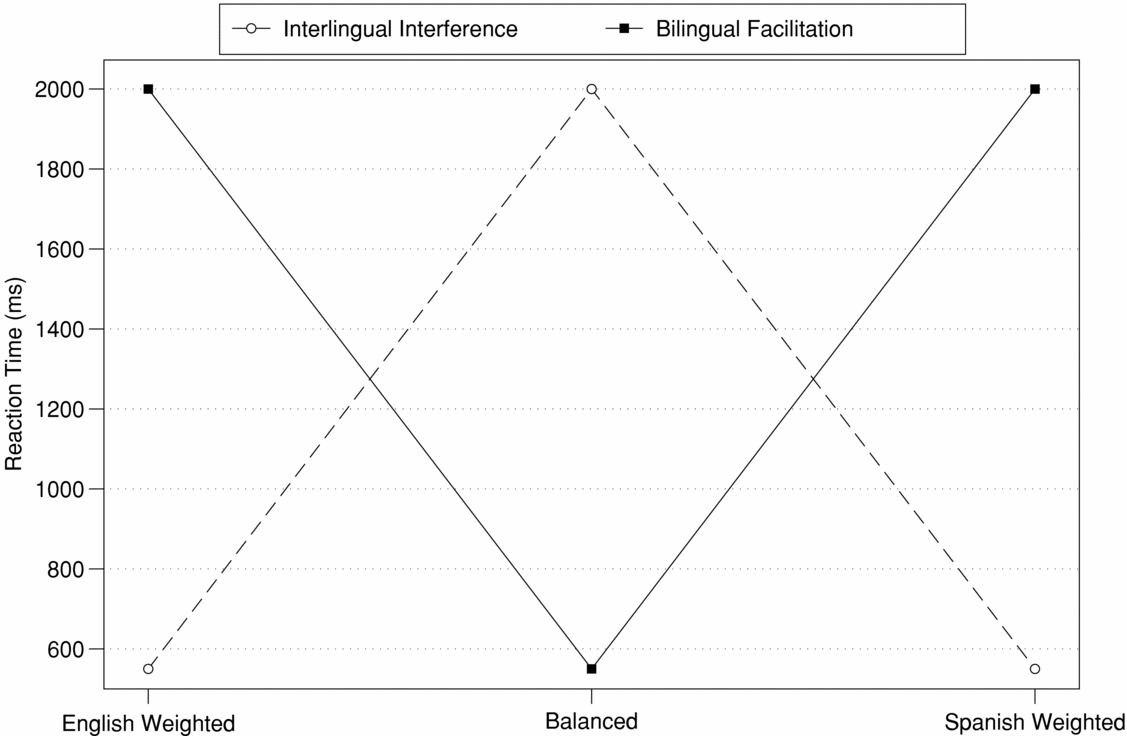
In this study, we compared participants’ lexical translation speed to their scores on the Bilingual Dominance Scale. There are three possible relationships: (i) no relationship between translation speeds and Bilingual Dominance Scale scores; (ii) a V-shaped curve, such that more-balanced bilinguals translate more quickly than less-balanced bilinguals (see solid line in Figure 1 for a graphical depiction); and (iii) an upside-down V-shaped curve, such that more-balanced bilinguals translate more slowly than less-balanced bilinguals (see dashed line in Figure 1 for a graphical depiction).
Two hypothetical results describing the relationship between lexical translation RTs and Bilingual Dominance Scale scores.

The V-shape is predicted if equal weighting for the two languages facilitates translation speed. The upside-down V-shape is predicted if equal weighting for the two languages slows translation speed, as would be the case if more-balanced bilinguals experience greater inter-lingual interference. That is, equally weighted bilinguals may take longer to choose the correct word due to high activation of both English and Spanish, whereas English-weighted and Spanish-weighted bilinguals may be able to reduce the activation of their less fluent language, and thereby come up with a rough translation faster. Prior research supports the upside-down V-shape prediction: even in monolingual mode, bilinguals can experience interference from the unused language (Ju and Luce, Reference Ju and Luce2004), and proficient bilinguals have slower reaction times than non-proficient bilinguals (Náñez and Padilla, Reference Náñez and Padilla1995).
Either the V-shape curve or the upside-down V-shape curve would support the validity of the Bilingual Dominance Scale as an index of variable bilingual performance.
Method
Participants
Fifty-five people participated. Thirty were undergraduate and graduate Spanish–English bilingual students from UCSC who participated in exchange for course credit or candy bars. Twenty-five were college-educated members of the Spanish–English bilingual community in Buenos Aires, Argentina. Argentine participants took part in the experiment as volunteers or in exchange for 15 pesos (5 dollars) compensation. The Argentine participants were contacted through one of the following: (i) the Universidad de San Andres, (ii) a posting on craigslist Buenos Aires, and (iii) network sampling of the Anglo–Argentine community through personal contacts of the first author. The craigslist posting gave a description of the experiment in English and the requirement that the participants spoke English in their homes while growing up.
All participants described themselves as fluent in both English and Spanish when asked to describe their fluency in both languages. Nonetheless, the U.S. bilinguals were English-weighted (M = −9.25, SD = 6.73), whereas the Argentine participants were Spanish-weighted (M = 20.83, SD = 5.16). This is not unexpected given the countries participants were living in. What is important to note is that the participants in each country were as close to mirror-images of each other as possible: the U.S. participants spoken Spanish at home and English at school, and the Argentine participants spoke English at home and Spanish at school. It is important to note, however, that it is becoming increasingly uncommon for Anglo-Argentine immigrant bilingual families to speak English at home.
Materials
One hundred English words were selected from the Brown (Reference Brown1984) compilation of the London-Lund corpus of English conversation. One hundred Spanish words were selected from Padro's (n.d.) online Spanish text corpus. To bridge the gap between the textual and verbal corpora, the frequencies of the English conversational stimuli were compared to the Kucera and Francis (Reference Kucera and Francis1967) American English textual corpus and found to be similar.
We selected some easy, medium, and hard words to allow for participants’ performances to display a range and to avoid floor and ceiling effects. We operationalized word difficulty as word frequency. The easy words were the most frequent, the medium words were slightly less frequent, and the hard words were the least frequent. Fifty stimuli were medium-level words, twenty-five were easy, and twenty-five were hard for each language. As examples of the categories, easy words to translate included done, run, and water in English, and creo “I think”, tienen “they have”, and nuestra “our” in Spanish. Medium words included save, glance, and often in English, and puesto “job”, debemos “we must”, and pensamiento “thought” in Spanish. Hard words included fair, various, and gently in English, and barba “beard”, ventajas “advantages”, and meterse “to go” in Spanish.
Our groupings were not intended to span the difficulty/frequency levels represented by the corpora. Our goal was to create a range of difficulty while at the same time testing relatively frequently used, common words that most speakers should know regardless of the region they lived in. That is, we did not use words like trousers (marked regional usage) or words like exegesis (uncommon, vocabulary-test-type words). Said another way, the hard words were still words that were spoken quite often.
Stimuli were randomized and placed into alternating blocks of fifty words per language. A randomized block of English words was presented first, followed by a Spanish block, then the second English block, and finally the second Spanish block. Blocks included words of all levels of difficulty.
Procedure
Participants in the United States sat in front of a 20-inch flat-screen monitor and wore a microphone headset. Stimuli were presented on a Macintosh G4 using SuperLab. Participants in Argentina sat in front of a 13-inch laptop and wore a microphone headset. Stimuli were presented on an Intel Macbook computer using SuperLab. Words were displayed in lower-case black letters in the middle of a white screen. Stimuli remained on the screen for 3000 ms followed by a fixation point, which required a button press by the participant to continue. Participants were instructed to verbally translate each word if they knew it and to not say anything if they were unsure of the translation. Voice-key reaction times were recorded for each verbal translation. In both countries, instructions were presented in English.
After the translation experiment, participants filled out the Bilingual Dominance Scale questionnaire, which took under five minutes to complete. They also filled out the extended survey a post-experiment questionnaire asking about their translation experience, potential confusion with experiment, and what they thought the experiment was about. Often participants were eager to speak about their individual bilingual experiences after the post-experiment questionnaire as well.
Results
Post-experiment discussion revealed that two participants were not actually fluent in both languages. The participants reported feeling unsure of their fluency, and their mean reaction times, two seconds, reflect this. In addition, 38.2% of these participants’ data were timed-out because response times exceeded three seconds. These two non-bilinguals’ data were excluded from the analysis regressing reaction times on Bilingual Dominance Scale scores.
Post-experiment discussion further revealed that five additional participants had extensive professional experience translating between Spanish and English. Because professional translators may perform this task differently from naïve bilingual participants, their data were excluded from the regression analysis.
It is important to clarify that there is no need to add a question to the scale about professional translation experience. Other researchers may use other tasks where professional translators could be retained in the sample, such as a Stroop task or a memory task. As an analogy, a magician with highly developed mnemonic skills might be excluded from a word-recall task.
Reaction times below 310 ms were considered errors and excluded from analyses (Klapp & Erwin, Reference Klapp and Erwin1976). The average translation time for all words was 1497 ms (SD = 250). Easy words were translated fastest (M = 1314 ms, SD = 279 ms), then medium words (M = 1441 ms, SD = 281 ms), then hard words (M = 1668 ms, SD = 334 ms), F(2, 126) = 15.41, p < .001. The easy and medium groups were translated faster than the hard group (Tukey HSD reliable at the.05 level; no difference between easy and medium groups).
On the Bilingual Dominance Scale, the 48 remaining participants (24 U.S. and 24 Argentine) ranged from a high of 28 (showing Spanish dominance) to a low of −23 (showing English dominance) with a mean of 6 and a standard deviation of 16. With a strict demarcation of zero as a balanced bilingual, twenty-three participants were English-weighted (score range of −1 to −23) and twenty-five participants were Spanish-weighted (score range of 1 to 28). A more accurate description of the middle eight participants (ranging in scores from −5 to 4) might be that they were balanced bilinguals with slight weightedness. This highlights an advantage of a gradient scale: the participants in the middle can be treated separately, as similarly slightly-weighted, rather than grouped with English-dominant or Spanish-dominant.
Qualitatively, the participant with a bilingual score of −23 on the dominance scale had an English accent in her Spanish, often code-switched into English when words did not come to mind in Spanish, and reported difficulty remembering words and conjugations in Spanish. Similarly, the participant with a bilingual score of 28 on the dominance scale had a marked Argentine Spanish accent in his English and reported using rough estimates in place of precise translations. In contrast, bilinguals scoring closer to zero reported difficulty choosing the most accurate translation for the task; several options came to mind, and they reported feeling an urgency to be accurate.
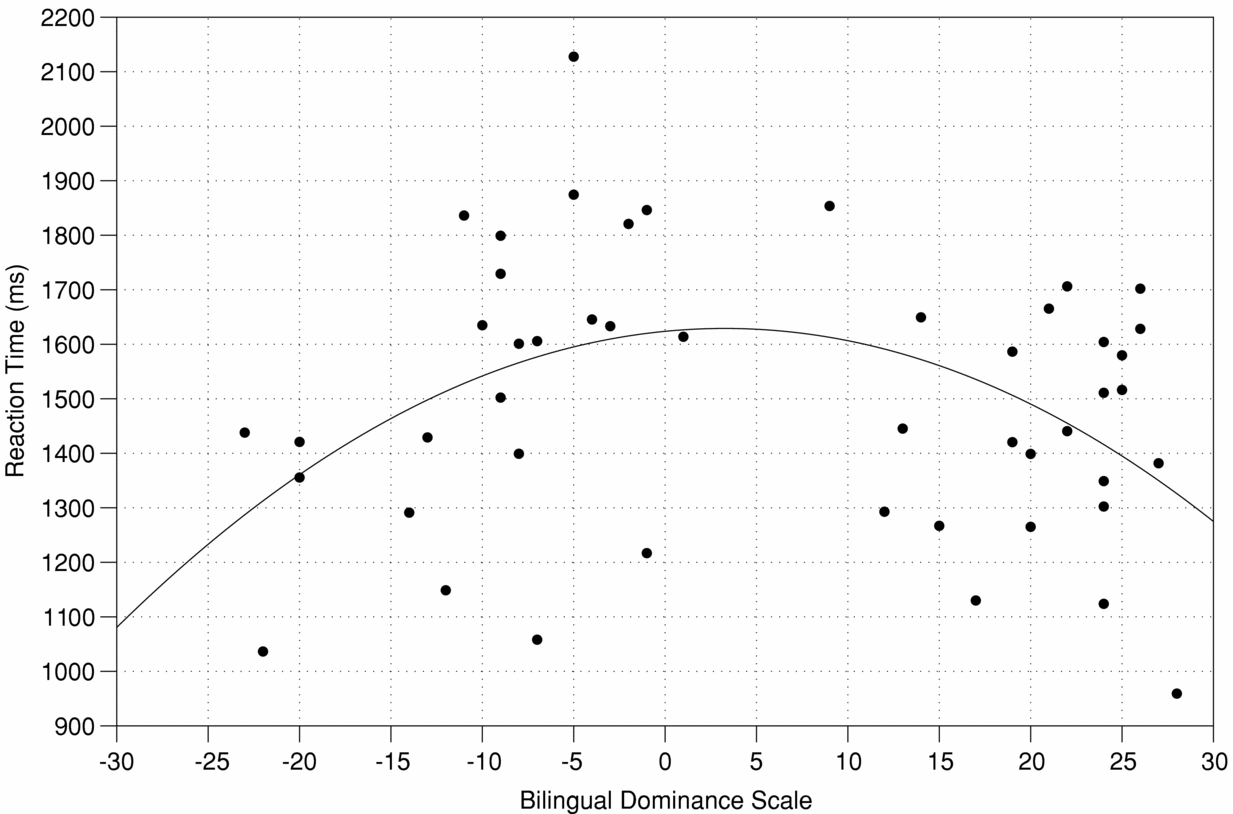
A non-linear regression was performed on the data from the remaining 48 participants. Bilingual Dominance Scale (BDS) scores and translation reaction times (RTs) were curvilinearly related, F(2,45) = 3.93, p = .027. A scatterplot of fluency by reaction times for the 48 participants can be found in Figure 2. The dashed line shows the quadratic regression equation that best fits the data, RT = 1640.36 – 2.5*BDS – 0.49*(BDS – 5.79)2. The more equally weighted the participants were, the slower their reaction times.
Lexical translation RTs by Bilingual Dominance Scale scores.

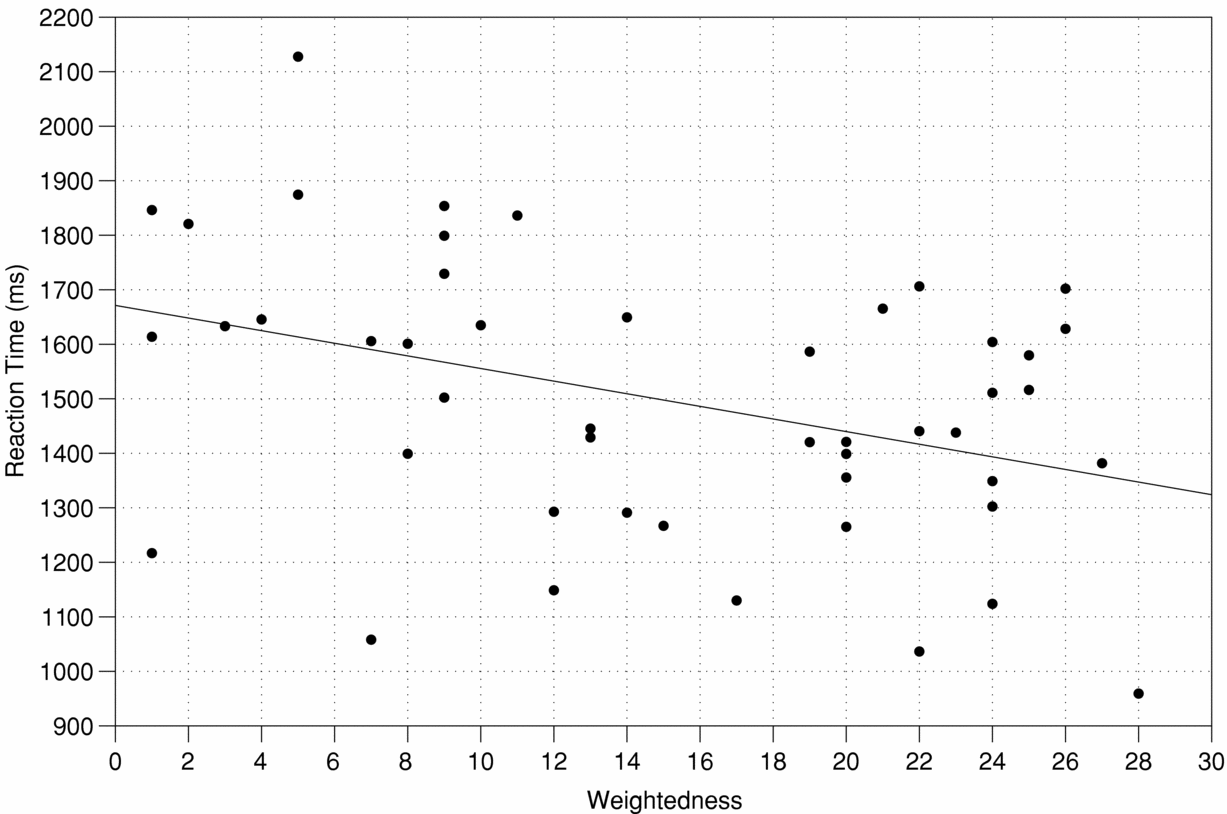
In addition to keeping the full continuum of the Bilingual Dominance Scale, the data can be examined solely in terms of weightedness by taking the absolute value of each score (M = 15.08, SD = 8.26). Weightedness and reaction time were linearly related, F(1,46) = 7.90, p = .007 (see Figure 3). The more balanced the dominance, the longer the reaction times.
Lexical translation RTs by weightedness (absolute value of the Bilingual Dominance Scale scores).

A weightedness score like this can be useful for researchers interested in exploring the effect of weightedness regardless of the languages spoken by participants. It may also be useful for researchers interested in assessing the differential weightedness across groups in the study, such as across samples taken from different communities.
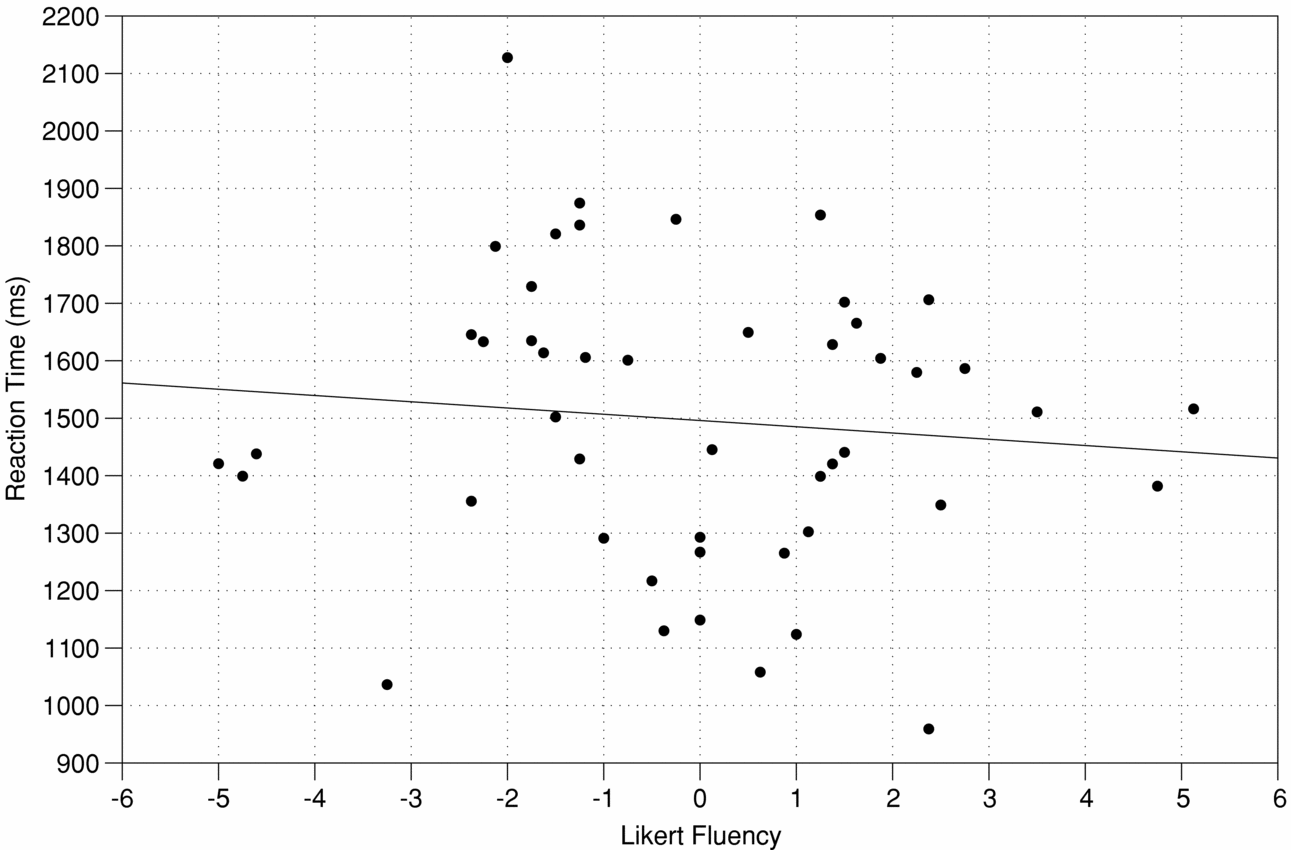
To directly compare the Bilingual Dominance Scale against an oft-used measure of proficiency, self-report, self-reported proficiency was correlated with translation reaction times. As part of the extended survey (see ‘Materials’ in section ‘Phase I: Exploratory Factor Analysis’ above), participants rated their language proficiency in eight arenas on a 1 to 7 Likert scale (1 = not proficient). These question was presented in the following way: “Rate your ability on the following areas for Spanish on a scale of 1 to 7: have a Spanish conversation with friends, read a novel in Spanish, discuss a passionate topic in politics in Spanish, write a thesis paper for class in Spanish, write a letter to a friend in Spanish, give a presentation in class in Spanish, read a scientific paper in Spanish” and “Overall, what is your fluency in Spanish?” Participants rated the same abilities in English. A self-reported weightedness score was calculated by subtracting the mean rating for Spanish fluency from the mean rating for English fluency. In contrast to the Bilingual Dominance Scale, self-reported proficiency ratings were not reliably correlated with translation reaction times, r(46) = −.10, p = .51 (see Figure 4).
Lexical translation RTs by a combination of self-reported fluency scores.

Discussion
The paper-and-pencil Bilingual Dominance Scale can be used as a quick measure to assess fluency in a way that accords with a lexical translation task. Results support the inter-lingual interference model of lexical translation rates. That is, the more equally weighted a bilingual participant was, the slower the translation times. This result accords with the qualitative observations provided by the participants after the experiment was conducted. We now turn to a more complex translation task, sentence translation.
Sentence Translation Task
In this study, we compared participants’ filler and elongation rates to their scores on the Bilingual Dominance Scale. Once again, there are three possible relationships: (i) no relationship between filler and elongation production and Bilingual Dominance Scale; (ii) a V-shaped curve, such that balanced bilinguals produce fewer fillers and elongations than non-balanced bilinguals; and (iii) an upside-down V-shaped curve, such that balanced bilinguals produce more fillers and elongations than non-balanced bilinguals.
Prior research supports the V-shaped prediction. The use of speech fillers and elongations has been linked to speakers’ anticipating upcoming delays in speech (Fox Tree and Clark, Reference Fox Tree and Clark1997; Clark and Fox Tree, Reference Clark and Fox Tree2002). People who have trouble translating sentences should produce more fillers and elongations than people who do not have trouble.
This prediction may at first seem at odds with the data just reported for the lexical translation task. If inter-lingual interference slows RTs, then more-balanced bilinguals should have more pausing, and therefore more fillers and elongations. However, reaction time delays are not the same as pauses in a sentence translation study. Consider the fact that the average pause difference between medium and hard words in the translation study was 227 ms. This would be one of the shorter pauses in a sentence production study. A sentence translation task also introduces many more levels of potential production trouble than a lexical translation task, including not only word finding trouble, but also syntactic and prosodic formulation trouble. In the lexical translation task reported here, participants were instructed not to use ums or uhs, and did, in fact, not use ums or uhs. In the sentence translation task, in contrast, almost all participants used ums and uhs or their Spanish equivalent em or eh, 77% (36/47). Similarly, all participants used elongations as a signal of upcoming delay.
Either the V-shape curve or the upside-down V-shape curve would support the validity of the Bilingual Dominance Scale as an index of variable bilingual performance.
Method
Participants
Forty-six people participated. Twenty-one were Spanish–English bilingual undergraduate students from the University of California at Santa Cruz who participated in exchange for course credit. Twenty-five were college-educated members of the Spanish–English bilingual community in Buenos Aires, Argentina, the same participants described in Experiment 1.
Materials
Eight excerpts of spontaneously produced Spanish talk were transcribed verbatim. Excerpts covered the topic of college life and were all approximately the same length. They were taken from a corpus of spontaneous conversations produced by pairs of Spanish–English bilingual UCSC undergraduates. The conversations were collected for an unrelated project by another researcher at UCSC, Nicole Wilson. Two excerpts follow: (1) “Mis papas trabajan mucho, y no tienen educación. Entonces a mí nunca me pudieron ayudar con la tarea. En vez de hacer la tarea, tenía que limpiar la casa.” [My parents work a lot and have no education. So they could never help me out with homework. Instead of doing my homework I had to clean the house.] and (2) “Cuando vine aquí, me habian informado que iba a haber mucha tarea. El tiempo se iba a ir muy rapido. Pero yo no creía que iba a ser así.” [When I came here they told me I was going to have a lot of homework. That time would go by really fast. But I didn't think it was going to be like that.].
Procedure
Participants briefly studied each transcript and then translated it into English. Participants were able to pause, stop, and restart at any point in the translation. Speech was recorded directly onto a Macintosh computer using PRAAT speech analysis software (Boersma and Weenink, Reference Boersma and Weenink2008). In both countries, instructions were presented in English.
After translating, participants completed the five-minute Bilingual Dominance Scale questionnaire.
Results
All fillers and elongations were identified and counted, excluding utterance-final elongations. Utterance-final elongations were excluded to prevent artificial inflation of elongation rates. Fillers included both Spanish and English pronunciations, including um, uh, em, and eh. Elongations were defined as items researchers heard as perceptually longer than the normal speech rate of that speaker. All researchers were trained in phonetic analysis. They listened to several minutes of a participant's talk to determine a rate of speech before judging elongations. This method was used in prior studies (Eklund, Reference Eklund2000; Lee, He, Huang, Tseng and Eklund, Reference Lee, He, Huang, Tseng and Eklund2004). For each participant, a filler and elongation rate was calculated by dividing the number of fillers and elongations produced by the total number of words spoken.
Filler rates were subtracted from elongation rates to measure participants’ use of one delay indicator over the other. Spanish-weighted participants produced more elongations than English-weighted participants, r(44) = .74, p < .001. Conversely, English-weighted participants produced more fillers than Spanish-weighted participants. We group the devices together because of their similar functions in anticipating delays in upcoming speech. Fillers do vary across languages (Clark and Fox Tree, Reference Clark and Fox Tree2002), and it is possible that the choice of whether to use a filler or an elongation may vary as well.
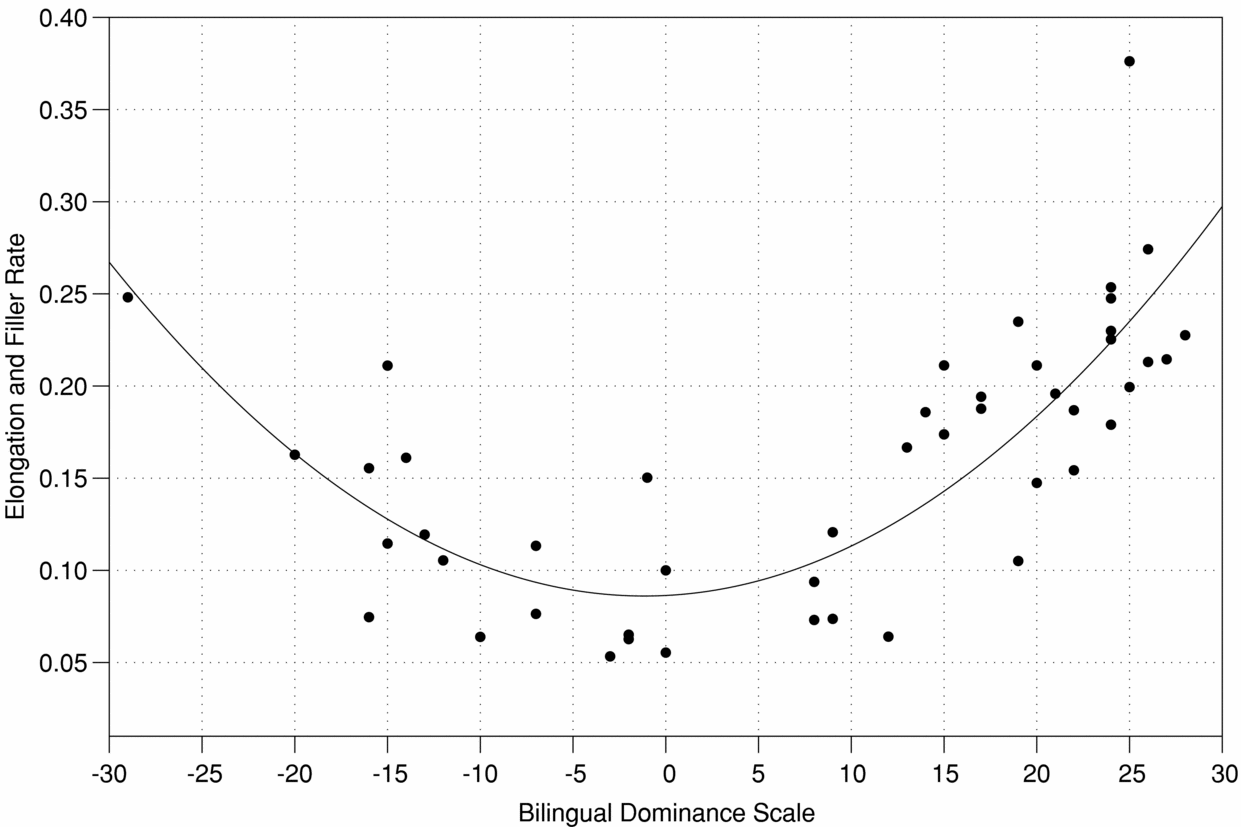
Bilingual Dominance Scale scores and filler and elongation rates were curvilinearly related, F(2,43) = 41.49, p < 0.001. A scatterplot of fluency by reaction times for the 47 participants can be found in Figure 5. The dashed line shows the quadratic regression equation that best fits the data, Rate of Fillers and Elongations = 0.073 + 0.004*BDS + 0.0002*(BDS − 7.83)2.
Elongation and filler rates by Bilingual Dominance Scale scores.

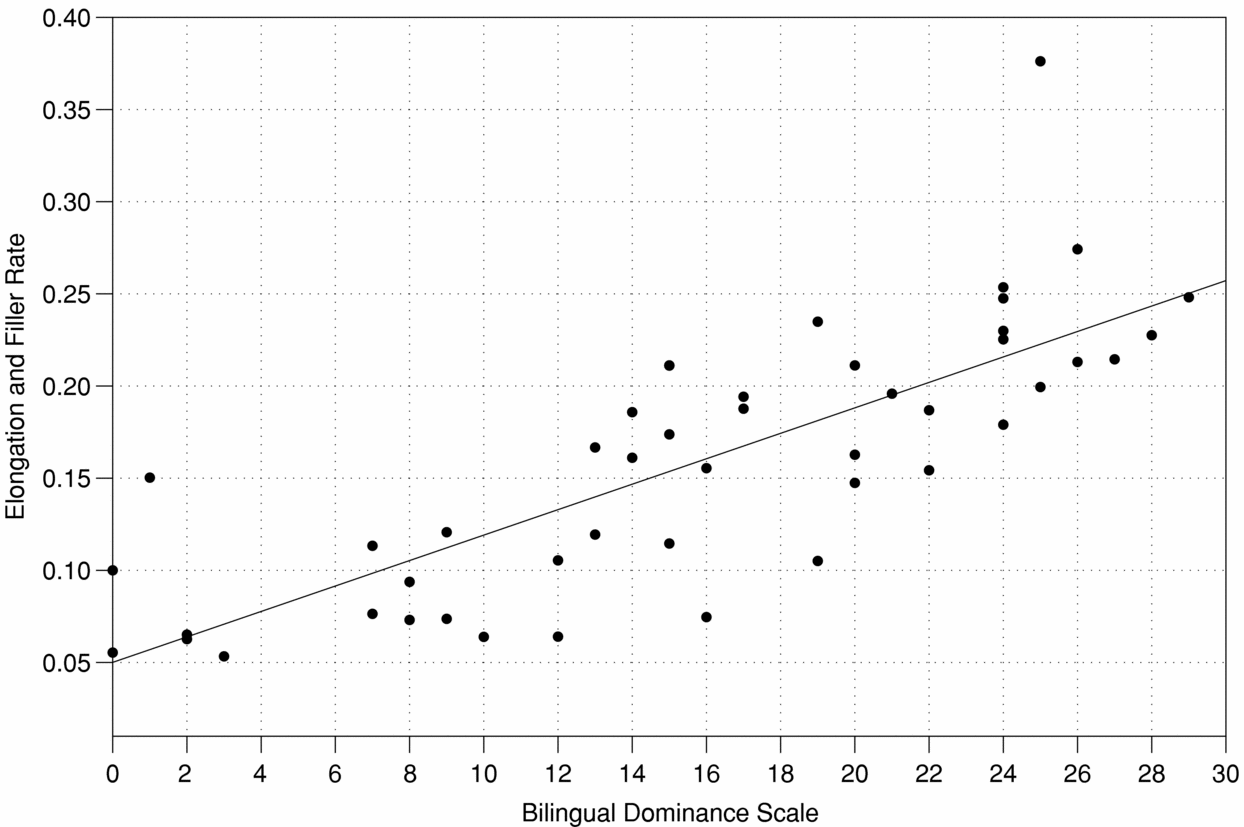
Language weightedness, regardless of which language was dominant, was linearly related to filler and elongation production, F(1,44) = 75.2, p < .001; see Figure 6. This was assessed by regressing the absolute value of the scale score on filler and elongation rate. The more equally weighted a bilingual participant was, the fewer fillers and elongations were used.
Elongation and filler rates by Bilingual Dominance Scale scores (absolute value of the Bilingual Dominance Scale scores).

Discussion
The paper-and-pencil, gradient Bilingual Dominance Scale can be used as a quick measure to assess fluency in a way that accords with a sentence translation task. Results support the indicator-of-upcoming-delay model of fillers and elongations in sentence translations. That is, equally weighted bilinguals have an easier time making longer translations and therefore use fewer fillers and elongations. Less equally weighted bilinguals have more trouble and therefore use more fillers and elongations.
The Bilingual Dominance Scale is a viable measure of participants’ production and comprehension. Next, in the general discussion, we explain how the scale produces descriptions of behavior that differ from dichotomous analyses.
General discussion
We present a five-minute, paper-and-pencil survey that can be used to place participants on a gradient scale of language dominance. The scale can be adapted for nonliterate participants by asking questions verbally and recording responses. We tested the scale on participants from two countries who came from populations that were mirror-images of each other: U.S. participants who spoke Spanish at home and English at school, and Argentine participants who spoke English at home and Spanish at school. All participants were in college or college-educated.
Adopting the Bilingual Dominance Scale can enhance cross-study comparisons. For example, a balanced bilingual can be characterized narrowly as someone falling between −5 and +5 on the scale or, more broadly, as someone falling between −10 and +10. Future studies may reveal different effects with different tasks for different types of bilinguals. As an example of potential differences, consider how different dichotomous cut-offs paint different pictures for the lexical translation data. Defining English-weighted bilingual and Spanish-weighted bilingual with the cut-off score of 0 suggests that English-weighted participants (M = 1541 ms, SD = 282 ms, N = 23) translate just as quickly as Spanish-weighted participants (M = 1455 ms, SD = 213 ms, N = 25; t(46) = −1.19, p = .23). But defining English-weighted bilingual and Spanish-weighted bilingual with the cut-off score of 10 suggests that English-weighted participants (M = 1557 ms, SD = 278 ms, N = 25) translate more slowly than Spanish-weighted participants (M = 1432 ms, SD = 201 ms, N = 23; t(43.67) = 1.80, p = .08). Without further inspection, this could imply that participants who speak English as their primary language have more trouble translating words. Of course, we know from the continuous analysis presented here that the relationship between language dominance and translation speed is parabolic.
Adopting the Bilingual Dominance Scale can also deepen data interpretation. The dichotomous breakdown English-weighted bilingual and Spanish-weighted bilingual with the cut-off score of 0 presents a different picture for the sentence translation data than a gradient analysis. Spanish-weighted participants produce more fillers and elongations (M = .18, SD = .07, N = 30) than English-weighted participants (M = .12, SD = .06, N = 16; t(44) = 2.79, p < .01). This pattern is dramatized when considering the dozen highest fluency scores, considered Spanish-weighted (M = .24, SD = .05, N = 12), against the dozen lowest fluency scores, considered English-weighted (M = .13, SD = .06, N = 12; t(22) = 4.61, p < .001). Without further inspection, this could imply that participants who speak Spanish as their primary language have more trouble translating sentences, or that participants who speak Spanish as their primary language are more inclined to indicate upcoming delay to their addressees. Of course, we know from the continuous analysis presented here that the relationship between language dominance and filler and elongation use is parabolic.
Adopting the Bilingual Dominance Scale can also enhance longitudinal comparisons, capturing changes in participants’ dominances over time. For example, in the current studies, all but one of the U.S. participants had learned Spanish first, but by their college years, they were English-dominant. Their loss of Spanish fluency was most likely the result of restructuring, as is natural when attending a university where the predominant language was different from that at home. Forty-three percent of the U.S. participants who had answered “Yes” to a question about losing fluency in Spanish mentioned that their loss of fluency started between the ages of 17 and 18 years, the typical age of moving out of their homes. Similarly, sixty-two percent of Argentine participants who answered “Yes” to losing fluency in English mentioned that their loss started between the ages of 17 and 18 years, the typical age of moving out of homes in Argentina as well.
The quick, paper-and-pencil Bilingual Dominance Scale is easy to implement. Here it has been used to provide new support for inter-lingual interference in balanced bilinguals, and for the theory of fillers and elongations as indicators of upcoming delay. The scale may likewise be used to illuminate new relationships in other researchers’ work.
Appendix. The twelve Bilingual Dominance Scale questions and the scoring procedure
Questions 1 and 2: At what age did you first learn Spanish ________ English ________?
Scoring: 0–5 yrs = +5, 6–9 yrs = +3, 10–15 yrs = +1, 16 and up = +0
Questions 3 and 4: At what age did you feel comfortable speaking this language? (If you still do not feel comfortable, please write “not yet.”)
Spanish ________ English ________
Scoring: 0–5 yrs = +5, 6–9 yrs = +3, 10–15 yrs = +1, 16 and up = +0, “not yet” = +0
Question 5: Which language do you predominately use at home?
Spanish ________ English ________ Both ________
Scoring: if one language used at home, +5 for that language; if both used at home, +3 for each language
Question 6: When doing math in your head (such as multiplying 243 × 5), which language do you calculate the numbers in? ________
Scoring: +3 for language used for math; +0 if both
Question 7: If you have a foreign accent, which language(s) is it in? ________
Scoring: if one language is listed, add +5 to the opposite language of the one listed; if both languages are listed, add +3 to both languages; if no language is listed, add nothing
Question 8: If you had to choose which language to use for the rest of your life, which language would it be? ________
Scoring: +2 for language chosen for retention
Questions 9 and 10: How many years of schooling (primary school through university) did you have in:
Spanish ________ English ________
Scoring: 1–6 yrs = +1, 7 and more yrs = +2
Question 11: Do you feel that you have lost any fluency in a particular language? ________
If yes, which one? ________ At what age? ________
Scoring: −3 in language with fluency loss; −0 if neither has lost fluency
Question 12: What country/region do you currently live in? ________
Scoring: +4 for predominant language of country/region of residence