


1. Introduction
Ice cores provide a wonderful record to investigate past climates. Since ice sheets form by successive deposition of snow layers, travelling down to the deepest part of the ice sheet is a journey into the past. Ice-core studies provide a large set of climatic parameters, such as past temperature variations which can be revealed through isotopic data, the atmospheric composition revealed through gas trapped in bubbles and the atmospheric circulation inferred from impurity concentrations. Although there is an immense amount of information available, dating is the Achilles’ heel of these archives. For sites with high accumulation rates, counting of annual layers enables estimation of the age (Greenland Icecore Project (GRIP), Greenland Ice Sheet Project 2 (GISP2) and NorthGRIP cores among others; see, e.g., Reference Alley, Gow, Meese, Fitzpatrick, Waddington and BolzanAlley and others, 1997b). At depths where annual layers are not resolvable, and for sites with low accumulation rates, flow models have to be used to reconstruct the sinking of the ice layers and then the age can be estimated with depth (Dome C, Vostok and Dome F (Antarctica) cores among others; see, e.g., Reference Parrenin, Jouzel, Waelbroeck, Ritz and BarnolaParrenin and others, 2001). Consequently, understanding the deformation of the ice is of primary importance for correct climatic interpretation.
From a material science point of view, ice is an assemblage of crystals with a hexagonal crystallographic structure. The crystal orientation is specified by the direction of its a and c axes. Due to the birefringence of ice, the c axis of a single crystal, which is perpendicular to the basal planes, can be easily revealed by optical measurements. In what follows, ‘fabric’ refers to the orientations of the c axes of the ice polycrystal, whereas ‘microstructure’ refers to the grain-boundary network. The term texture includes both the fabric and microstructure. Note that this terminology is not universally accepted, and other usages of these terms can be found in the literature.
It is worth noting that ice flow is strongly dependent on the texture. Firstly, the deformation of an ice crystal occurs by dislocation slip, mainly along the basal plane, confirming the predominant visco-plastic anisotropy of the ice crystal, i.e. the resistance to shear on non-basal planes can be 60 times higher than resistance to shear along the basal planes (Reference Duval, Ashby and AndermanDuval and others, 1983). Due to the intrinsic anisotropy of ice, the c axes rotate during deformation towards compressional axes and away from tensional axes (Reference Azuma and HigashiAzuma and Higashi, 1985; Reference Castelnau and DuvalCastelnau and Duval, 1994; Van der Reference Van der Veen and WhillansVeen and Whillans, 1994), and complex feedbacks occur between flow and fabrics. As an example, under compression, when c axes rotate toward the compressional axis, the applied stress becomes increasingly perpendicular to the basal plane, and the ice becomes harder to compress. Secondly, the rheology may depend on the mean crystal size, as finer grains could explain a third of the shear strain rate enhancement observed in ice deposited during glacial periods (Reference Cuffey, Thorsteinsson and WaddingtonCuffey and others, 2000). Understanding the reasons for grain-size variations with climatic changes is thus an important task for texture studies (Reference DurandDurand and others, 2006). Finally, recrystallization processes have to be taken into account. As an example, rotation recrystallization, also known as polygonization, is characterized by basal dislocations that group together in walls perpendicular to the basal planes and form sub-boundaries. The misorientation between two subgrains increases gradually, and grains may split into smaller grains. Such processes complicate the interpretation of texture measurements.
Since the texture records the deformation history of the ice, an understanding of processes affecting the texture may lead to a better understanding of ice flow. Moreover, the complex feedbacks between fabric development and deformation are now incorporated in local flow modelling (Reference Gagliardini and MeyssonnierGagliardini and Meyssonnier, 2000). In such models, both the velocity and the fabric fields are calculated, allowing comparison with measurements. Such comparisons require some fabric parameters that can be determined both theoretically and experimentally. Last but not least, in some cases, the study of the texture can help to explain observed flow disturbances such as folds (Reference Alley, Gow, Meese, Fitzpatrick, Waddington and BolzanAlley and others, 1997a; Reference RaynaudRaynaud and others, 2005). This is crucial for extracting palaeoclimatic records from an ice core.
Due to the birefringence of ice crystals, ice texture can be revealed by the examination of a thin section under cross-polarized light. Earlier studies of ice texture were made manually, which was tedious and particularly time-consuming work. Much progress has been made in developing ice-texture instruments, and now automatic measurements of texture can be performed. Reference Wilen, DiPrinzio, Alley and AzumaWilen and others (2003) presented a review of the automatic ice-fabric analyzers (AIFAs) used in the glaciological community. In the cited works, the AIFAs were mainly used to extract the grain orientations of an ice sample, and microstructure was considered as a by-product of the measurements.
As plentiful and more robust measurements have now been obtained using an automatic ice-texture analyzer (AITA; since one should also extract the microstructure of a sample using an AIFA, AITA is a more appropriate term), some of the textural parameters measured so far are, in our view, now obsolete. Moreover, new parameters can be defined. These parameters better describe the texture and should be used in preference to earlier ones. This paper aims to review and propose new methods to describe ice texture. The paper is organized as follows: in section 2, we discuss in detail the operations needed to obtain the texture information from an ice sample. In section 3, we review the parameters used so far to describe the microstructure and propose new definitions. Section 4 deals with fabric parameters. Finally, section 5 briefly presents a MATLAB® tool to determine all these texture parameters.
2. Measurements
2.1. Sample preparation
Most of the studies of ice texture follow the standard procedure detailed in Reference LangwayLangway (1958) to prepare thin sections. Here, we briefly recall this procedure and propose some improvements:
-
1. A vertical (parallel to the core axis) or a horizontal (perpendicular to the core axis) thick section about 1 cm thick is cut from the ice core. The sample location differs from core to core, but a large sample area is preferable (this point is detailed later).
-
2. One surface of the sample has to be flattened in order to obtain a plane surface. As proposed by Reference LangwayLangway (1958), sandpaper can be used, but Reference ThorsteinssonThorsteinsson (1996) proposed another procedure: The thick section is placed on a glass plate, with a few drops of water along its side to glue it to the glass plate. The plate is fixed to a microtome and is shaved to produce a smooth and plane surface. Then the sample is removed from the glass plate by breaking the frozen-water droplets with a cutter. In our experience, the second procedure is preferable as it produces better results.
-
3. A glass plate is then frozen or glued onto the smooth surface. Reference LangwayLangway (1958) proposed the glass plate be warmed and the sample glued by refreezing of water. The amount of heat applied to the glass plate will determine the quality of the thin section: melting more than necessary can induce bubble trapping at the glass–ice interface; conversely, too little heat applied to the glass plate will cause a weak bond between ice and glass and the thin section may be damaged while reducing the thickness. This method needs practice before satisfactory results can be obtained. The sample can also be fixed by using water droplets on its border as in step 2. This procedure is easier than that proposed by Reference LangwayLangway (1958), and the quality of the final thin section is generally better.
-
4. Using a bandsaw, the sample is cut parallel to the glass plate, leaving 1–2mm of ice adhering to the glass.
-
5. The section is reduced to a thickness of 0.3mm with a microtome knife. The thickness is an important parameter for grain-boundary determination using cross-polarized light. Sharp colour transitions between grains are required and interference fringes, which appear if the grain boundary is too thick, should be avoided. The optimal thickness corresponds to grain colour in the brown-yellow range (Reference Gay and WeissGay and Weiss, 1999).
It is obvious that the measurements result from twodimensional (2-D) cuts of a three-dimensional (3-D) structure. This point, referred to as the sectioning effect in what follows, must always be kept in mind, as it influences the interpretation of the measurements made on the microstructure (see Reference UnderwoodUnderwood (1970) for a review of stereological problems, and section 3.1.2 for a discussion of the influence of 2-D cuts on mean grain radius estimation). The c-axis measurement is not influenced by this 2-D effect, assuming a small disorientation within a grain.
2.2. Texture measurements
The classical manual technique for measuring the fabric of a thin section is based on the Rigsby-stage procedure (Reference RigsbyRigsby, 1951) that was standardized by Reference LangwayLangway (1958). Microstructural parameters, such as the mean grain size, were also estimated manually (see section 3.1). More recently, imageanalysis procedures have allowed extraction of microstructure and new parameters related to the shape of grains (Reference Gay and WeissGay and Weiss, 1999; Reference SvenssonSvensson and others, 2003).
Today, using an AITA, the whole texture of a polycrystal can be measured: fabric and microstructural parameters can now be obtained together on the same sample. Indeed, Reference Gagliardini, Durand and WangGagliardini and others (2004) have shown that the measured cross-sectional area should be used as a statistical weight of the polycrystal constituents in order to improve the fabric description. Complete texture measurements are also pertinent, as mapping of the spatial distribution of c axes can reveal additional information about recrystallization processes (Reference Alley, Gow and MeeseAlley and others, 1995; see also section 4.7).
Two major steps have to be carried out to extract the texture from the output of an AITA:
-
1. Extraction of grain boundaries. Reference Gay and WeissGay and Weiss (1999) proposed an image analysis algorithm to extract the microstructure from three images of one thin section taken under cross-polarized light. After some filtering to remove noise, a Sobel filter is used to detect large discontinuities in intensity, which generally correspond to grain boundaries. This method works well for randomly oriented crystals, as the colour variations from grain to grain are important (see Fig. 1). For more oriented fabrics, colours between grains are similar and grain-boundary detection is more difficult and some manual corrections are needed. Note also that the resulting microstructure is naturally strongly dependent on the quality of the thin section. Most of the existing automatic machines produce images of the thin sections that can be used to extract the microstructure (Reference Wilen, DiPrinzio, Alley and AzumaWilen and others, 2003). An adaptation of the Reference Gay and WeissGay and Weiss (1999) algorithm can easily be made from the output of these analyzers.
-
2. Assigning an orientation for each grain detected in (1). Using an AITA, the orientation is known for each pixel of the grain. The initial measurements for a given pixel are the co-latitude, θp, and the longitude, φ p, if this pixel is not located on a grain boundary. An average value of the c axis over all pixels inside a grain, as well as the dispersion, can be estimated within each grain. These calculations are detailed in section 4.5.
Image of a thin section under cross-polarized light (left) and the corresponding texture (right). Grain boundaries appear white, and each grain defined within the microstructure has an orientation detailed in the colour map given by the polar plot projection shown on the bottom right.

Finally, from outputs of the AITA, one obtains the complete description of the texture at the grain scale. That is the microstructure, which contains all the topological information, and the fabric which gives the mean orientation of all non-intersecting grains within the microstructure. Such results allow the construction of images such as that shown in Figure 1, which contain all the information required to calculate the parameters describing the texture (see sections 3 and 4). It is worth noting that the original outputs from the AITA should be conserved, as they certainly contain information at the sub-grain scale that is not taken into account in this work and may be useful at a later date.
3. Microstructural Parameters
Manual estimation of the grain size is time-consuming work and several methods have been used so far to make these measurements practicable. As discussed in section 2, imageanalysis procedures now provide the ability to extract the complete microstructure in an acceptable time. Therefore, a more accurate definition of the grain size can be made, and the procedures also give new information on grain-size distributions. Comparisons of the different methods used so far are reviewed in section 3.1.
Other studies have focused on the grain shape to obtain information about ice deformation (Reference Azuma and HondohAzuma and others, 2000; Reference DurandDurand and others, 2004). As for the measurement of the grain size, several methods have been used so far; a comparison is provided in section 3.2.
3.1. Grain size
3.1.1. Estimation of a characteristic length of the microstructure
Reference GowGow (1969) first proposed measuring the mean grain size of a section by estimating the average area of the 50 largest grains. By definition, this method only measures the evolution of the largest part of the grain distribution; thus, it is not representative of the complete population. It is also worth noting that the representativity of the 50 largest grains is affected by a change in the grain size (for a constant sampling surface). This leads to a bias in the estimation of grain-growth rate (Reference Gay and WeissGay and Weiss, 1999). The method was developed in order to perform manual measurements and should be avoided for automatic measurements.
Reference Thorsteinsson, Kipfstuhl and MillerThorsteinsson and others (1997) estimated the mean grain size along the GRIP core using the linear intercept method. This method consists of counting the number of grain boundaries that intercept a horizontal (or vertical) line. This leads to the estimate of a mean intercept length, (L), which for a regular surface is proportional to the square root of the area of the considered object (Reference UnderwoodUnderwood, 1970). This method suffers different biases: (1) if the grain shape evolves (and that is the case; see Reference DurandDurand and others, 2004), the ratio between the mean area and (L) is affected;(2) twisted grain boundaries can intercept a given line more than once; and (3) the link between the grain-area distribution and the distribution of the length of intercept is not straightforward.
Reference Duval and LoriusDuval and Lorius (1980) estimated the mean grain area by counting the number of grains within a defined surface. As this method takes into account the whole population of grains, it is more robust than the method proposed by Reference GowGow (1969). It also provides a more straightforward estimate of the mean grain size than the linear intercept method, but it does not provide a grain-size distribution. Note also that corrections are required in ice with significant porosity.
3.1.2. Mean grain radius
A more complete way to measure a characteristic length of the microstructure would be to calculate the average volumetric radius:  , where Ng is the number of non-intersecting grains within the microstructure and Vk
is the volume of grain k. As mentioned previously, the volume of the ice crystal cannot be measured and 2-D sections have to be made. Then a characteristic length of the microstructure could be expressed by the average radius:

where Ak
is the cross-sectional area of grain k and  where δ is the actual area of a pixel and
 is the number of pixels that compose grain k. An estimate of the error induced by the sectioning effect can be made with the help of a 3-D Potts model. In such a model, 3-D microstructure is divided into small volume elements and an orientation is allocated to each element. Grain growth is simulated using a Monte Carlo technique: an element is randomly selected and a new orientation is randomly attributed. Similar orientations between neighbouring elements (i.e. same grain) will decrease the energy of the system, and the new orientation will then be conserved. The Potts model is known to properly reproduce the topological, kinetic, grain-size distribution and morphological features of normal grain growth (Reference Anderson, Grest and SrolovitzAnderson and others, 1989), such as recrystallization processes occurring in the upper part of ice sheets (Reference Alley, Perepezko and BentleyAlley and others, 1986).
Following Reference Gagliardini, Durand and WangGagliardini and others (2004), we generated 3-D Potts microstructures containing 400 × 400 × 400 elements. A section within this volume contains approximately 200 non-intersecting grains. For such a section, both (RV) and (R) can be measured and compared. From these results, we demonstrated that the standard deviation σs of the (R) distribution for a given (RV) can be approximated by as ≈ 0.02(R) (Reference DurandDurand, 2004).
The mean grain size generally increases with depth Reference Alley, Perepezko and BentleyAlley and others, 1986), and for a constant sampling surface the number of grains will decrease with increasing depth. The statistics for the calculation of the average grain radius can be drastically affected. As for the error induced by the sectioning effect, we estimate the error induced by the number of grains used in the calculation of the average radius using a Potts model. Reference Anderson, Grest and SrolovitzAnderson and others (1989) have shown that a 2-D Potts model reproduces the characteristics of a microstructure determined from a section of a 3-D polycrystal under normal grain growth (and the calculation time is much smaller for 2-D than for 3-D simulations). As shown in Figure 2, the normalized grain-size distribution of a 2-D Potts microstructure is highly comparable with a natural microstructure sampled along the EPICA (European Project for Ice Coring in Antarctica) Dome C core (75°06’ S, 123°21’E) at 100.1m depth (see also section 3.1.3).
Normalized distribution of the logarithm of the normalized radius of the grain (Rk/(R)) for a microstructure sampled along the EPICA Dome C (Antarctica) core at 100.1m depth (black line). The log-normal distribution corresponding to the measured parameters ()D and σD of this microstructure is also plotted (dotted line), as well as the distribution obtained for a 2-D Potts microstructure (grey line). The number of grains (275) and the mean radius (21.3 pixels) of the Potts microstructure are comparable to the natural sample (454 grains and (R) = 21.6 pixels).

We simulated 200 microstructures of 10002 pixels containing between 622 and 1808 grains. We supposed that these microstructures present enough grains to completely describe the grain-size distribution. Their mean radius was then used as a reference, (RRef). For each microstructure, 80 subsampling microstructures were randomly selected. These sub-microstructures contained between 3 and 200 grains and their mean radius was calculated and compared to (R). As (R)/(RRef) follows the central limit theorem, the standard deviation depends only on the number of grains, following the relation  (see Fig. 3). Of course, for measurements on natural ice, (RRef) is unknown, and we make the following approximation:
Evolution of the standard deviation of (R) over (RRef) vs the inverse of the square root of the number of grains.

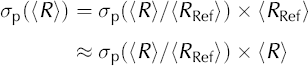
and finally obtain σp ≈ 0.44Ng 1/2 × (R). An error bar that takes into account the sectioning effect (σs) as well as the population effect (σp) can now be attached to (R) as follows:

where (R) is calculated using Equation (1).
3.1.3. Distribution parameters
Under normal grain growth, the normalized grain-size distribution, Rk/{R}, remains unchanged and is closely approximated by a log-normal distribution (Reference Humphreys and HatherlyHumphreys and Hatherly, 1996). This observation does not have a theoretical explanation as yet; it is, however, a useful description, as the distribution can be completely defined with only two, easily measurable, parameters: the mean, {}D = {ln(Rfc/(R})}, and the standard deviation, σD = σ[ ln (Rk /(R))]. Changes in the normalized distribution could reveal changes in the activated recrystallization processes. Such changes could also provide information on the mechanisms affecting the normal grain growth, such as pinning of grain boundaries by microparticles which induces a shift of ()D and σD (Reference Riege, Thompson, Frost, Weiland, Adams and RollettRiege and others, 1998; Reference DurandDurand and others, 2006).
From Potts model results, and following the procedure detailed in section 3.1.2, we also estimate the intrinsic variability of ()D and σD induced by the sectioning effect and the change in the population:

3.2. Grain shape and deformation of the microstructure
Many different descriptors can be used to determine the shape of grains and quantify the anisotropy of a microstructure (Reference Mecke and StoyanMecke and Stoyan, 2002). Many have been applied by the glaciological community, so comparison between different results from different cores can sometimes be tricky. Among the most frequently used parameters are:
-
1. Comparison between the mean vertical and horizontal intercept lengths (Reference Thorsteinsson, Kipfstuhl and MillerThorsteinsson and others, 1997; Reference Gay and WeissGay and Weiss, 1999). In addition to the inherent artefacts induced by the measurement of (L) (see section 3.1.1), this method is not able to correctly quantify anisotropy in a non-horizontal plane. A similar method was used by Reference SvenssonSvensson and others (2003), as they measured the bounding box of each grain and calculated the corresponding aspect ratio, i.e. the width-to-height ratio of the smallest rectangle with horizontal and vertical sides which completely encloses the grain. Such a method also does not fully capture grain elongation that is not oriented in the horizontal or vertical directions, unless the box orientations are rotated.
-
2. An inertia tensor for each grain can also be calculated (Reference Azuma and HondohAzuma and others, 2000; Reference Wilen, DiPrinzio, Alley and AzumaWilen and others, 2003). The eigenvalues of the tensor provide the elongation of the grain, and the eigenvectors give the directions of elongations. Compared to the previous methods, this tensor description has the advantage that the obtained measurements do not depend on the particular choice of axes (e.g. vertical and horizontal).
-
3. Reference DurandDurand and others (2004) proposed a new method based on the vectors, ℓ, that link neighbouring triple-junction locations (where three grain boundaries meet). This method, which can suffer from some artefacts in porous ice (triple junctions may occur in pores), is briefly recalled here. More details and applications can be found in Reference DurandDurand and others (2004). A local average microstructure anisotropy tensor, M, can be defined as:
(4)
where (ℓ1, ℓ2 ) are the coordinates of ℓ in the local reference frame, R, (the ē3 axis is perpendicular to the thin section). The absolute horizontal orientation is unknown; ē1 is relative to the thin section, which cannot be oriented with respect to the core axis. R is the rotation which makes M diagonal and (λ1, λ2) are the corresponding eigenvalues; (·)p denotes the average over N vectors, up to the pth neighbours. A sample can be examined under different scales: a small p explores details, whereas a larger p improves the statistics. Compared to the inertia tensor presented in Equation (2), M has the additional advantage that it has a physical significance in terms of mechanical deformation (Reference Aubouy, Jiang, Glazier and GranerAubouy and others, 2003). From the variation of M with respect to a reference M 0, a statistical strain tensor, U, which coincides with the classical definition of strain (Reference Aubouy, Jiang, Glazier and GranerAubouy and others, 2003), can be defined. As M 0 cannot be measured for natural ice, Reference DurandDurand and others (2004) assume that the deformation is isochoric, and that the reference state is isotropic, leading to the following expression:
(5)Note that some statistical tests, comparable to those presented in section 3.1.2, have been carried out to estimate the intrinsic variability of U that leads to ω(U) = 0.35N–1/2 (Reference DurandDurand and others, 2004).
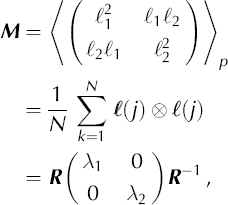

Note that Reference DurandDurand and others (2004) called M the texture tensor and used different notation. To avoid confusion with our definition of texture (see section 1), M will be denoted the microstructure anisotropy tensor.
4. Fabric Parameters
This section presents some tools that allow description of the fabric measured from a thin section containing Ng nonintersecting crystals. In this section each individual crystal is described by:
-
1. Its orientation c k. The orientation of the ice crystal is described by its c-axis orientation, which is defined by two angles: the co-latitude
(or tilt angle) and the longitude given in the local reference frame,
R,
which has its ē3 axis perpendicular to the thin section. The expression of ck
in this reference frame is
(6) -
2. Its volume-weighted fraction, fk . Larger crystals should have more influence on the polycrystal behaviour than smaller ones. As suggested by Reference Gagliardini, Durand and WangGagliardini and others (2004), to estimate the volume of grain k from 2-D thin-section measurements, one can assume that it is proportional to its measured cross-sectional area, Ak . Then, the volume-weighted fraction is:
(7)In what follows, the fabric of the polycrystal is given in terms of the distribution of the Ng c-axis orientations, c k, and the Ng weight fractions, fk .
 (or tilt angle) and the longitude
 given in the local reference frame,
R,
which has its ē3 axis perpendicular to the thin section. The expression of ck
in this reference frame is


4.1. Rotation of reference frame and polar representations
4.1.1. Rotation of reference frame
Most studies of ice fabrics use equal-area point plots (also named Schmidt point plots) to present the distribution of ck axes in a thin section (e.g. Reference Thorsteinsson, Kipfstuhl and MillerThorsteinsson and others, 1997; see also Fig. 4a). In the literature, the polar plots are represented in a horizontal reference frame, R h, i.e. the in situ vertical (the core axis) is at the centre of the polar plot (Reference LangwayLangway, 1958). Therefore, if thin sections are cut vertically, the fabrics need to be rotated for easier comparison of fabric diagrams. To obtain a horizontal projection from a vertical thin section, one needs to rotate ck as follows:
Point plots (a) and contour plots (b) of the inferred probability-density distributions of the fabric at 2999.8m depth in the Dome C ice core. The probability-density distribution, G, is contoured at levels of a = 1/(6π).


where and  are the longitude and co-latitude in the horizontal reference frame, and
 are those in the vertical frame. In this horizontal reference frame R
h; the
 axis points vertically upward. If the thin section is cut horizontally
R
=
R
h.
4.1.2. Equal-area (Schmidt) point plots and contoured data plots
The equal-area projection (Reference Kocks, Kocks, Tome and WenkKocks, 1998, p. 54) is achieved by the coordinate transformation:

and

This transformation takes all points in the upper hemisphere and projects them within a circle of radius  on the x-y plane. An equal-area point plot then simply puts a marker at the (xj, yj) location of each crystal orientation.
The purpose of presenting c-axis distributions is often to learn as much as possible about the fabric in nearby ice, not merely to present a specific dataset (Reference KambKamb, 1959). Now that data are collected using automatic methods (Reference WilenWilen, 2000), a collection of several hundred to over a thousand measured crystal orientations is common. This results in the problem of overlapping points when presenting the data on point plots. Some authors (Reference LangwayLangway, 1958; Reference KambKamb, 1959) have presented fabric information using contour plots.
Because any sample is limited in its size, Ng, we can, at best, get an imperfect estimate of the underlying population. Estimates that are robust are desirable. A new approach, which stems largely from Reference KambKamb (1959) is currently under development and is briefly described here. It is first assumed that there is an unknown ℓglobal’ orientation probability-density distribution, Ĝ(x), for the underlying large population of crystals. The data are then used to create a robust estimate, G(x), of Ĝ(x). With Ng data points, G(x) is represented as a superposition of Ng simpler normal probability-density distributions, gk (x), for N g sub-populations,

G(x) is then projected onto an equal-area diagram using Equation (10) to produce G(x, y).
For each crystal orientation, ck, the orientationdistribution density of the associated kth sub-population on a hemisphere centered on axis ck is defined as:

where β is a normalizing factor to account for the spread of the Gaussian on a hemisphere. In practice, β ≃ 1 if there are ten or more crystals to contour.
Each gk
(x) has a mean orientation given by ck, and the width of the component normal probability-density distribution is Ω = ΩM + ΩN, where ΩM is the spread due to measurement error, and ΩN represents spread due to limited sample size, Ng. Using numerical experiments, it can be shown that the ‘best’ Ω (for 40 or more crystals) is 
The expected value of G(x) for isotropic ice is E = 1/(2π), and real clusters should exceed the E + 1/(3π) contours, that is E ± 2σ, where σ = 1/(6π). The function G should be contoured at 2σ, 4σ, ... intervals, with larger spacing if very strong maxima occur. A comparison between a classical point plot and a contoured data plot is presented in Figure 4 for a Dome C texture sampled at 2999.8m depth. The contour plot with Ng = 80 illustrates very clearly the strength of the clustering of crystals near the vertical. Such an observation is less obvious in the point plot. More details will be given in a forthcoming paper.
4.2. Strength of fabric and spherical aperture
The strength of fabric (also called degree of orientation or strength of orientation) is a one-parameter fabric descriptor that has been widely used in the glaciology community. This is mainly because most of the observed ice fabrics are one-maximum or girdle-type fabrics and therefore present a symmetry axis.
The definition of the strength of fabric that can be found in the literature (Reference Thorsteinsson, Kipfstuhl and MillerThorsteinsson and others, 1997; Reference CastelnauCastelnau and others, 1998; Reference Gagliardini and MeyssonnierGagliardini and Meyssonnier, 2000) is:

where ‖.‖ is the norm of a vector. This definition of the strength of fabric assumes implicitly that the fabric has a symmetry axis and that this symmetry axis is the axis ē 3 perpendicular to the thin section. Therefore, this parameter is not objective since it depends on the reference frame where the sum is performed.
A more rigorous definition, but still not objective, for the strength of fabric, Rs, needs to first calculate the ‘best’ symmetry axis for the fabric. Later we will present two different methods to effectively determine this fabric symmetry axis, c. Here, assuming that c is known, the strength-of-fabric parameter is calculated as:

The sign operator allows us to perform the sum within the hemisphere centred on the fabric symmetry axis, c. Nevertheless, with this new definition, the same problem still occurs for the grains which have their c axis perpendicular to c, for which  · ck
= 0 and no sign can be determined. Note that, as mentioned previously, Equations (14) and (13) are equivalent only if C = e3.
The spherical aperture, os, is directly related to the strength of fabric by:

For isotropic ice Rs = 0 and as = 90° and for a singlemaximum fabric Rs=1 and as = 0°. For fabrics with girdle tendency, —1 ≤ R < 0 and, due to its definition, as is unusable.
4.3. ‘Best’ symmetry axis of a fabric
A first method to calculate the ‘best’ symmetry axis of a fabric is to use a least-squares method to minimize the sum of the squared angle between the symmetry axis and all the c axes, ck
. That is, we need to find which minimizes:

where Θk is the angle between and
c
k:

(assuming is a unit vector).
The absolute value in Equation (17) is to take into account that each vector
c
k
must be in the same hemisphere as . The minimum value of  depends on the fabric type. For a perfectly isotropic fabric
 and for a singlemaximum-type fabric
 , whereas for a girdle-type fabric
 . Due to the absolute value, this problem is not continuous and may present some local minima.
A second solution is to define the symmetry axis, C, as the first eigenvector obtained from the calculation of the eigenvalues of the second-order orientation tensor, as presented below. This tensor is obtained from the direct calculation of the average of the dyadic product of the c axes. By definition, there is no ambiguity from the c-axes orientations for the calculation of the second-order orientation tensor.
The difference in resulting from these two methods can be large, especially when the fabric is not concentrated. As an example, for a randomly distributed fabric, the angle between the obtained by the two different methods can be up to 30°. This is because for a perfectly randomly distributed fabric there are an infinite number of ‘best’ symmetry axes, (every axis is a symmetry axis for such a fabric).
In what follows, the ‘best’ symmetry axis is determined using the second method. Moreover, since both the strength of fabric, Rs, and the spherical aperture, σs, require knowledge of the mean symmetry axis of the grain orientations and, consequently, calculation of the eigenvectors of the second-order orientation tensor, we believe that, despite the historical point of view and comparisons with old datasets, there is no longer a reason to use these two parameters. As shown below, the second-order orientation tensor contains much more information and should be preferred.
4.4. Orientation tensors
4.4.1. Second-order orientation tensor
As suggested by Reference WoodcockWoodcock (1977), a good way to characterize the essential features of an orientation distribution is to use the second-order orientation tensor, a (2), defined as:

where ck
is given by Equation (6) and fk
by Equation (7). By construction,
a
(2) is symmetric and there exists a symmetry reference frame, R
sym (or principal reference frame), in which
a
(2) is diagonal. Let  denote the three corresponding eigenvalues and
 the associated eigenvectors, which correspond to the three base vectors of R
sym. The eigenvalues of
a
(2) can be seen as the lengths of the axes of the ellipsoid that best fit the density distribution of the grain orientations. The eigenvectors then give the axis directions of this ellipsoid.
The three eigenvalues  follow the relations:


For an isotropic fabric,  , and when the fabric is transversely isotropic, two of the eigenvalues are equal:

According to Reference WoodcockWoodcock (1977), fabrics that have equal girdle and cluster tendencies are such that 
 . Then, the use of the parameter

gives objective information about the fabric shape: k > 1 for single-maximum fabric and k < 1 for girdle-type fabric. As suggested by Reference WoodcockWoodcock (1977), one should use  as a measure of the strength of the preferred orientation. C varies from 0 for randomly distributed orientations to infinity when all the orientations are identical.
The three eigenvectors, °ei , define the ‘best’ material symmetry reference frame of the sample. It is often useful to calculate the angle between the main symmetry axis of the fabric, °e i, and the local vertical:

where the e h are the basis vectors of R h.
The study of higher-order orientation tensors allows investigation of the gap between the actual fabric and the orthotropic fabric constructed by the use of the second-order orientation tensor.
4.4.2. Higher-order orientation tensors
By definition, the fourth-order orientation tensor is:

The fourth-order orientation tensor contains more information about the fabric than the second-order orientation tensor and can reproduce non-orthotropic fabric. If the fabric is orthotropic then, by construction, the fourth-order orientation tensor has the same principal axis as the second-order one, and only 21 of its 81 components are non-nulls when expressed in the symmetry reference frame R sym. Moreover, according to Reference Cintra and TuckerCintra and Tucker (1995) only 3 of these 21 components are independent. The 21 non-null components are:

where aiijj denotes the series of components independent of the order of the indices  The 60 other components are zero for an orthotropic fabric.
For a natural non-orthotropic fabric, one can use the value of these 60 components as an estimate of the gap to orthotropy. These 60 components can be grouped in the two class families  . They are composed of 24 and 36 terms, respectively, but by construction, only 6 and 3, respectively, of these terms are different.
One can then define a fourth-order estimate of the gap to orthotropy of a fabric as:

Since, by definition, all the components of a(4) are lower than 1, we have  . For a perfect orthotropic fabric
 and larger values of
 indicate that the c axes do not fulfil the orthotropic symmetry conditions. Calculations on 140 samples along the EPICA Dome C core have shown a maximum value for of 2.11.
4.4.3. Odd-orders orientation tensor
Since a grain can be oriented using either ck or — ck, care must be taken in using the odd-order orientation tensors to describe the strength of fabric, Rs (the sum in the definition of R corresponds to the first-order orientation tensor). If one cuts all the grains into two equal parts, one oriented by ck and the other by — ck, it is obvious that all the components of the odd-order orientation tensors are nulls. Even if the odd orientation tensor is expressed in Rsym, the grains that lie in the plane (°e1,°e2) can still be oriented by either ck or —ck. As a conclusion, one should not use the odd-order orientation tensors to describe fabrics, as was mentioned above, for the strength of fabric, R s, or the spherical aperture, αs.
4.5. Average and dispersion of the c axes within a grain
Using an AITA, the initial measurement gives the orientation of each pixel in the sample. After extraction of the microstructure, one has to determine the mean orientation, ck , for each grain, as used in the previous sections. As for a grain, Equation (6) applies for the pixel orientation vector.
Since, similarly to a grain, a pixel can be oriented by either c
p or —cp, the mean orientation of a grain, ck
, cannot be calculated as the average value over the N orientations cp
. As for the whole thin section, the mean orientation of the grain has to be determined as the first eigenvector of the second-order orientation tensor calculated on the grain, i.e. for a given grain  , where
 is the first eigenvector of the second-order orientation tensor defined by Equation (18) in which Ng has been replaced by
 .
Contrary to a polycrystalline fabric, adjacent pixel orientations on the same grain should be very close except when crossing a subgrain. Nevertheless, some artefacts are still present for some pixels and these pixels need to be excluded from further calculations. Indeed, for a given view, the determination of the extinction angle constrains cp to lie along two orthogonal planes. The AITAs repeat the measurements for three different views that should unambiguously determine cp. Unfortunately, for some pixels the extinction position is not available for (at least) one of the views and this leads to ambiguities, i.e. some cp lie along plane (see the polar plots in Fig. 5). Also note that the pixels close to grain boundaries generally give a noisy determination of their cp.
(a) Distribution of the misorientation angle between °e1 and all the pixels of grain k = 7 in the texture sampled at 1525.8m on the EPICA Dome C ice core. The corresponding polar plot is also drawn (left). As this grain fulfils the condition for an included grain (see text),  is recalculated by excluding the pixels with a misorientation larger than 10°. The corresponding polar plot is also plotted (right). (b) Distribution of the misorientation angle between and all the pixels of grain k =9 from the same thin section and the corresponding polar plot. This grain is rejected from the analysis.

To remove these artefacts, we use the following procedure. For grain  is calculated a first time by taking into account all the
 pixels of the grain. Then the misorientation angle Θp between
 and cp is calculated for each pixel. Note that Θp belongs to the range [0; 90] as c
p can also be oriented by —cp. Distributions of Θp are plotted in Figure 5 for grains k =7 and 9 of a texture sampled at 1525.8m depth on the EPICA Dome C ice core. If 66% of the pixels do not present a Θp value smaller than 10° then the grain is rejected and will not be included in fabric parameter calculations. This is the case for grain k = 9. However, if the distribution of Θp is well centred around 0 (more than 66% of the pixels), is recalculated, with the pixels for which Θp ≥ 10° excluded from this new calculation, but they are still included in the area calculation. Note that most of the pixels presenting Θp ≥ 10° are close to the grain boundaries. This limit of Θp ≥ 10° takes into account that within a grain the rotation recrystallization can reach a maximum misorientation of ~10 to 15° (see section 4.7).
For large grains represented by a significant number of pixels, one can attempt to quantify the misorientation within a grain induced, for example, by rotation recrystallization. To this aim the eigenvalues of the second-order orientation tensor are studied. For a grain, assuming that all the pixel c axes are very close, one should expect  ≈ 1 and
 . If one assumes that all the pixel c axes are randomly distributed within a cone centred on and with a half-angle Θk, then the eigenvalues are

 . As an example, since two new grains are created if the rotation recrystallization distortion within the grain becomes larger than ~15°, one should not expect to find values of
 smaller than 0.99. The study of
 can then show whether the pixel c axes are randomly distrib-uted
 or if there exists a preferential direction of the misorientation
 . In the present paper, the large error in the pixel orientation measurement of our apparatus means we have not been able to obtain pertinent results.
4.6. Dispersion and error bars associated with the second-order orientation tensor
The standard deviation, σ
a(2), of a(2) is made up of (1) the uncertainties induced by the variability of the measurements,  , added to (2) the uncertainties induced by the sampling on a limited number of grains,
 .
In order to estimate , the same thin section presenting a nearly random fabric was measured ten times. Further measurements were not feasible, as the sample was sublimating during the experiment. For each grain present during the ten successive measurements, the mean c axis was calculated using the procedure described in section 4.5. As a result, the standard deviation of the misorientation for the ten measurements of ck
was found to be ~0.6° and not dependent on the grain orientation itself. Note that, even if sublimation was occurring during the experiment, no systematic bias was noticed in the grain c-axis measurements. This last point indicates that small variations of the sample thickness are not critical for the quality of the measurements. Then, to estimate , a random Gaussian noise with a standard deviation of 0.6° was added to all the ck
and the parameter a(2) was calculated. This procedure was repeated 200 times, allowing calculation of over the 200 draws. This method should be repeated for each sample in order to get an estimation of . However, experiments carried out on 140 samples have shown that can be neglected whatever the Ng, as it is at least one order of magnitude lower than . Nevertheless, for manual measurements, for which the standard deviation on the estimation of ck
is ~5°, may have to be taken into account to estimate  .
Following the method proposed by Reference Gagliardini, Durand and WangGagliardini and others (2004), a set of 231 fabrics of 10 000 grains each was numerically generated on a grid of the possible values of  , i.e. on the domain defined by
 and
 . Then, for a given fabric, we randomly chose Ng grains within the range [100;1000] and calculated the fabric parameters. For a given number of grains, Ng, this operation was reproduced 300 times and the standard deviation,
 , was calculated. This procedure was repeated for different values of Ng. Figure 6 shows the results for the second-order orientation tensor, a(2). In order to work with only one parameter, max
 is attributed to the nine components of tensor a
(2). Figure 6a shows the evolution of max
 for undersamplings with 100 ≤ Ng ≤ 1000 from a 10 000 grained initial fabric defined by
 (black dots). The central limit theorem is well respected as max
 depends linearly on
 . The slope of the linear regression, β, changes with the value of
 . It is worth noting that for a given value of , β is roughly the same (crosses and circles for = 0.8, stars and squares for = 0.6 in Fig. 6a). Figure 6b shows the evolution of β vs the value of for the 231 different fabrics. As we did not want to underestimate
 , we chose to make a second-order polynomial fit only on the largest values of each bin. From this polynomial regression, β, and thus can be easily estimated through:
(a) The max  induced by the sampling of Ng grains over an initial population of 10 000. Dots:
 crosses:

 . The corresponding linear regressions are plotted as solid lines. Circles:
 squares:
 . The corresponding linear regressions are plotted as dashed lines. (b) Slope of the linear regression as presented in (a) vs
 for the 231 textures tested. The maximum of each bin is marked with a cross, and corresponding second-order polynomial fit corresponds to the black curve.


Then we have  .
4.7. Misorientation of neighbouring grain pairs
Several studies propose the investigation of the misorientation between neighbouring grain pairs (Reference Alley, Gow and MeeseAlley and others, 1995; Reference Wheeler, Prior, Jiang, Spiess and TrimbyWheeler and others, 2001). The misorientation between two grains is defined as the angle, Θ, between the two c axes, and the distribution of Θ is calculated for all the neighbouring grain pairs within the texture; this distribution will be denoted DΘN. Note that the description of the whole texture is obviously required to calculate DΘN. Due to the evolution of the fabric with depth, direct comparison of DΘN between samples was not possible. Reference Alley, Gow and MeeseAlley and others (1995) proposed comparison of D0N with the distribution of angle misorientation of random grain pairs (DΘR) calculated by taking into account the Ng × (Ng — 1)/2 pairs within the sample (or a random subset). They argued that discrepancies between DΘN and DΘR should highlight the occurrence of recrystallization processes. Rotation recrystallization, which leads to a grain splitting into smaller grains with similar orientations, should present the highest population of low angles for DΘN compared to DΘR. Migration recrystallization produces grains at high angles to their neighbours (Reference PoirierPoirier, 1985) and should also be revealed by comparing DΘN and DΘR.
Here we propose a new method for calculating DΘR: the fabric is reshuffled while relations between neighbours are kept, i.e. the microstructure is unchanged. Two hundred distributions of the misorientation between neighbouring grain pairs are reproduced, leading to the estimation of a probability-density envelope. This method has been applied for a texture sampled at 1525.8m on the EPICA Dome C ice core (see Fig. 7). Numbers of low-angle misorientation between neighbouring pairs (0–10°) are significantly larger than would be expected for a random distribution, indicating that rotation recrystallization is certainly occurring. This confirms the results of Reference DurandDurand and others (2006) who argued, from results of a model, that rotation recrystallization should occur along the EPICA Dome C core.
Distribution of the misorientation between neighbouring grain pairs (black line), and the envelope of probability determined after the generation of 200 distributions of the misorientation between random pairs for a texture sampled at 1525.8m on the EPICA Dome C ice core. The changes in the grey intensity show the σ (68.3%, dark grey), 2σ (95.4%, grey) and 3o (99.7%, light grey) confidence levels.

Note that a misorientation is expressed by an angle but also by a rotation axis. The distribution of these axes could also reveal information concerning ice flow (Reference Wheeler, Prior, Jiang, Spiess and TrimbyWheeler and others, 2001). To our knowledge, such a distribution has not yet been used in glaciology, though it could be helpful in learning more about ice deformation.
5. The Texture Toolbox
To ease and homogenize texture data processing within the glaciological community, we propose some MATLAB® tools grouped in a texture toolbox. This toolbox has been designed to (1) completely fulfil the requirements proposed in this work, (2) easily manage a large amount of data and (3) have a user-friendly interface. The texture toolbox is briefly described here. More information, and a download are available online at http://www.gfy.ku.dk/~www-glac/crystals/micro_main.html.
The first part is devoted to the extraction of the microstructure and the calculation of the mean c axis of each grain. Automatic detection of grain boundaries is available through an adaptation of the algorithm proposed by Reference Gay and WeissGay and Weiss (1999), and manual corrections can be added to improve the microstructure quality. A tool has also been developed to check the quality of the microstructure by examining the c-axes dispersion within a grain (see section 4.5). Once the microstructure is complete, the average c axis within each grain is calculated and rotated into the horizontal reference frame. Then all the information required to describe the texture at the grain scale is recorded in a single file.
The second main part helps to manage the textural data. Each texture recorded by the tool described above can be imported (the depth of each texture is then specified). All the up-to-date parameters described in previous sections are calculated systematically and polar plots are prepared following the method presented in section 4.1.2 (classical Schmidt representation can also be chosen). If many textures are imported, the evolution of the different parameters can be plotted (vs depth, or age if a dating file is provided). All the plots can be exported, as well as the raw data. The list of the studied textures can be saved in a project file, allowing earlier work to be found.
This is open-source code, and we encourage anyone who has new interesting parameters to add them to the texture toolbox. Such a tool should help to greatly improve our understanding of ice deformation, and can be used to share up-to-date techniques of texture analysis.
6. Conclusions
Now that measurements of an ice thin section can be made automatically, with good statistics, measuring the texture is no longer an unrealistic task. As a consequence, we believe that some of the parameters used until now to characterize the microstructure (mean size of the 50 largest grains, aspect ratio) and the fabric (Rs, αs ) should no longer be used, except for comparison with earlier work. More robust definitions can be proposed to better describe the observed texture. It is also worth noting that intrinsic variability of the measurements has been estimated through models and statistical tests.
AITAs are, unfortunately, not widespread in the glaciological community. However, most of the recommendations presented here can also be followed for manual measurements. As an example, can be calculated if only the fabric is measured; in this case fk is simply equal to 1/Ng.
It is also very important to note that both microstructure and fabric should be measured together on the same sample. Indeed, Reference Gagliardini, Durand and WangGagliardini and others (2004) show that grain area should be used as a statistical weight for polycrystal constituents to improve the description of the observed fabric. Moreover, complete texture measurements allow one to look at relations between neighbouring grains, which could give useful indications that recrystallization processes are occurring (see section 4.7).
Acknowledgements
The main part of this work was inspired by discussions arising during an International Workshop on the Intercomparison of Automatic Ice Fabric Analyzers held at the Niels Bohr Institute, University of Copenhagen, 24–26 January 2002. We are grateful to the two anonymous reviewers for their very helpful comments. This work is a contribution to the European Project for Ice Coring in Antarctica (EPICA), a joint European Science Foundation/European Commission scientific programme, funded by the European Union and by national contributions from Belgium, Denmark, France, Germany, Italy, the Netherlands, Norway, Sweden, Switzerland and the United Kingdom. The main logistic support was provided by Institut Polaire Français-Emile Victor (IPEV) and Programma Nazionale di Ricerche in Antartide (PNRA) (at Dome C) and the Alfred Wegener Institute (at Dronning Maud Land). This is EPICA publication No. 156.



