1 Introduction
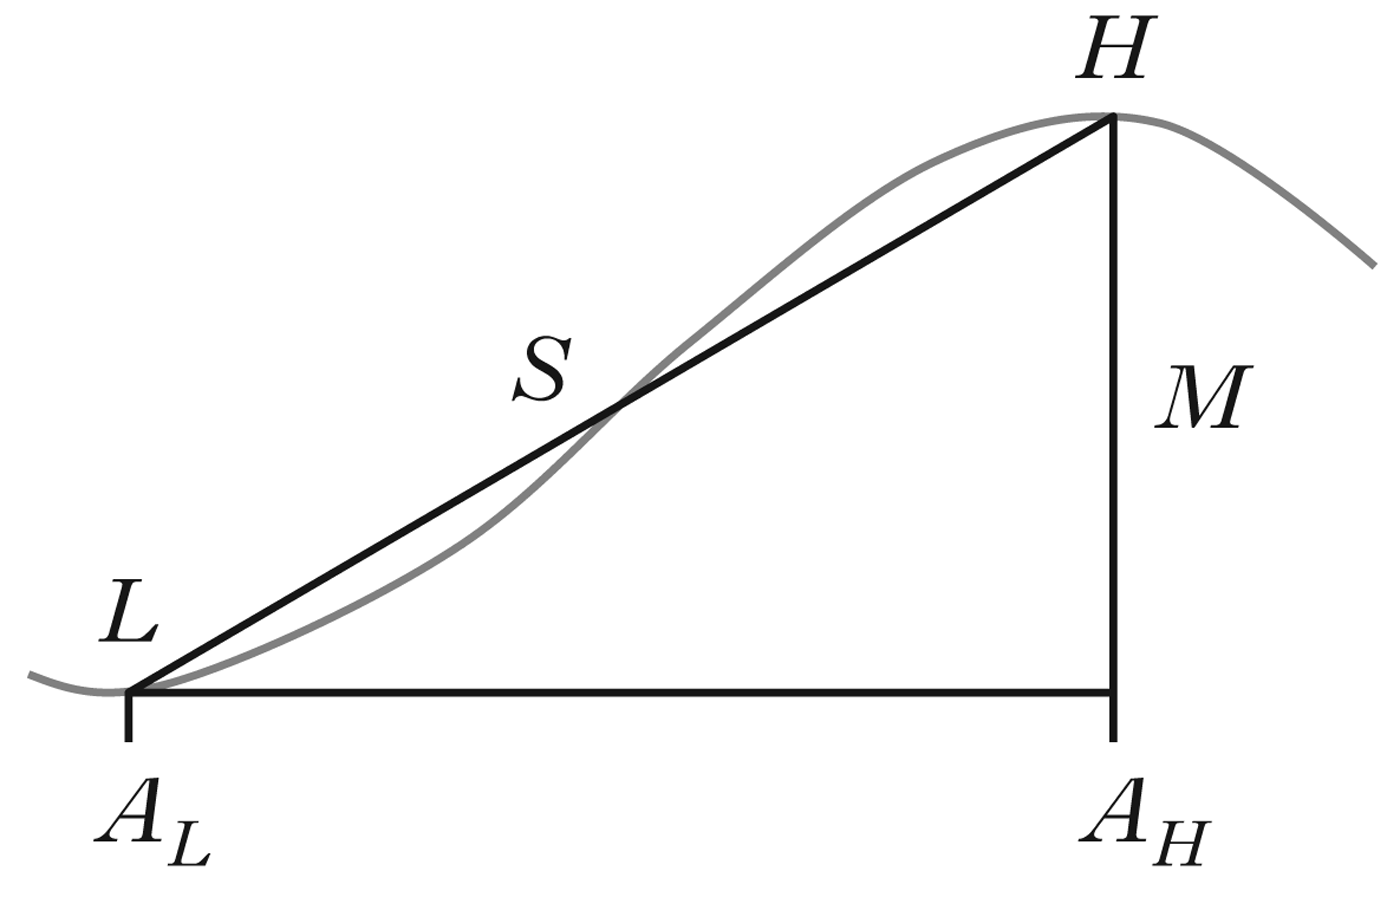
In principle, the pitch movement for a contour tone can be characterised in terms of a variety of properties. For example, a rising F0 movement of the kind illustrated schematically in Fig. 1 can be described in terms of the timing of the onset (L) and offset (H) of the rise with respect to landmarks (or ‘segmental anchors’) in the segmental string (labelled AL and AH), the pitch levels of L and H, the magnitude, M, of the rise in F0, and the average slope of the rise, S, among others. Many of these properties can be derived from each other. For example, the magnitude of the rise is equal to the difference in the pitch levels of L and H, and the average slope is equal to the magnitude of the rise, divided by the duration between L and H. Accordingly, only a subset of these properties is needed to specify a rising F0 movement, and theories of the phonetic implementation of tones posit that contour tones are specified in terms of targets for various subsets of these properties.
A schematic illustration of a rising F0 movement. L and H are the onset and offset of the F0 movement, A L and A H mark positions in the segmental string that serve as segmental anchors for L and H, M is the magnitude of the F0 rise and S is its average slope.

For example, many models of tonal realisation follow the general outlines of Pierrehumbert's (Reference Pierrehumbert1980) analysis of English intonation. Pierrehumbert adopts the standard phonological analysis, according to which contour tones are composed of sequences of level tone specifications (Goldsmith Reference Goldsmith1976). Each tone unit, whether a simplex tone or part of a contour tone, is hypothesised to be realised by a level target specified for fundamental frequency and alignment with respect to the segmental string. Transitions between these level targets are derived by general interpolation mechanisms, so properties of transitions, such as their slopes, are not regulated by phonetic targets (Pierrehumbert Reference Pierrehumbert1980: 47–52). This claim is explicitly articulated by Ladd and colleagues as part of the segmental anchoring hypothesis, according to which ‘the beginning and end of a pitch movement are anchored to specific locations in segmental structure, while the slope and duration of the pitch movement vary according to the segmental material with which it is associated’ (Ladd Reference Ladd, Quené and van Heuven2004: 123). This approach has been applied successfully to the analysis of the realisation of rising pitch accents in languages such as Greek (Arvaniti et al. Reference Arvaniti, Ladd and Mennen1998).
However, the slope of the F0 trajectory during a tone is an important cue to the distinction between level and rising tones in a language like Mandarin (Gandour Reference Gandour and Liem1979, Reference Gandour1984, Massaro et al. Reference Massaro, Cohen and Tseng1985), so we might expect such tones to have a specified target for the slope of the transition, contrary to the segmental anchoring hypothesis. For example, a rising tone could be specified in terms of alignments of L and H, the slope of the rise and the pitch level of L. The magnitude of the rise and the pitch level of H would then follow from the slope and duration of the rise. Models of Mandarin tone realisation that incorporate targets pertaining to the shapes of pitch movements have been proposed by Kochanski et al. (Reference Kochanski, Shih and Jing2003) and Xu & Wang (Reference Xu and Wang2001). Slope targets have also been proposed in the context of a model of intonation by ’t Hart et al. (Reference Hart, Collier and Cohen1990: 72–77).
This study investigates the phonetic specification of the Mandarin rising tone (tone 2), testing for targets for three of the properties illustrated in Fig. 1: (i) the alignment of L and H to the segmental string, (ii) magnitude and (iii) slope. The decision to analyse the magnitude of the rise rather than the pitch levels of L and H does not result from an assumption that there is a magnitude target rather than independent targets for the pitch levels of L and H. Rather, our data do not allow us to distinguish these possibilities, because we only examine the rising tone in a single tonal context, as discussed further below.
The nature of the tonal targets is investigated by examining the realisation of the rising tone under variation in time pressure (cf. Caspers & van Heuven Reference Caspers and van Heuven1993). If the rising tone has targets for a subset of the properties under investigation, then those properties should not vary as a function of speech rate, whereas unspecified properties should vary systematically with speech rate.
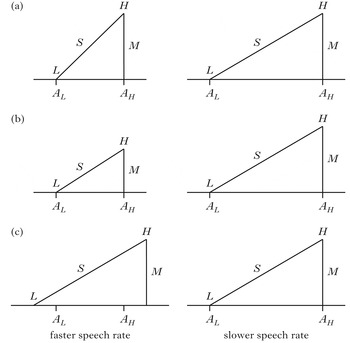
For example, if the onset and offset of the rise are consistently aligned to segmental anchors such as the middle and end of the syllable, then as speech rate increases, moving the anchors closer together, the duration of the rise should decrease. If speakers also try to maintain a target magnitude of F0 rise, then a decrease in rise duration will result in increased slope (Fig. 2a). On the other hand, if there is a constant slope target but magnitude is unspecified, then an increase in speech rate will result in a rise of smaller magnitude (Fig. 2b). If speakers try to keep both slope and magnitude constant, then the duration of the rise must be constant, and consistent segmental anchoring will not be possible, so alignment of L and H with respect to the segmental string should vary as a function of speech rate, with L occurring earlier in the syllable and/or H occurring later in the syllable as syllable duration gets shorter (Fig. 2c). Thus the patterns of variation in tone realisation as speech rate changes can reveal the nature of the targets of the rising tone.
Schematic illustration of the predicted effects of variation in time pressure on the realisation of a rising tone. The left of each panel represents a faster speech rate than the right, so the segmental anchors A L and A H are closer together. (a) L and H are consistently aligned to their respective segmental anchors and M is constant, so S increases as speech rate increases. (b) L and H are consistently aligned to their respective segmental anchors and S is constant, so M decreases with increasing speech rate. (c) S and M are constant, so alignment of L and H with respect to anchors A L and A H varies as a function of speech rate.

We will see that all of these properties of the Mandarin rising tone vary as a function of speech rate, so it is not possible to make a division into targeted and contingent properties of the tone. Rather, the patterns of variation can be accounted for by positing violable targets for all of the properties under consideration. These results imply that a model based on point targets plus general interpolation mechanisms cannot provide an adequate account of tonal realisation – it is necessary to allow for targets that pertain to the properties of the transition between the endpoints of a contour tone, such as the slope of the transition. However, the results also show that it is not possible to substitute transition targets for any of the targets pertaining to the endpoints of the rise: the slope target is required in addition to targets for the endpoints.
Specifying targets for L, H, M and S involves a form of ‘overspecification’, since the targets generally cannot all be realised. For example, as noted above, the slope can be calculated from rise magnitude together with the timing of L and H, so a slope target generally conflicts with targets for tone alignment and M. We will see that the patterns of variation in the realisation of the rise as a function of speech rate can be analysed as resulting from a compromise between the conflicting demands of these targets. This analysis has implications that extend beyond the specific case of contour tones, because it implies that phonetic realisation can operate in terms of violable targets, and that it incorporates mechanisms for the resolution of conflicts between targets. Specifically, we show that the analysis can be formalised in terms of a model according to which phonetic realisations are optimised with respect to weighted, potentially conflicting constraints (Flemming Reference Flemming2001).
2 Experiment
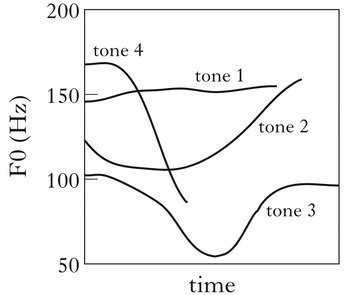
Mandarin contrasts four full tones: high level (tone 1), rising (tone 2), low falling-rising (tone 3) and falling (tone 4), illustrated as spoken on isolated monosyllables in Fig. 3. This study examines the rising tone. The goal was to investigate the realisation of this tone as the duration of the syllable bearing the tone varies. The duration of the syllable with which the tones were associated was varied by selecting syllables whose segments varied in inherent duration – e.g. high and low vowels – and by eliciting them at three different speech rates.
Pitch tracks of the four Mandarin tones, produced on isolated words (recordings from http://www.phonetics.ucla.edu/vowels/chapter2/chinese/recording2.1.html).

2.1 Speech materials
The materials consisted of fourteen target syllables, each bearing a rising tone. These target syllables were initial in disyllabic words where the second syllable also bears a rising tone, as in (1). All words consisted entirely of sonorant sounds. The full materials also included one additional word of the same form but beginning with a voiced stop, which was excluded from analysis due to the strong effects of the stop on fundamental frequency. There were five additional words in which a rising tone was followed by a neutral-toned syllable, not analysed here, and nine fillers consisting of three and four syllable words with various combinations of tones. All words were produced in the carrier phrase [tçhìŋ nǐn pà __ tsâi »ↄ́ jǐ bjὲn] ‘please say __ again’, so the target tones were preceded by a low tone and followed by a rising tone.
-
(1)


2.2 Participants and procedure
The subjects were four native speakers of Beijing Mandarin Chinese, two male (one in his forties, the other in his sixties) and two female (one in her twenties, the other in her sixties). They were paid for their participation in the study.
The sentences were presented on paper in a randomised order. Subjects were asked to read all of the materials twice at each of three speech rates: first at a self-selected rate, then at a faster speech rate and finally at a slower rate. Recordings were made in a sound-attenuated booth, using a Shure SM10A close-talking microphone.
Two speakers produced one item ([njε̌nlǐŋ]) with a falling or neutral tone on the second syllable rather than the expected rising tone, so these utterances were excluded from analyses. Nine additional utterances were discarded due to problems with pitch tracking, leaving a total of 315 tokens with rising tones.
2.3 Measurements
The basic measurements taken from each token were the timing of segment boundaries and the timing and level of the onset and offset of the F0 rise associated with the rising tone and the F0 levels at these times. All times were measured relative to word onset.
Segment boundaries were labelled by hand in Praat (Boersma & Weenink Reference Boersma and Weenink2009), with reference to spectrograms and waveforms. Boundaries between consonants and vowels were straightforward to identify, based on rapid changes in intensity, accompanied by abrupt spectral changes.Footnote 1 Boundaries between consonants in words like [mǐŋ.mǐŋ] were often marked by visible release of the first consonant or abrupt spectral changes, but were hard to identify in some cases. As discussed below, the temporal midpoint of the intervocalic cluster proved to be more relevant to the timing of F0 events than the release of the first consonant, so we did not have to rely on these measurements.
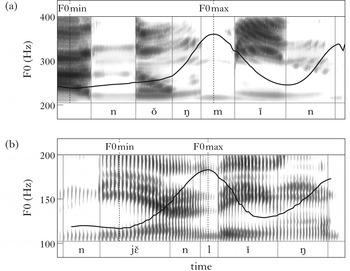
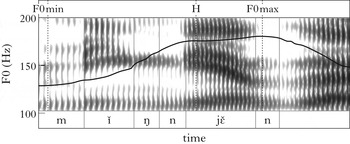
In many studies of rising pitch accents, the onset and offset of the rise are taken to correspond to the F0 minimum and maximum respectively. Here we adopt the assumption that the F0 maximum corresponds to the offset of the rise, H, (with a few exceptions discussed below), but the F0 minimum does not appear to be a significant F0 event in the realisation of the Mandarin rising tone. This is because the F0 trajectory of the rising tone often shows a relatively level interval followed by a rise (Fig. 4), and the timing of the F0 minimum varies substantially as a function of minor variations in the realisation of the low plateau. For example, in Fig. 4a the F0 minimum precedes the target syllable, because the low plateau rises slightly, whereas in Fig. 4b it occurs much later, because the low plateau falls slightly. The low plateau at the beginning of the rising tone is plausibly analysed as the result of interpolation between a low target at the offset of the preceding low tone and a low target at the onset of the final rise. This interpretation is supported by the fact that F0 falls steadily to the onset of the final rise when a rising tone is preceded by a high tone (Xu Reference Xu1997: 69, Chen & Gussenhoven Reference Chen and Gussenhoven2008: 730) – both patterns can be accounted for by smooth interpolation between the last target of the preceding tone and the low target at the onset of the final rise in the rising tone. Accordingly, we take the F0 event corresponding to L to be the onset of the rapid final rise (cf. Shih Reference Shih1988: 85, Xu Reference Xu1998: 196f, Chen & Gussenhoven Reference Chen and Gussenhoven2008: 730). This time point was identified algorithmically, as described below.
Pitch tracks and spectrograms of (a) [nǒŋmǐn] ‘farmer’ and (b) [njε̌nlǐŋ] ‘age’.

Although H was identified as the local maximum in F0 in the great majority of cases, there were six utterances produced at a fast speech rate where the second rising tone was so reduced that it was produced without any local minimum in F0. Instead the F0 rise slowed after the first tone, but continued to rise, peaking late in the second syllable, as in Fig. 5. In these cases, it is clear that the F0 maximum belongs to the second rising tone, so H is marked at the ‘shoulder’ where F0 becomes level, or close to level, after the initial rise.
Pitch track and spectrograms of [mǐŋnjε̌n] ‘next year’, produced at a fast speech rate. The second rising tone is realised as a high plateau followed by a slight F0 rise.

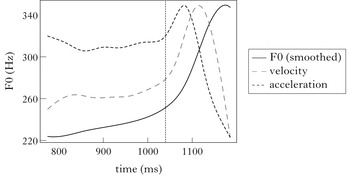
The identification of the onset of the rise involves identifying inflection points or ‘elbows’ in the F0 trajectories, a notoriously difficult problem (e.g. del Giudice et al. Reference del Giudice, Shosted, Davidson, Salihie, Arvaniti, Trouvain and Barry2007). We identified the onset of the rise on the basis of the velocity and acceleration of the F0 trajectory. Velocity and acceleration were calculated by fitting a fourth-order natural smoothing spline to the F0 trajectory from 10 ms before the F0 minimum to 20 ms after the F0 maximum, using the smooth.Pspline function from the R pspline package (Ramsay & Ripley Reference Ramsay and Ripley2013), with smoothing parameter set to 10 − 11, then calculating derivatives of the smoothed curve.
The starting point for this approach is the observation that the onset of the final rise could be identified as the point at which F0 velocity rises above zero if the low plateau were always perfectly flat or falling. While examples like Fig. 4a show that the plateau can in fact rise, its velocity is relatively low compared to the final rise, so identifying the onset of the rise as the point where velocity exceeds a threshold of 20% of peak velocity generally avoids misidentifying a rising plateau as part of the final rise, while remaining close to visually identifiable elbows in the F0 trajectory. More precisely, the onset of the rise is taken to be the point at which velocity exceeds 20% of maximum and remains above that level until the velocity peak, because brief rises above the 20% threshold are generally due to segmental perturbations.
This velocity-based criterion fails in a small, but non-negligible, number of examples where a rising plateau exceeds 20% of peak velocity but there is still a clear elbow marking the onset of the final rise, so the algorithm can be improved by taking F0 acceleration into account as well. A plateau has relatively constant velocity even if it is rising, so the transition to the final rise is marked by a rise in acceleration as well as velocity, with acceleration reaching a local maximum before the point of peak velocity, as in Fig. 6.Footnote 2 Accordingly, we identify the onset of the rise as the first point after velocity exceeds 20% of its maximum, where acceleration also exceeds 25% of its local maximum. This point is marked by the vertical line in Fig. 6. However two qualifications have to be added. (i) Segmental perturbations of F0 can also give rise to local maxima in acceleration; however, these local maxima are usually smaller than maxima associated with an elbow in the trajectory, so an acceleration maximum is only taken to indicate the presence of an elbow if it exceeds a preceding acceleration minimum by at least 1500 Hz/s/s. (ii) If no such acceleration maximum is observed, that generally indicates that there is no plateau present, or that the plateau ends close to the F0 minimum, so the rise onset is identified based on the velocity criterion alone (i.e. the point where velocity reaches 20% of its maximum). These thresholds were selected to yield a good match to visually obvious elbows in the F0 trajectories. Relatively high thresholds were required to avoid misidentifying segmental perturbations of F0 as the onset of the rise.
Trajectory between F0 minimum and maximum (solid line), smoothed with 4th order natural smoothing splines, plotted with velocity (dashed grey line) and acceleration curves (dashed black line) calculated from the smoothed F0. The vertical line marks the onset of the final rise, as identified by the algorithm described in the text.

The resulting L measurements were highly correlated with measurements obtained in earlier analyses using an algorithm based on piecewise linear approximation to the F0 trajectory (Cho Reference Cho2010, Cho & Flemming Reference Cho, Flemming, Lee and Zee2011; cf. D'Imperio Reference D'Imperio2000, del Giudice et al. 2007). The disadvantage of the linear approximation algorithm is that it assumes the presence of a low plateau, but in fact the plateau can be absent, particularly at fast speech rates. However, exactly the same patterns were observed in statistical analyses of the linear approximation L measure as are reported in §3.1 for L derived from the velocity/acceleration algorithm, indicating that these results are not dependent on the details of the algorithm used to identify the onset of the rise.
Having located L and H, M is then calculated as F0 at H minus F0 at L, and the average slope is M divided by the duration from L to H. Peak velocity was also measured from the smoothed velocity curve. We focus on average slope, since its mathematical relationship to M, L and H slightly simplifies the model proposed in §4.2, but it is highly correlated with peak velocity (r = 0.98), so the two are largely interchangeable in the analyses that follow.
3 Results
The immediate goal of the experiment is to test whether the measured properties of the rising tone vary systematically as a function of segmental durations. We first investigate the timing of the onset, L, and offset, H, of the rise, then turn to the magnitude and slope of the rise.
3.1 Segmental anchoring
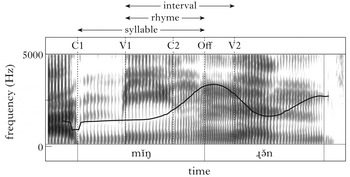
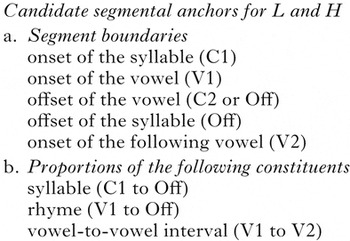
The claim that the onset and offset of the rising tone should be invariantly aligned to fixed segmentally defined locations, regardless of segmental durations, is part of the segmental anchoring hypothesis (Ladd Reference Ladd, Quené and van Heuven2004). To investigate this hypothesis with respect to the Mandarin rising tone, we conducted a search for segmentally defined points that are consistently aligned with L and H respectively across variations in speech rate and segmental make-up of the syllable. Based on previous work on tonal alignment in general and on the alignment of the Mandarin rising tone in particular, we identified a set of candidate segmental anchors of two types: segment boundaries, such as the onset of the vowel, and proportions of phonological constituents, such as the middle of the syllable. The full set is given in (2), and the relevant time points are illustrated in Fig. 7.
-
(2)
Pitch track and spectrogram of a bisyllabic target word, [mǐŋʵə̌n] ‘celebrity’, showing the locations of the segment boundaries and constituents listed in (2).

The syllable is taken to begin at the formation of the constriction for the onset consonant, so a CV syllable extends from the beginning of C1 to the formation of the constriction for the onset of the following syllable (labelled ‘Off’ in Fig. 7). As noted above, the offset of a CVC syllable can be difficult to identify when it is located in the middle of a -CC- cluster (e.g. [mǐŋ.mǐŋ], and the precise location of the closure for the second consonant is sometimes unclear from the acoustic signal. It turned out that locating the offset of CVC syllables at a point halfway through the duration of the -CC- sequence yielded better models of tone timing than trying to identify the consonant boundary, and this is the criterion adopted in the analyses reported below. The offset of the vowel coincides with the syllable offset in CV syllables, and with the onset of C2 in CVC syllables. The rhyme extends from the onset of the vowel, V1, to the offset of the syllable, Off. The vowel-to-vowel interval (Farnetani & Kori Reference Farnetani and Kori1986, Steriade Reference Steriade2012) extends from the onset of the first vowel, V1, to the onset of the vowel of the following syllable, V2, so in the word [lěilěi] the relevant interval is the sequence [ěil], while in the word [mǐŋmǐŋ] it is the sequence [ǐŋm].Footnote 3
The candidate segmental anchors were evaluated by comparing the goodness of fit of models predicting the timing of L and H based on each anchor. If a given segmental boundary is the anchor for a tone, then that tone should always occur at that boundary, or at a short fixed interval preceding or following it. This implies a model of tone timing of the form shown in (3), where T is the time of L or H, A is the time of the candidate anchor and c is a constant, i.e. the interval between segmental landmark A and tone T is c ms.
-
(3)

Candidate anchors defined in terms of proportions of constituents were evaluated by fitting the models shown in (4), where p represents the proportion of the relevant constituent, and is estimated in fitting the models. These models state that the interval between T and the onset of the relevant constituent is a fixed proportion of the duration of that constituent. For example, the onset of the syllable is C1, so T − C1 is the interval between T and the onset of the syllable, and the offset of the syllable is Off, so Off − C1 is the duration of the syllable. So if T − C1 = 0.5 × (Off − C1), then T is aligned to middle of the syllable.
-
(4)

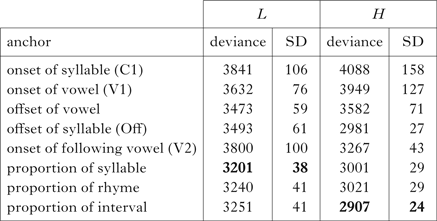
All models were fitted as linear mixed effects models using the lmer function from lme4 (Bates et al. Reference Bates, Maechler, Bolker and Walker2014), with random effects by subject for the free parameter in each model, so each fitted model has two parameters: a fixed effect, and a corresponding random effect.Footnote 4 The best anchors were taken to be those which yielded the best-fitting models of L and H respectively, assessed by comparing the deviances of the models (lower deviance indicates better fit to the data). The results are summarised in Table I, where the deviances of the models for each candidate anchor are presented together with the standard deviation of the residual error, which is similar to the root mean square error of the fitted values.Footnote 5
Deviances and standard deviations of the residuals of the models for each of the candidate segmental anchors for the onset, L, and offset, H, of the rising tone. The values for the best-fitting model for each tone are in bold.

The best-fitting anchor for L is at 56% of the syllable duration, so L tends to occur a little over halfway through the syllable. The best-fitting anchor for H is 82% of the way through the vowel-to-vowel interval. This is generally a little after the syllable offset, but the vowel-to-vowel interval-based characterisation provides a better fit than aligning H to the end of the syllable, because H tends to occur later when the onset of the following syllable is longer. These results are in line with previous studies of the Mandarin rising tone by Shih (Reference Shih1988), Xu (Reference Xu1998) and Chen & Gussenhoven (Reference Chen and Gussenhoven2008), as discussed in more detail below.
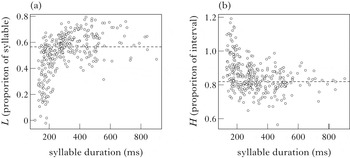
Although the tones remain close to these best anchor points, there are systematic deviations from the alignment targets as a function of syllable duration (Fig. 8), so tonal alignment is not invariant. Fig. 8a shows L timing as a proportion of syllable duration, plotted against syllable duration. Since the mean best anchor for L is at 56% of syllable duration, this plot makes it easy to see the position of L relative to this anchor, plotted as a dashed line. It can be seen that L precedes this anchor at short syllable durations (i.e. fast speech rates), occurring as early as the syllable onset at the shortest durations. The H tone displays the converse pattern, following its anchor at short syllable durations, as shown in Fig. 8b. Since the best anchor for H is a proportion of the vowel-to-vowel interval, H timing is plotted as a proportion of interval duration, with a dashed line at the mean anchor proportion, 82%. H tends to occur much later than this anchor at the shortest durations, even occurring in the vowel of the following syllable. These plots also serve to illustrate that the speech-rate manipulation was successful in eliciting a wide range of syllable durations.
Scatter plots of the timing of (a) L and (b) H as a function of syllable duration. L timing is plotted as a proportion of syllable duration and H timing as a proportion of interval duration, with the timing of the segmental anchors indicated by dashed lines.

The effect of syllable duration on deviation from these segmental anchors is statistically significant, as shown by fitting a linear mixed effects model with the residuals of the strict segmental anchoring models as the dependent variable and syllable duration as predictor, with random slopes and intercepts by speaker, and comparing to models that eliminate the fixed effect of syllable duration with Likelihood Ratio Tests (L residuals: β = 0.1, χ2(1) = 6.1, p < 0.05; H residuals: β = − 0.05, χ2(1) = 7.6, p < 0.01).
It should be noted that a purely linear dependence of residuals on duration could be captured by adding an intercept term to the segmental anchoring models, effectively adopting a tone-timing model of the form T − C1 = p(Off − C1) + c.Footnote 6 Such a model could be interpreted as a segmental anchoring model, but the implied anchors would not constitute segmental landmarks in any obvious sense. For example, the implied segmental anchor for L would be 39 ms before the point 67% of the way through the syllable. In any case, we will see that the systematic deviations from strict segmental anchoring can be derived from the interaction of a simple segmental anchoring requirement with independently motivated constraints on tone realisation, avoiding the need to stipulate such complex anchors.
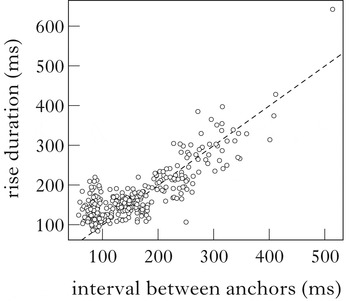
The fact that at fast speech rates L precedes and H follows their respective anchors means that the duration of the F0 rise from L to H varies less than would be expected if these tones precisely tracked their respective anchors. As observed above in the discussion of Fig. 2, this pattern of realisation would be expected if speakers attempt to maintain a constant value for the magnitude of the rise and its slope, because that entails that the duration of the rise must also remain constant. However, the deviations from the segmental anchors are not large enough to maintain a constant rise duration, as illustrated in Fig. 9. This figure plots rise duration, H − L, against the duration of the interval between the segmental anchors for L and H. If the tones were consistently aligned to their anchors, then rise duration should be equal to the interval between anchors, and the points should cluster around the dashed ‘y = x’ line. If rise duration were constant, the points should form a horizontal line. The observed pattern lies between these two extremes: rise duration varies substantially as a function of the interval between the anchors, but falls short of longer intervals between anchors, and does not decrease much as the interval between anchors falls below 200 ms, so that rise duration can be substantially longer than the interval between anchors at short syllable durations. We will see in §4 that this pattern can be analysed as a compromise between the goals of aligning L and H to their segmental anchors and maintaining fixed targets for M and S (and hence for rise duration).
Scatter plot of rise duration ( H-L ) as a function of the interval between the segmental anchors for L and H. The dashed line indicates where rise duration is equal to the interval between the anchors.

Similar patterns of variation in the alignment of L and H are reported by Xu (Reference Xu1998) in a related study of the effects of speech rate and syllable structure on the realisation of Mandarin tones. His correlate of the onset of the rise, the acceleration maximum, occurs around 60% of the way through the estimated syllable duration when this is long, but generally occurs progressively earlier as syllable duration decreases (1998: 198ff). H occurs at, or after, the onset of the following vowel at the fastest speech rates, and progressively earlier as syllable duration increases. In comparing the two studies it should be noted that, in addition to the different criteria for identifying L, the rising tones in Xu's study were elicited between a high tone and a falling tone, as opposed to the low-rising context employed here. A preceding high tone tends to push the onset of the rise later at short syllable durations, due to the time it takes to realise the fall from the preceding high tone, as observed in the study by Chen & Gussenhoven (Reference Chen and Gussenhoven2008: 737, Fig. 9).
Chen & Gussenhoven investigated the timing of the onset of the rise in tone 2 under variation in syllable structure and degree of emphasis (simple statement, correction and repetition of the correction in response to simulated mishearing), which elicited a wide range of syllable durations. In spite of the fact that the duration variation was elicited by varying emphasis rather than speech rate, the results for the timing of the rise onset are remarkably similar to those reported here: the timing of the onset of the rise is well approximated by a linear function of syllable duration with slope of 0.72 and intercept of —25 ms (measured from their Fig. 8), compared to the slope of 0.67 and intercept of —39 ms described above for the present data. That is, their L correlate occurs at about two-thirds of the way through the syllable at the longest syllable durations, and progressively earlier in shorter syllables. Some of the difference may be attributed to the fact that Chen & Gussenhoven's data includes rising tones preceded by high tones as well as low tones (see §4.6 for further discussion of the effects of tone context).Footnote 7
3.2 Magnitude and slope of the rise
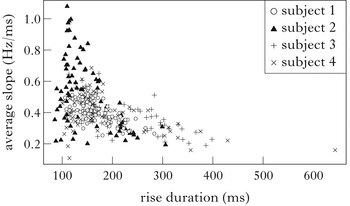
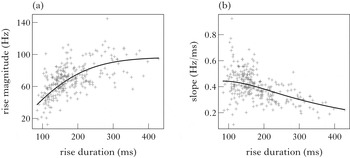
We saw in the previous section that rise duration increases as syllable duration increases, so either the magnitude of the rise must increase as well, or the slope of the rise must decrease. That is, if the magnitude of the rise remains constant, then an increase in duration implies that the slope of the rise gets shallower (Fig. 2a). On the other hand, if the slope remains constant, then an increase in rise duration implies an increase in the magnitude of the rise (Fig. 2b). In fact we observe both effects: magnitude increases with increasing rise duration (Fig. 10), but not sufficiently to maintain a constant slope, so slope decreases with increasing rise duration (Fig. 11).
Scatter plots for four speakers of M as a function of rise duration (H-L). (a) shows raw rise magnitude (Hz); (b) shows normalised rise magnitude.

Scatter plot for four speakers of S as a function of rise duration (H-L).

The general pattern observed in Fig. 10a is that, as rise duration increases from its lowest values, M first increases rapidly, then levels out. However, there is a set of points that do not conform to this pattern, having high rise magnitudes relative to their rise durations of around 100–175 ms. These higher values for M translate into high slopes relative to duration in Fig. 11. Most of these observations are due to a single speaker (subject 2) using a higher, wider F0 range throughout the sentences produced at normal rate, compared to her fast and slow renditions.
This observation makes the point that M and S depend on pitch range as well as rise duration, which raises the question whether we could obtain a clearer picture of the relationship between duration and rise magnitude if we could normalise the data to factor out variation due to pitch range. A straightforward approach to normalising for pitch range is to convert F0 measurements to speaker-specific z-scores (Rose Reference Rose1987). That is, frequency is measured in terms of standard deviations from the mean F0, where means and standard deviations are calculated for each speaker. This procedure effectively distinguishes two components of pitch range: overall level, which is captured by mean F0, and the span, or ‘range of frequencies used’ (Ladd Reference Ladd2008: 197), which is quantified by the standard deviation.
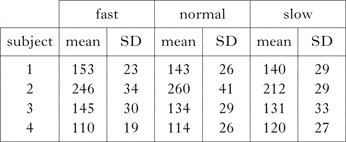
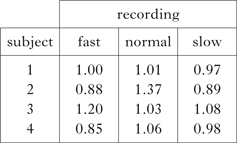
Speaker-specific normalisation is insufficient, because pitch range can vary within speakers, as demonstrated by subject 2, so instead we normalise the recordings made at each speech rate separately for each speaker. Table II reports means and standard deviations calculated using Praat from pitch tracks of the complete recording at each speech rate for each speaker.Footnote 8 These figures confirm the impression that subject 2 exhibited greater variation in pitch range than the other subjects.
Means (in Hz) and standard deviations calculated from all F0 measurements from each speech rate for each subject.

Rise magnitude is inherently normalised for variation in overall pitch level, since it is the difference between L and H pitch levels that are produced in the same pitch range, so normalising rise magnitude effectively involves dividing it by the standard deviation for the relevant speaker and rate. Normalised rise magnitude is plotted against rise duration in Fig. 10b.
The effect of duration on both raw and normalised magnitude is statistically significant: a linear mixed effects model predicting rise magnitude as a function of duration, with random slopes and intercepts by speaker, fits significantly better than a model according to which rise magnitude is constant, with the same random effects (raw rise magnitude: χ2(1) = 8.8, p<0.01; normalised rise magnitude: χ2(1) = 11.4, p<0.001). A similar test shows that the effects of duration on raw and normalised slope are also significant (raw slope: χ2(1) = 5.8, p<0.05; normalised slope: χ2(1)= 13.3, p < 0.001).
While z-score normalisation of rise magnitude does succeed in bringing subject 2's normal speech rate data closer to other speakers, it is ultimately unsatisfactory, because F0 standard deviations appear to reflect undershoot due to speech rate as well as true variation in pitch range. That is, the standard deviations in Table II tend to decrease as speech rate increases. This is plausibly because there is more undershoot of tonal targets at higher speech rates, as documented in Fig. 10a, and undershoot reduces the difference between high and low tones, thus reducing standard deviation of F0. In other words, normalising with respect to rate-specific standard deviations removes some of the undershoot effect. The fact that the effects of rise duration on magnitude and slope are significant even after normalising away part of that effect gives us confidence that the effects are real, but it is clear that ultimately the only way to disentangle the effects of pitch range and undershoot is to model them jointly. This is undertaken in §4.5.
The studies by Xu (Reference Xu1998) and Chen & Gussenhoven (Reference Chen and Gussenhoven2008) appear to describe somewhat different patterns with respect to rise magnitude and slope, but the data they report are not directly comparable in crucial respects, including differences in the tonal contexts of the rising tones. For example, Chen & Gussenhoven find that rise magnitude increases with increasing emphasis, and thus with increasing duration, as observed here, but slope is higher in emphasised words compared to non-emphatic words, whereas we find that slope decreases steadily with increased duration. However Chen & Gussenhoven's data co-vary duration and prominence – increased duration is elicited via an increase in emphasis – and increased prominence on a rising tone is expected to be implemented by increases in targets for the magnitude and slope of the rise, as discussed in §4.5. Increasing these targets can override the tendency for slope to decrease with increasing duration.
3.3 Summary of the results
In summary, none of the properties of the rising tone are independent of speech rate. As speech rate increases, L shifts earlier relative to its anchor, H shifts later relative to its anchor, the magnitude of the rise decreases, and the slope of the rise increases. We thus have no evidence for a division between specified and unspecified properties of the rising tone, because such a division would lead us to expect some subset of the tonal properties to remain stable under variation in speech rate, while the rest adjust to accommodate the invariant targets. In §4 we develop an analysis of the observed patterns of variation according to which the rising tone has specified targets for all of the properties studied here: L, H, M and S. It is not possible to realise targets for all four properties simultaneously, so the realisation of the rising tone involves a compromise between the four targets. The nature of this compromise depends on segment duration, giving rise to rate-dependent variation in all four tone properties. This analysis is explained in more detail in the §4.1, and is provided with a quantitative formulation in §4.2.
4 Analysis
4.1 Outline of the analysis
The variation in the realisation of the rising tone can be derived by positing that the rising tone has targets for all of the properties under consideration, as in (5).
-
(5)

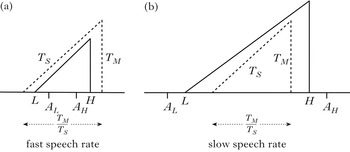
These targets conflict, so it is not possible to realise them all. The nature of the conflict is illustrated in Fig. 12. A rise that meets the targets for magnitude and slope must have a fixed duration of TM/TS, since the slope is defined to be the magnitude of the rise divided by its duration, so satisfying these two targets would imply that the duration of the rise is invariant across speech rates and syllable structures. But the duration between the segmental alignment targets for L and H, AL and AH, depends on segmental durations, and thus varies with speech rate: the alignment targets are closer together at faster speech rates and further apart at slower speech rates. Fig. 12 shows two speech rates, fast and slow, with the segmental alignment targets closer together in the fast speech condition. The dashed triangles indicate the shape of an F0 rise that satisfies the targets for M and S, i.e. it has a rise magnitude of TM and a slope of TS, and thus a duration of TM/TS. If the duration of the syllable and interval is such that the segmental alignment targets AL and AH are exactly TM/TS ms apart, then all of the targets can be realised, but if AL and AH are closer together (Fig. 12a) or further apart (b), then satisfying the magnitude and slope targets implies failing to align one or both tones with their alignment targets.
Schematic illustration of the conflict between realising the magnitude, slope and alignment targets for a rising tone in (a) fast speech and (b) slow speech. The dashed lines show the shape of the rise that satisfies the targets for rise magnitude and slope, while the solid lines schematise the actual slope and magnitude of the rise appropriate for the illustrated intervals between the alignments targets, A L and A H .

The observed pattern of tone realisation as a function of speech rate follows if this conflict between the targets is resolved by compromise – that is, there is some deviation from each target, rather than three of the targets being perfectly realised at the cost of large deviations from the remaining target. At faster speech rates, the duration between AL and AH is shorter than TM/TS (Fig. 12a), so L precedes AL and H follows AH, bringing the rise duration closer to TM/TS. However, it still falls short, so the rise is smaller than its target magnitude, TM, although the slope is steeper than its target, TS. Conversely, in slower speech, the duration between AL and AH is longer than TM/TS (Fig. 12b), so L follows AL and H precedes AH, keeping the rise duration closer to TM/TS. The rise is still too long, so the rise reaches a greater magnitude than its target, TM, although its slope is a little shallower than its target, TS. These are the qualitative patterns of variation in the rising tone as a function of segmental duration that we observed in the results above.
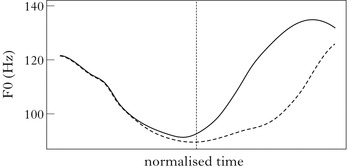
It is plausible that there should be targets for all of these properties, because they all serve to distinguish tonal and intonational contrasts in Mandarin. Pitch levels and pitch slope are basic dimensions of tone perception in general (Gandour Reference Gandour and Liem1979, Reference Gandour1984) and in Mandarin in particular (Massaro et al. Reference Massaro, Cohen and Tseng1985).Footnote 9 Alignment of pitch events such as L and H also serves to distinguish Mandarin tones (e.g. Blicher et al. Reference Blicher, Diehl and Cohen1990, Moore & Jongman Reference Moore and Jongman1997, Shen et al. Reference Shen, Lin and Yan1993). Figure 13 illustrates this point for the contrast between the high and rising tones (tones 1 and 2) following a low tone (tone 3), based on Xu (Reference Xu1997: Fig. 6). Following a low tone, it is necessary to produce a rising F0 movement to reach the target for the level high tone, so in this context both high and rising tones are realised by rising F0 contours. As observed by Chen & Gussenhoven (Reference Chen and Gussenhoven2008: 743), the two tones differ substantially in the timing of the rise: in the high tone the rise begins near the onset of the syllable, but it begins nearer the middle of the syllable for the rising tone (as in the results reported above; cf. also Li Reference Li2003: 64f). At the other end of the rising trajectories, the F0 peak for the high tone precedes the syllable offset, whereas it follows the syllable offset for the rising tone (also observed above). The multiplicity of targets for the rising tone can thus be understood to reflect the multiplicity of cues to phonological contrasts: the rising tone is distinguished from other tones by cues on a variety of dimensions, and deviation from target values along any of those dimensions could reduce the distinctiveness of contrasts, and should thus be minimised.
F0 trajectories of low-high (solid line) and low-rising (dashed line) tone sequences produced on /mama/ segmental sequences by Mandarin speakers, based on Xu (1997: Fig. 6). The vertical line marks the offset of the first vowel.

4.2 A constraint-based formalisation of the analysis
So far, the analysis of rate-dependent variation in the realisation of the rising tone has been developed informally. In this section, we see that the proposal that the realisation of the rising tone is a compromise between violable targets for segmental anchoring of the onset and offset of the rise and for slope and magnitude of the rise can be made quantitatively precise. The analysis depends on compromise between conflicting constraints, a concept that is central to the model of phonetic realisation proposed by Flemming (Reference Flemming2001), according to which phonetic grammars consist of weighted constraints and phonetic realisations are selected so as to minimally violate these constraints (cf. Kochanski & Shih Reference Kochanski and Shih2003). Here we formalise the analysis of the Mandarin rising tone in these terms, showing that it accounts for the qualitative patterns described above, and provides a reasonable quantitative fit to the data as well. The results provide evidence for the utility of this constraint-based approach to modelling phonetic realisation.
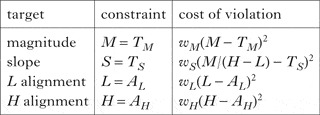
The four targets for the rising tone are enforced by the constraints listed in Table III. As discussed above, it is generally not possible to satisfy all of these constraints simultaneously, so the realisation of the rising tone, given particular segmental durations, is selected to minimise violation of the constraints. The notion of minimal violation is defined by associating a cost of violation with each constraint. This cost is equal to the square of the deviation from the target, and the total cost of a candidate set of values for the timing of L and H and the rise magnitude is the weighted sum of its constraint violations, where the weights wM, wS, wL, wH are positive numbers, as shown in (6). The realisation of the rising tone is then selected so as to minimise this total cost.
-
(6)

Constraints and costs of violations.

Thus the parameters of the model are the target values and the constraint weights, and the outputs are values of M, L and H. Note that the constraints specify targets for M and S, and the timing of L and H, but these quantities cannot be varied independently, since the slope is by definition equal to the magnitude of the rise divided by its duration, H − L. Here we select values of M, L and H, and calculate S as M/(H − L), as shown in the formulation of the cost function for the slope constraint in Table III. In addition, the alignment targets, AL and AH, are not directly specified as parameters of the model, but are specified as proportions of the syllable and interval respectively.
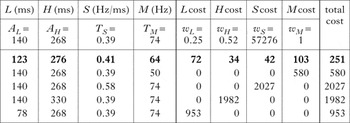
The cost function in (6) is a convex function of M, L and H, so it has a single minimum, and solutions to the minimisation problem can be found through gradient descent or other standard optimisation algorithms.Footnote 10 Table IV shows an example of the evaluation of realisations of a rising tone, given sample values of AL and AH together with the values of TS, TM and constraint weights estimated in the next section. The first four columns present candidate values for L, H, S and M, with target values for these properties given in the second row. The next four columns show the weighted cost of violation of each constraint for each candidate tone realisation, with the constraint weights in the second row. The final column shows the total cost incurred by each candidate.
Example of evaluation of realisations of a rising tone. The minimum-cost realisation is in bold. Realisation values are rounded to the same number of decimal places as the corresponding targets, and costs are rounded to the nearest integer.

Cost is minimised by a compromise between the conflicting constraints – that is, the optimal realisation (the first candidate in Table IV) involves modest violations of all of the constraints. The remaining candidate realisations show that modest deviations from each target result in a lower total cost than a large deviation from one target together with perfect realisation of the rest.
The optimality of compromise between conflicting constraints is a general consequence of minimising the summed violations of constraints that penalise squared deviations from targets. The cost of violating a constraint grows rapidly as the magnitude of the deviation increases, so multiple small deviations from targets incur a lower cost than a single large deviation.
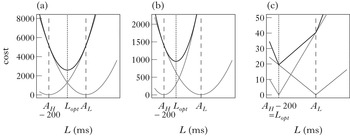
This is easiest to see by considering a conflict between two constraints. For example we can isolate the conflict between L alignment and H alignment by assuming a fixed rise duration. If the rise duration is greater than the interval between AL and AH, then placing L closer to AL implies that H occurs later relative to AH, and, conversely, the closer H is to AH, the earlier L must occur relative to AL. This situation is illustrated in Fig. 14a, which shows cost as a function of L timing. L alignment requires L to be aligned to AL, while H alignment requires H to be aligned to AH. If the fixed rise duration is 200 ms, this second constraint implies that AL should be aligned 200 ms before AH. The cost of violating each constraint is proportional to the square of the deviation from the relevant target, plotted with grey curves. The sum of these costs is plotted with a black curve. The optimal alignment of L, minimising the summed cost, is a compromise between the two requirements (plotted as Lopt in Fig. 14). If the weights of L alignment and H alignment are equal, the optimum falls halfway between AH − 200 and AL, as illustrated in Fig. 14a. If the weight of H alignment is higher, then the optimum shifts closer to the target implied by that constraint, AH − 200, as shown in Fig. 14b, but the optimum falls between the two targets for all values of the constraint weights. That is, compromise is always optimal.
Plots of cost as a function of timing of L. Grey curves show the cost assigned by the constraints L alignment and H alignment, while black curves show the sum of these constraint violations. The dashed vertical lines indicate the targets set by the alignment constraints, A L and A H -200 ms, and the dotted vertical line marks the minimum-cost value of L, labelled L opt . In (a) and (b), cost is proportional to squared deviation, with equal constraint weights in (a) and higher weight on H alignment in (b). In (c), cost is proportional to absolute deviation, with higher weight on H alignment.

Not all cost functions derive compromise between conflicting constraints. For example, compromise would not follow if the cost of violating a constraint were equal to the absolute deviation from the target. As illustrated in Fig. 14c, it is optimal to realise L at the higher-weighted target, AH − 200 in this example, with no compromise between the conflicting constraints.Footnote 11
4.3 Fitting the weighted-constraint model to the experimental data
Having formalised the analysis outlined in §4.1, we want to verify that the model can account for the qualitative patterns of variation in the realisation of the rising tone observed in our experiment, and assess how well it fits the data quantitatively. In order to make these assessments, we need to estimate values for the parameters of the model. The model-fitting procedure is described in this section, and the results are presented and assessed in §4.4 and §4.5. We then discuss extensions to the model (§4.6), before concluding.
4.3.1 Parameter estimation
Fitting the tone model to the experimental data involves estimating values for the targets TS, TM, AL and AH and the constraint weights wM, wS, wL and wH. For the alignment targets, AL and AH, this involves re-estimating the location of the segmental anchors for L and H, in the context of a model where they are not the only factors determining tone timing, so the relevant parameters are the proportions of the syllable/interval where the segmental anchor is located. Not all of the constraint weights need to be estimated, because the minimum-cost realisation depends only on the relative weights of the constraints – i.e. it is the ratios of the constraint weights that matter, not their absolute values – so one weight can be fixed at an arbitrary value, with the other weights set relative to it. We set wM = 1.
Estimating the model parameters is fairly complex, because the model derives multiple variables (M, L, H), and each model parameter affects the predictions for all three variables, so the fit of the model has to be assessed with respect to all three variables simultaneously. In addition, there is no closed form solution to the problem of minimising the cost function in (6), so the predictions of the model given a set of parameter values have to be assessed through numerical optimisation (cf. Flemming Reference Flemming2001 for a comparable optimisation model that does have a closed form solution). The method we adopted was to employ a combination of optimisation algorithms to find the parameter values that maximise the probability of the data given the model (Maximum Likelihood Estimation), a standard basis for estimating model parameters in statistics (e.g. Myung Reference Myung2003). In outline, the model fitting procedure is as follows: given a set of model parameters, the predictions of the model were determined for each data point in turn by calculating AL and AH based on the observed segment durations and the current values of the alignment target parameters, then finding the values of L, H and M (and thus S) that minimise the cost function in (6) by numerical optimisation, as described in the previous section.
Given assumptions about the probability of deviations from the model predictions, we can then use these predicted values to calculate the probability of the observed data given the model. If we change the parameters of the model, the fitted values change, and consequently so does the probability of the data. We used optimisation algorithms to search for the parameter values that maximise the probability of the data.Footnote 12
4.3.2 Modelling pitch range
A final point to consider before fitting the model is how to account for variation in pitch range. As discussed in §3.2, there is evidence in our data for variation in pitch range both within and between speakers, so a complete model of tonal realisation must include pitch range as a factor. In particular, we need to model the range of F0's (pitch span) used, because this affects the target for rise magnitude, TM. We saw in §3.2 that pitch range can differ between repetitions of the materials as well as between subjects, so we should estimate a pitch-span parameter for each recording, for each speaker. However we do not have enough data to obtain stable estimates of twelve pitch-span parameters at the same time as estimating the other model parameters, so the strategy we adopt is to start by fitting the tone model on the assumption that all speakers employ the same pitch span, then estimate additional pitch-span parameters, while holding other model parameters constant.
Methodologically, it is desirable to attribute as much of the variation in rise magnitude as possible to the effects of observed rise duration, before resorting to unobserved pitch-range parameters. Empirically, it is reasonable to posit that all of the recordings except for subject 2's normal speech rate were produced in approximately the same pitch span. Note that this is a claim about pitch span only, not about overall pitch levels – the speakers do differ in overall pitch levels, as illustrated by the mean F0 measurements in Table II above. On the other hand, the F0 standard deviations reported in the same table, which are estimates of pitch span, are similar across speakers for the normal and slow speech rates, with the exception of subject 2's normal speech rate recording. There is more variation in standard deviations in the fast recordings, but it is plausible that this does not reflect variation in pitch span, but is instead due to variation in how fast individual subjects chose to speak, with concomitant variation in the extent of undershoot of tone targets.
Looking more specifically at the realisation of the rising tone, the relationship between rise magnitude and rise duration, plotted in Fig. 10a, is similar across speakers, again with the exception of subject 2 at normal rate. Where speakers use similar rise durations, they use similar ranges of rise magnitudes. A range of rise magnitudes is observed for a given rise duration, but this is a result of variation within, rather than between speakers.
Accordingly, we first fit a speaker-independent model (§4.4), excluding data from subject 2's normal rate recording, then expand this model to fit all of the data by adding pitch-span parameters (§4.5). Both model fits exclude an extreme outlier with a rise duration of 643 ms, as we were concerned that this point could have excessive influence on parameter estimates (the next highest rise duration is 429 ms).
4.4 Speaker-independent model
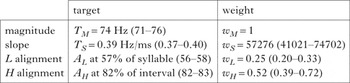
The maximum likelihood estimates of the speaker-independent model parameters are shown in Table V, together with profile likelihood 95% confidence intervals (Agresti Reference Agresti2002: 78). Note that the confidence intervals for the constraint weights, wL and wH, are effectively confidence intervals for the ratios of these constraint weights divided by wM, so the latter parameter has no confidence interval.
Parameter values of the best-fitting model, with profile likelihood 95% confidence intervals in parentheses.

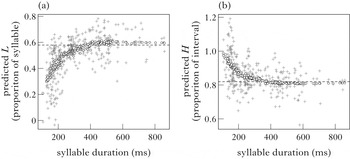
At this early stage of model development, it is most important to confirm that the proposed analysis of the realisation of rising tone captures the qualitative patterns observed in the results of the experiment, that is, to verify that the informal analysis proposed in §4.1 works as intended when explicitly formalised. The following plots and analyses demonstrate that this is the case. With respect to the timing of L and H, we observed that as segment durations decrease, L occurs progressively earlier than its anchor, whereas H occurs progressively later than its anchor. This pattern is captured by the proposed model, as illustrated in Fig. 15. Fig. 15a shows predicted L timing plotted as a proportion of syllable duration against syllable duration together with the actual values of L plotted as crosses, while Fig. 15b provides a similar plot of observed and predicted H timing as a proportion of interval duration (cf. Fig. 8 above).
Scatter plots of predicted L and H timing as a function of syllable duration (circles), over actual L and H timing (crosses). (a) L timing is plotted as a proportion of syllable duration and (b) H timing is plotted as a proportion of interval duration, with the timing of the segmental anchors indicated by dashed lines.

The estimates of the positions of AL and AH are barely changed from the positions estimated using the strict segmental anchoring models presented in §3.1, but the addition of the slope and magnitude constraints accounts for systematic deviations of the tones from their anchors as a function of segmental durations: at short durations, L occurs early and H occurs late, relative to their respective anchors, to avoid excessive deviations from the slope and magnitude targets. So we can now see that it is not necessary to adopt more complex definitions of the segmental anchors to account for the observed patterns of L and H timing – all that is required is to take into account the interaction between tonal timing and the realisation of targets for the slope and magnitude of the rise. The fact that L deviates from its anchor more than H follows from the lower weight on the L alignment constraint, compared to the H alignment constraint.
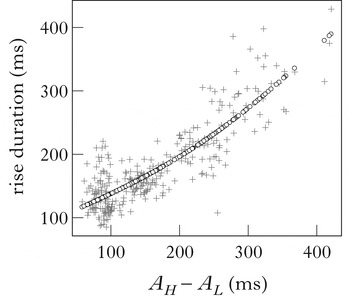
The fitted values in Fig. 15 do not lie on a smooth curve, because the model actually relates deviation of tones from their anchors to the duration between the alignment targets, and that duration depends on both syllable and interval durations, whereas the plots in Fig. 15 only depict syllable duration, in order to be comparable to the plots used to present the experimental results in Fig. 8. The predicted relationship between rise duration and the interval between AL and AH is shown in Fig. 16, together with the observed data.
Scatter plot of rise duration as a function of the interval between anchors, A H -A L (crosses) with values predicted by the model (circles).

The other patterns that we wish the model to derive are the decrease of rise magnitude and increase of slope as the duration of the rise decreases. The modelled relationship between M and rise duration, H − L, can be determined analytically by equating the partial derivative of the cost function with respect to M to 0, since the gradient of the cost function is 0 at its minimum (cf. Flemming Reference Flemming2001: 20ff). The result is shown in (7a), where D is the rise duration, H − L. The equation states that M is a weighted average of the target rise magnitude, TM, and the rise magnitude that would result from a rise with the target slope value, TS, and the observed rise duration, i.e. DTS. The relative weights depend on the respective constraint weights and the square of the rise duration. The relationship between S and rise duration can then be derived by dividing the equation for M by D, since S = M/D (7b). These curves are plotted over the actual data in Fig. 17, where it can be seen that they capture the observed pattern: predicted M rises rapidly at short rise durations, then levels out, while predicted S declines as rise duration increases. A target rise magnitude, TM, of 74 Hz is predicted to be achieved when rise duration is 190 ms, with undershoot at shorter durations and overshoot at longer durations. The converse pattern obtains for slope S. Note that the fitted values of M and S are not as good as these curves might suggest, because the accuracy of the fitted values depend on the accuracy with which rise duration is modelled (see Fig. 18).
-
(7)

Scatter plots of (a) rise magnitude and (b) slope as functions of rise duration, H-L. The curves show the relationships derived from the model.

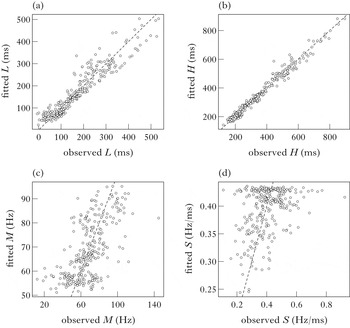
Scatter plots of fitted against observed values for (a) L, (b) H, (c) M, (d) S.

Although the model accounts for the key qualitative patterns observed in the experimental results, more detailed examination of the quantitative fit of the model to the data reveals areas in need of improvement. Model fit is summarised by the plots of observed against fitted values for L, H, M and S in Fig. 18.
Much of the variation in H is accounted for by the model (root mean square error (RMSE) is 23 ms), but L is modelled somewhat less accurately (RMSE: 37 ms). Some of this difference can be attributed to greater errors in the measurement of L, given that identifying the onset of the rise is much harder than identifying the F0 maximum associated with H (as discussed in §2.3), but the model also systematically overestimates the lowest values of L. That is, for observed values of L lower than 50 ms, the fitted values are always higher than the observed values, and examination suggests that measurement error alone cannot account for this systematic discrepancy. The most promising account of these data is that there is variation in model parameters between, and perhaps within, speakers. For example, the fit to the L data can be significantly improved by allowing speaker-specific AL alignment targets (ranging from 50% to 68% of syllable duration), while holding other parameters constant. However, more data from each speaker would be required to estimate these additional parameters with any confidence.
Rise magnitude and slope are less accurately modelled (RMSE: 15 Hz and 0.1 Hz/ms respectively). A likely source of error here is that the model assumes a fixed value of TM, when in actuality there is some variation between speakers, and probably between utterances, due to variation in pitch range and prominence, as discussed in the next section. The fitted values of S are derived from the fitted values for L, H and M, and thus show the effects of the combined errors in modelling M and H − L. The errors appear particularly large at short durations, because S is calculated by dividing M by H − L, so equal errors in M translate into larger errors in S when divided by smaller values of H − L.
4.5 Modelling variation in pitch range and prominence
The model developed so far neglects variation in pitch range. In this section we model pitch-range variation, allowing for variation in pitch span between speakers and between individual recordings of the materials by a single speaker. This allows us to model all of the data, including subject 2's normal speech rate recording.
As discussed above, we adopt a standard model of pitch range (e.g. Pierrehumbert & Beckman Reference Pierrehumbert and Beckman1988: 175ff, Kochanski et al. Reference Kochanski, Shih and Jing2003: 630), according to which speakers set pitch range by selecting an overall level and a pitch span, the difference between the top and bottom of the pitch range. Pitch targets are then specified in terms of proportions of the current pitch range. Since the rise-magnitude target, TM, specifies a difference in pitch levels, it can simply be scaled by the pitch span, so a TM of 0.5 translates into a target rise of 50 Hz if the difference between the top and bottom of the pitch range is 100 Hz, but will yield a target magnitude of 90 Hz if the span of the pitch range is 180 Hz. So varying pitch span is equivalent to varying the value of TM in Hz.
We hypothesise that slope targets are also scaled according to the current pitch span – the target is specified in terms of fractions of pitch span per unit time, so the slope target in Hz/ms is doubled if the pitch span is doubled. (This approach yielded better fits to the data than scaling TM only.) Accordingly, we can model pitch span in terms of a scaling factor which is multiplied by pitch-range independent TM and TS targets to derive targets in the current pitch range. So a pitch-span factor of 1 yields TM = 74 Hz and TS = 0.39 Hz/ms, as in the previous section, while a pitch-span factor of 1.3 increases these targets to 96 Hz and 0.5 Hz/ms respectively. This scaling factor takes on one value for each speech-rate recording for each speaker – twelve values in all. The best-fitting values for these pitch-span factors were determined by maximum likelihood estimation, fixing the other model parameters at the values estimated in the previous section. The only data point excluded was the outlier with rise duration of 643 ms. The pitch-span parameter estimates are shown in Table VI. Each is based on at most 27 data points, so these estimates are uncertain, but most are close to 1. Notable exceptions are the parameters for subject 2, who, as observed in §3.2, appears to have used a smaller than average pitch span at fast and slow rates, and a much larger than average span at normal rate.
Estimated pitch-span factors for each recording by each subject.

Adding these pitch-span parameters to the model reduces RMSE in fitted magnitude values to 13.5 Hz, compared to 15 Hz for the smaller dataset analysed in the previous section. However, it is clear that variation in pitch range is not the limiting factor in predicting rise magnitude – the problem is that there is significant variation in rise magnitude for similar rise durations, even for individual speakers (Fig. 10a above). This suggests that rise magnitude is conditioned by additional factors not yet included in the model. One candidate for such a factor is the prominence of individual syllables.
TM is expected to depend on the prominence of the syllable with which the tone is associated. For example, a tone on a focused word has greater prominence than a tone on a non-focused word, and is thus associated with more extreme pitch targets. In Pierrehumbert & Beckman's model, the level assigned to a tone within the current pitch range depends on prominence – increasing prominence raises H and may lower L, which implies an increase in TM. So, for example, a focused tone might have a TM equal to 0.8 of the current pitch range, and a post-focal tone a TM of 0.5. Given the same pitch range, the first target translates into a larger value for TM in Hz than the second.
We see some evidence for variation in the relative prominence of the syllable bearing the target rising tone in our experimental data from comparison of the height of the H peak of the target rising tone with the F0 peak associated with the rising tone on the syllable [nǐn] in the preceding carrier phrase. The peak of the target rising tone is generally a little lower than the preceding F0 peak, but it can be substantially higher or lower, even for a single speaker. This plausibly represents variation in the relative prominence of these two tones, although this variation appears unpredictable, since the structure of all of the sentences is the same.
To summarise this section so far: we have formalised an analysis according to which the realisation of the rising tone is a compromise between targets for alignment of the onset and offset of the rise, and for the magnitude and slope of the rise. By fitting the model to the experimental data, we have demonstrated that the analysis accounts for the qualitative patterns of variation in tone realisation as a function of segment duration, and also provides a reasonable quantitative fit to the data, but modelling of magnitude and slope appears to be limited by uncontrolled variation in the prominence of the target syllables.
In the remainder of this section we briefly consider directions in which the tone model requires development.
4.6 Effects of tonal context
The model of rising tone realisation developed here focuses on the effects of segment duration on tone realisation, and is thus not intended to be exhaustive. However, we hypothesise that the constraints identified here are generally applicable, so other effects on the realisation of the rising tone should be analysable by adding constraints to the current model. In this section, we briefly consider an addition to the model that is required to account for effects of tonal context on tone realisation, i.e. tonal coarticulation. Coarticulation effects are central to understanding some differences between our results and the results of Chen & Gussenhoven's (Reference Chen and Gussenhoven2008) study of the effects of duration on the realisation of the rising tone.
Kochanski et al. (Reference Kochanski, Shih and Jing2003) present an analysis of coarticulatory effects in Mandarin in a model based on optimal satisfaction of conflicting constraints, conceptually similar to the one proposed here. They derive coarticulatory effects from the interaction of constraints enforcing tonal targets with a constraint favouring minimisation of articulatory effort. Effort is quantified in terms of velocity and acceleration, summed over the F0 trajectory (2003: 630), so effort minimisation favours smoother, flatter trajectories. Kochanski et al.’s model and the one developed here are complementary in the sense that their model cannot account for the systematic variation in timing of L and H analysed here, while our model currently does not account for tonal coarticulation, but, given the structural similarities between the models, it is in principle straightforward to combine the relevant constraints to account for both kinds of data.
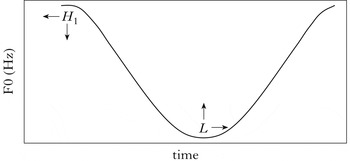
An effort constraint penalising rapid F0 transitions creates conflicts between constraints on the realisation of targets of adjacent tones, particularly where those targets differ substantially in F0 level. For example, in our data the rising tones are preceded by low tones, so only modest transitions are necessary between the two, but with a preceding high tone we have a H1.LH2 sequence with a high target at the end of the first syllable and a low target aligned near the middle of the second, so hitting the targets for H1 and L would incur a high effort cost when syllable durations are short. The falling transition can be made shallower, reducing effort cost, by starting the fall early, lowering H1, aligning L later than its alignment target or undershooting L, realising it above its pitch target (Fig. 19).
Schematic F0 contour for a high-rising tone sequence. Arrows indicate adjustments to H 1 and L that would reduce the slope of the initial falling transition.

Undershoot of L due to a preceding high tone is observed in Chen & Gussenhoven's data: when rising tones are produced in the unemphasised condition (i.e. with the shortest durations), the magnitude of the final rise is reduced if the tone is preceded by a high tone, compared to the context following a low tone (2008: 734f). Averaged pitch tracks indicate that this is primarily due to undershoot of the L target of the rising tone (2008: 733). This undershoot effect is also exhibited to a greater or lesser extent by all of the speakers reported in Xu (Reference Xu1998: Fig. 2).
Realising L later in the syllable is not a viable solution, because that would incur an offsetting cost by making the final rise too small and/or too steep. In fact, the present study shows that, where the rising tone is preceded by a low tone, L is realised earlier in the syllable at short syllable durations, allowing more time for an adequate realisation of the final rise. However we do find an effect of preceding context on timing of L, in that Chen & Gussenhoven (Reference Chen and Gussenhoven2008: 737f) find that this tendency to retract L at short syllable durations is blocked when the preceding tone is high, presumably to avoid making the transition from the high tone too steep.
Chen & Gussenhoven find no evidence of adjustments to the preceding high tone in response to time pressure (2008: 739f). This is in line with the general observation that in Mandarin there is less deviation from tone targets at the end of syllables than from targets earlier in the syllable (Xu Reference Xu1997), an effect that would follow from higher weights on the constraints enforcing targets later in the syllable (Flemming Reference Flemming, Embarki and Dodane2011).
Note that the pattern of L undershoot following a high tone bears on a question that has been left open so far: are there independent targets for the F0 levels of the onset and offset of the rise, L and H, or is there a direct target for the magnitude of the rise? A direct target for rise magnitude would imply that H should be realised at a certain height above the onset of the rise, so if L is realised higher due to undershoot then we would expect a higher H peak as well. In fact, Chen & Gussenhoven observe a smaller rise when there is undershoot of L. This reduction in rise magnitude follows if the target F0 level for H is independent of the actual level at which L is realised and thus is not raised in compensation for L undershoot.
5 Conclusions
In this study we have explored the nature of the phonetic targets for the Mandarin rising tone by examining the realisation of this tone across a range of syllable durations. The rationale behind this approach is that tonal properties that have specified targets should not vary with syllable duration, whereas properties that are not governed by target specifications should vary to accommodate the realisation of specified targets. However, we found that all of the properties under examination varied systematically as a function of segmental duration: as syllable durations shorten, the onset of the rise occurs earlier in the syllable and the offset occurs later, the magnitude of the rise decreases and the slope of the rise increases.
We have seen that these patterns of variation can be derived from an analysis according to which the rising tone has targets for all of these properties. These targets cannot all be realised, since they conflict, and the conflict is resolved by compromise between the targets. That is, modest deviations from each target are preferred over a large deviation from a single target. This analysis was formalised in a framework where targets are enforced by violable, weighted constraints and phonetic realisations are selected so as to minimise the summed violations of the constraints. The resulting model derives the qualitative patterns of tone realisation observed in the experimental data, and also provides a reasonable quantitative fit to the data.
These results carry implications for theories of tonal implementation in particular, and for theories of phonetic realisation in general. With regard to tonal implementation, the results show that contour tones can have targets that pertain both to the endpoints of a pitch movement and to properties of the transition between those endpoints, such as the slope of the transition. A model of tonal realisation based purely on point targets and general interpolation mechanisms is therefore inadequate. The more general implication is that tones (and presumably segments) can be overspecified, in the sense of having mutually incompatible targets. This implies that phonetic realisation incorporates means for resolving conflicts between targets – we have adopted a mechanism based on minimising the summed violations of weighted constraints. This approach to phonetic realisation is motivated by Flemming (Reference Flemming2001), based primarily on analyses of coarticulatory phenomena. The present case is interestingly different, in that the constraint conflict is inherent to the targets of a single tone, whereas coarticulation involves conflict between the demands of targets for neighbouring segments or tones and an effort-minimisation constraint on the transition between targets (cf. §4.6). We close by briefly considering likely sources of inherent conflict between targets, and thus where additional examples of overspecification might be found.
We have hypothesised that the range of targets for the Mandarin rising tone reflects the fact that there are multiple cues that distinguish tones from each other or mark prosodic distinctions, such as prominence, through tone realisation. That is, there are constraints enforcing targets corresponding to each cue. If this hypothesis is correct, then we should expect most tones and segments to have multiple targets, because contrasts are normally realised by multiple cues. However these targets need not be incompatible. For example, preceding vowel duration and voice onset time are both cues to voicing in stops, but there is no inherent incompatibility in realising any particular combination of values of these two properties. The targets of the rising tone conflict because they involve properties of a single entity, a rising F0 movement, which are related by definition – e.g. slope is by definition equal to rise magnitude divided by rise duration. Diphthongs could constitute a comparable case of overspecification, because they involve formant movements whose salient characteristics include onset and offset frequencies, slope and duration. The canonical F2 trajectory in the English diphthongs /ai aʊ ɔi/ is comparable to the F0 trajectory of the rising tone, consisting of an initial F2 plateau, followed by a rise (/ai ɔi/) or fall (/aʊ/) to the offset of the vowel. There is also evidence for comparable effects of speech rate on the realisation of these F2 trajectories: as speech rate increases, the onset of the F2 movement occurs proportionately earlier in the vowel (Gay Reference Gay1968, Weismer & Berry Reference Weismer and Berry2003), and for many speakers the magnitude of the F2 movement tends to decrease, while its peak velocity increases (Dolan & Mimori Reference Dolan and Mimori1986, Weismer & Berry Reference Weismer and Berry2003). (Gay Reference Gay1968 observes a decrease in the magnitude of the rise but no effect on its velocity.) These patterns are consistent with targets for the duration, magnitude and slope of the F2 rise, all of which are plausible cues to the quality of the diphthong (e.g. Bond Reference Bond1978, Nábělek et al. Reference Nábělek, Czyzewski and Crowley1994, Morrison & Nearey Reference Morrison and Nearey2007).
Another possible source of conflict between targets is physical incompatibility. For example, the maximum F2 that a speaker can produce decreases as F1 increases, so it is not possible to produce a vowel with F1 as in low [a] but F2 as in high front [i]. This is because a high F2 requires a narrow constriction in the palatal region, which necessarily results in a relatively low F1 (e.g. Fant Reference Fant1960: ch. 1.4). Consequently, simultaneous targets for high F1 and F2 would conflict.
Positing conflicting targets of this kind might provide the basis for an analysis of variation in the realisation of the ‘tense’ variant of the low front vowel /æ/ found in particular phonological (and lexical) contexts in a number of dialects of North American English (e.g. Labov et al. Reference Labov, Ash and Boberg2006: 173ff). In at least some Mid-Atlantic dialects, tense /æ/ varies between a raised monophthong, close to [ε], and a diphthong that could be transcribed as [eæ], in which F1 rises and F2 falls. This variation might be analysed as deriving from different compromises between incompatibly high F1 and F2 targets, perhaps depending on vowel duration. The monophthong realisation then represents a compromise in which a physically possible combination of F1 and F2 values is achieved by allowing both F1 and F2 to fall short of their high targets. Given sufficient duration, the conflict is instead resolved by sequencing the incompatible targets, first high F2, then high F1, resulting in a diphthong.
Both examples are speculative at this point, but serve to illustrate the potential for overspecification analyses. Further research is required to establish the generality of this phenomenon.