Given the prevalence, stability, and negative outcomes associated with children's aggressive behavior, finding effective interventions has been a top priority. Much progress has been made in identifying evidence-based treatments that decrease children's aggression (Dishion & Andrews, Reference Dishion and Andrews1995; Dishion, Bullock, & Granic, Reference Dishion, Bullock and Granic2002; Henggeler, Reference Henggeler1999; Henggeler, Schoenwald, Borduin, Rowland, & Chummingham, Reference Henggeler, Schoenwald, Borduin, Rowland and Cunningham1998; Kazdin, Reference Kazdin2002; Snyder & Ingram, Reference Snyder and Ingram2000) and several randomized clinical trials have shown the efficacy of various treatment modalities (for reviews, see Brestan & Eyberg, Reference Brestan and Eyberg1998; Kazdin, Reference Kazdin2001). Specifically, two of the most well-recognized, evidence-based interventions are parent management training (PMT) and cognitive behavioral therapy (CBT; Brestan & Eyeberg, Reference Brestan and Eyberg1998; Dumas, Reference Dumas1989; Kazdin, Reference Kazdin1997). Despite these promising efforts, the outcomes of these interventions still show enormous variability, and this variability is difficult to explain because we have little understanding of the psychosocial and biological mechanisms underlying clinically significant change (Kazdin, Reference Kazdin2001). To improve our knowledge of these mechanisms, several steps are needed. First, although many investigators link aggressive behavior problems with inadequate or inappropriate emotion regulation (e.g., Eisenberg et al., Reference Eisenberg, Cumberland, Spinrad, Fabes, Shepard and Reiser2001; Eisenberg, Ma, et al., Reference Eisenberg, Ma, Chang, Zhou, West and Aiken2007; Zhou et al., Reference Zhou, Hofer, Eisenberg, Reiser, Spinrad and Fabes2007), treatment effectiveness is still measured as change in overt behavior. To understand why some children learn to control their aggression following treatment, it will be important to study the impact of treatment on emotion regulation directly. Second, aggressive children referred for treatment often display internalizing (e.g., anxiety, depression) as well as externalizing problems. Epidemiological evidence shows that a significant proportion of aggressive youth exhibit clinically elevated levels of anxiety and/or depression (see Zoccolillo, Reference Zoccolillo1992, for review), and the majority of aggressive children present with serious co-occurring internalizing symptoms in community settings (Hinshaw, Reference Hinshaw2002; Kazdin, Reference Kazdin2002). Treatment effectiveness may be better understood when these internalizing problems are acknowledged and the regulatory difficulties underlying them are systematically studied. Third, there is increasing interest in the neurobiological mechanisms of emotion regulation in children with behavior problems. However, little or no research has examined neural measures of emotion regulation as a means for explaining the effectiveness of treatment for children's aggressive behavior problems. If treatment is to have a lasting impact, it may need to alter not only the psychology but also the biology of emotion regulation in children with behavior problems.
The research reported here begins by acknowledging that children referred for aggressive behavior problems often suffer with internalizing as well as externalizing symptoms. For this population of comorbid children, we sought to understand the changes in emotion regulation habits (underlying both externalizing and internalizing problems) that appeared to correspond with successful treatment. To examine these changes at a biological level, we tested children's neurocognitive responses to a negative emotion induction before and after treatment, using dense-array EEG, event-related potentials (ERPs), and cortical source analysis. Specifically, we looked for changes in these measures from pre- to posttreatment for children who improved clinically, compared with those who continued to behave aggressively and age-matched, nonclinical participants. Our intention was not to evaluate a particular treatment approach, but to utilize an evidence-based treatment already common at community mental health agencies. Nor was it our goal to achieve clinical improvement in all or most of our participants, even if that were possible. Rather, our objective was to determine which children improved with treatment, based on commonly used clinical and behavioral markers, and then to see what characterized these children's cortical response to a challenging, emotion-inducing task in comparison with those who did not improve as well as nonclinical age mates.
Because our sample, like most community samples, showed internalizing as well as externalizing problems, we were particularly interested in the neurobiology of cognitive overcontrol in response to negative cues (Eisenberg, Hofer, & Vaughn, Reference Eisenberg, Hofer, Vaughn and Gross2007). Overcontrol or overengagement describes the ruminative, stimulus-bound style of emotion regulation characteristic of anxious children, thought to be mediated by ventral prefrontal and/or amygdala activation in response to threatening cues (McClure et al., Reference McClure, Monk, Nelson, Parrish, Adler and Blair2007; Monk et al., Reference Monk, Nelson, McClure, Mogg, Bradley and Leibenluft2006; Perez-Edgar et al., Reference Perez-Edgar, Roberson-Nay, Hardin, Poeth, Guyer and Nelson2007; Thomas et al., Reference Thomas, Drevets, Dahl, Ryan, Birmaher and Eccard2001). We therefore hypothesized that excessive ventral prefrontal activation would be replaced by more normal patterns of self-regulation for comorbid (internalizing/externalizing) children who improved with treatment. Specifically, we predicted that, for children who improved with treatment, cortical activation underlying inhibitory ERPs would diminish in ventral regions of the prefrontal cortex (PFC) and correspondingly increase in dorsomedial regions in the vicinity of the anterior cingulate.
Emotion Regulation and Childhood Psychopathology
Clinically significant externalizing and internalizing problems can be understood as disorders of emotion regulation (e.g., Bradley, Reference Bradley2000; Calkins, Reference Calkins1994; Calkins, Howse, & Philippot, Reference Calkins, Howse, Philippot and Feldman2004). Children with these problems have failed to develop the capacity to appropriately modulate their feelings of anger and anxiety and the behaviors that flow from them. There has been a good deal of research with young children supporting the association between poor emotion regulation and aggressive outcomes. Young children who are less able to voluntarily shift their attention and inhibit their emotional impulses have higher levels of aggression (Rothbart, Ahadi, & Hershey, Reference Rothbart, Ahadi and Hershey1994). In contrast, children with good emotional control are able to shift attention away from anger-inducing cues and use nonhostile verbal methods (Eisenberg et al., Reference Eisenberg, Fabes, Nyman, Bernzweig and Pinuelas1994). Inhibitory control contributes to the development of conscience in young school-aged children (Kochanska, Murray, & Coy, Reference Kochanska, Murray and Coy1997), and children's emotion regulation fosters awareness of responsibility for their own actions and negative consequences for other people (Derryberry & Reed, Reference Derryberry and Reed1996). Eisenberg et al. (Reference Eisenberg, Fabes, Shepard, Murphy, Guthrie and Jones1997) found associations between good self-regulation and high-quality social functioning in conflict situations to be as strong in middle childhood as in the preschool period. All these findings indicate that the capacity for self-control is prerequisite for inhibiting angry impulses and engaging in prosocial behavior.
Pure externalizing behavior patterns are associated with poor inhibitory control, sometimes because of low physiological reactivity and/or reduced fear of consequences (see van Goozen, Fairchild, Shoek, & Harold, Reference Van Goozen, Fairchild, Snoek and Harold2007, for a review). However, children comorbid for externalizing and internalizing problems have more complex difficulties in emotion regulation. In particular, in addition to anger and aggression, these children often experience anxiety and depression, which have been linked to excessive or inappropriate cognitive activity in attempts to control negative emotions and their outcomes. Anxious or depressed children become overly focused on negative cues, find it difficult to stop thinking about them, or attempt to regulate them using rigid, overlearned strategies. Specifically, anxious children can amplify their fears by focusing on stress-inducing stimuli rather than recruiting a repertoire of coping strategies (Bradley, Reference Bradley2000; Pérez-Edgar & Fox, Reference Pérez-Edgar and Fox2003). Vigilance in relation to threatening cues prevents these children from flexibly allocating attention elsewhere (Kagan & Fox, Reference Kagan and Fox2006; Kagan, Reznick, Clarke, Snidman, & Garcia-Coll., Reference Kagan, Reznick, Clarke, Snidman and Garcia-Coll1984). According to Eisenberg and colleagues (Eisenberg, Hofer, et al., Reference Eisenberg, Hofer, Vaughn and Gross2007; Eisenberg & Morris, Reference Eisenberg and Morris2002; Murphy, Eisenberg, Fabes, Shepard, & Gathrie, Reference Murphy, Eisenberg, Fabes, Shepard and Guthrie1999), overcontrol and undercontrol are both maladaptive strategies of emotion regulation, and overcontrol is associated with the inability to disengage from the negative emotional content of situations. Thus, for children with both aggression and anxiety problems, angry impulses may be difficult to regulate because it is difficult to disengage from the threatening or shaming aspects of challenging situations. For these children, perhaps because they are less skilled at inhibitory control in general, social isolation, shame, and low self-esteem may lead to recurring aggressive behavior (Granic & Patterson, Reference Granic and Patterson2006).
Neurocognitive Mechanisms of Emotion Regulation
We use the term emotion regulation to refer to cognitive processes involved in response control, that is, the control of attention, thought, and action impulses, in the presence of emotional states. We assume a suite of executive functions (e.g., reappraisal, response inhibition, action monitoring, and effortful attention) that work together to provide cognitive control (Eisenberg, Hofer, et al., Reference Eisenberg, Hofer, Vaughn and Gross2007; Ochsner & Gross, Reference Ochsner, Gross and Gross2007). However, styles of emotion regulation vary enormously among same-aged children. Moreover, individual differences in emotion regulation become deeply entrenched, they reliably predict psychopathological outcomes, and they become increasingly resistant to intervention as children mature. For these reasons, most investigators assume that styles of emotion regulation are embedded in neurobiological differences. Behavioral research can only go so far in measuring these mechanisms, and even the definition of emotion regulation seems to require biological grounding (Cole, Martin, & Dennis, Reference Cole, Martin and Dennis2004; Thompson, Lewis, & Calkins, in press). That may be why developmental psychopathologists are becoming increasingly interested in the neurobiological substrates of these mechanisms (Pollak, Reference Pollak2005). Neural approaches use imaging techniques, lesion studies, and electrophysiological methods to specify cortical regions and activation profiles. Research with adults has made progress linking these control mechanisms with normal and abnormal emotional processes. However, developmental neuroscience is only beginning to tackle emotion and its regulation, despite wide agreement on the importance of this agenda (Dahl, Reference Dahl2001; Goldsmith & Davidson, Reference Goldsmith and Davidson2004; Lewis & Stieben, Reference Lewis and Stieben2004; Pollak, Reference Pollak2005; Posner & Rothbart, Reference Posner and Rothbart2000).
Neuroimaging and lesion studies have focused on prefrontal systems that mediate appraisal, inhibitory control, and self-monitoring. These systems are implicated in normal emotion regulation. The dorsal anterior cingulate cortex (ACC), on the medial wall of each frontal lobe, is a key structure for selecting among competing choices, making judgements, monitoring one's performance, and learning (Frith, Friston, Liddle, & Frackowiak, Reference Frith, Friston, Liddle and Frackowiak1991; van Veen & Carter, Reference van Veen and Carter2002, see Paus, Reference Paus2001, for a review). The ACC can also be involved in processing emotion, and it is specifically implicated when individuals are in control of their emotional responses or judgments (Lane et al., Reference Lane, Reiman, Axelrod, Yun, Holmes and Schwartz1998; Taylor, Phan, Decker, & Liberzon, Reference Taylor, Phan, Decker and Liberzon2003). The orbitofrontal cortex (OFC), on the ventral surface of the PFC, is responsible for assigning emotional significance, especially in social situations, and for maintaining a response set such as avoidance or inhibition in anticipation of emotional consequences (Blair, Morris, Frith, Perrett, & Dolan, Reference Blair, Morris, Frith, Perrett and Dolan1999; Rolls, Reference Rolls1999). Importantly, both children and adults show increased functional magnetic resonance imaging (fMRI) activation in both the ACC and OFC during response inhibition (e.g., Casey et al., Reference Casey, Trainor, Orendi, Schubert, Nystrom and Giedd1997). Hence, both structures may play a role in emotion regulation in children as well as adults (Lewis, Lamm, Segalowitz, Stieben, & Zelazo, Reference Lewis, Lamm, Segalowitz, Stieben and Zelazo2006).
In adults, externalizing and internalizing psychopathologies are linked with emotion dysregulation corresponding to anomalies in both these frontal systems. Aggressive individuals typically show deficits in both ACC and OFC activation (Davidson, Putnam, & Larson, Reference Davidson, Putnam and Larson2000), implying underregulation of behavior. Blair (Reference Blair2001) suggests that the OFC is especially important for the regulation of reactive aggression, and Hoptman (Reference Hoptman2003) found aggression to be associated with decreased metabolism in anterior, inferior, and medial frontal systems. Conversely, anxious and depressed individuals show greater than normal activation in ventral systems including the OFC and ventral ACC (Drevets & Raichle, Reference Drevets and Raichle1998; Mayberg et al., Reference Mayberg, Liotti, Brannan, McGinnis, Mahurin and Jerabek1999). In fact, dorsal and ventral prefrontal systems appear to compete for activation, with emotional demands deactivating dorsal systems and activating ventral systems in their place (Bush, Luu, & Posner, Reference Bush, Luu and Posner2000). This ventral dominance may be chronic in the case of anxiety disorders (Drevets & Raichle, Reference Drevets and Raichle1998), and ventral activation has been found to normalize (i.e., activation shifts dorsally) when treatment for depression is successful (Drevets, Reference Drevets2000; Mayberg et al., Reference Mayberg, Liotti, Brannan, McGinnis, Mahurin and Jerabek1999). The roles of these frontocortical systems in emotion regulation have not been as thoroughly investigated in children, especially with regard to aggressive disorders. However, two studies have now shown reduced dorsal ACC activation in aggressive children and adolescents (9–15 years), in response to negative stimuli, when compared with controls (Stadler et al., Reference Stadler, Sterzer, Schmeck, Krebs, Kleinschmidt and Poustka2007; Sterzer, Stadler, Krebs, Kleinschmidt, & Paustka, Reference Sterzer, Stadler, Krebs, Kleinschmidt and Poustka2005). Both dorsal and ventral prefrontal systems showed reduced activation when adolescents made risky decisions (Eshel, Nelson, Blair, Pine, & Ernst, Reference Eshel, Nelson, Blair, Pine and Ernst2007). With respect to anxiety, two recent studies showed greater right ventral PFC activation in children with anxiety disorders than controls when viewing negative facial expressions (McClure et al., Reference McClure, Monk, Nelson, Parrish, Adler and Blair2007; Monk et al., Reference Monk, Nelson, McClure, Mogg, Bradley and Leibenluft2006). In addition, several studies have found anxious or inhibited children 8 years old and older to show exaggerated amygdala responses to fear-eliciting situations (Perez-Edgar et al., Reference Perez-Edgar, Roberson-Nay, Hardin, Poeth, Guyer and Nelson2007; Thomas et al., Reference Thomas, Drevets, Dahl, Ryan, Birmaher and Eccard2001).
We have reviewed these findings in some detail to establish three key points. (a) Activation of dorsal versus ventral prefrontal systems is associated with unique cognitive styles: dorsal systems (e.g., dorsal ACC) appear to mediate the smooth, deliberate control of behavior, including emotional behavior, in a supervisory or top-down fashion, whereas ventral systems (e.g., ventral ACC and OFC) control impulses rigidly, in anticipation of negative consequences. In essence, ventral structures appear to monitor the expectation of further negative events, thus managing self-control defensively rather than opportunistically. (b) Over- or underactivation of these systems has been systematically linked with psychopathology both in adults and children. Underactivation of both dorsal and ventral prefrontal systems characterizes (pure) aggressive problems and overactivation of ventral systems characterizes anxiety problems. (c) Whereas behavioral neuroscience generally assumes that control functions are hard-wired in the brain, there is some evidence that the relative activation levels of prefrontal control systems can be altered with successful treatment. We aimed to examine children comorbid for internalizing and externalizing problems pre- and posttreatment, to the extent possible using EEG techniques and source modeling to assess neural changes associated with successful treatment.
EEG, Medial–Frontal Negativities, and Source Modeling
Of the various techniques available to neuroscientists, EEG methods are particularly appealing for clinical research because they are noninvasive, versatile, and relatively inexpensive. EEG or electrical brain wave activity is recorded at the scalp from an array of electrodes. ERPs are computed by averaging EEG data over many trials on a given task. Several ERP components recorded over prefrontal (or frontocentral) cortex are thought to index aspects of cognitive control, and these have been linked with the inhibition or regulation of emotional responses in several studies.
The frontal N2 is seen 200–400 ms poststimulus on trials requiring participants to withhold a prepotent response, and it is often assumed to tap inhibitory control mechanisms (it is sometimes dubbed the “inhibitory N2”). That the N2 is also a marker of emotion regulation is implied by its association with negative emotion in several studies with adults. For example, negatively valenced emotional evaluations of self and other predicted higher amplitude N2s (Tucker, Luu, Desmond, et al., Reference Tucker, Luu, Desmond, Hartry-Speiser, Davey and Flaisch2003), and an N2-like “medial–frontal negativity” was found to be enhanced by negative feedback concerning one's performance (Luu, Tucker, Derryberry, Reed, & Poulsen, Reference Luu, Tucker, Derryberry, Reed and Poulsen2003). In terms of psychopathology, Tucker, Luu, Frishkoff, Quiring, and Poulsen (2003) found medial–frontal amplitudes (specifically, the feedback-related negativity) to correlate with the intensity of depressive symptoms. Thus, greater amplitude medial–frontal negativities probably reflect the augmentation of inhibitory controls when negative emotions arise, and these controls may be recruited more when people are depressed. Other medial–frontal negativities, such as the error-related negativity (ERN), are also thought to tap action monitoring or response control (Falkenstein, Hoorman, & Hohnsbein, Reference Falkenstein, Hoormann and Hohnsbein1999; Gehring, Gross, Coles, & Meyer, Reference Gehring, Goss, Coles and Meyer1993), and higher amplitude ERNs have also been linked to anxiety and negative affect (Gehring, Himle, & Nisenson, Reference Gehring, Himle and Nisenson2000; Hajcak, McDonald, & Simons, Reference Hajcak, McDonald and Simons2004; Luu, Collins, & Tucker, Reference Luu, Collins and Tucker2000; Pailing, Segalowitz, Dywan, & Davies, Reference Pailing, Segalowitz, Dywan and Davies2002).
Researchers have also begun to examine the N2 and related components in children (Davies, Segalowitz, & Gavin, Reference Davies, Segalowitz and Gavin2004; Davis, Bruce, Snyder, & Nelson, Reference Davis, Bruce, Snyder and Nelson2003; Johnstone, Pleffer, Barry, Clarke, & Smith, Reference Johnstone, Pleffer, Barry, Clarke and Smith2005; Jonkman, Lansbergen, & Stauder, Reference Jonkman, Lansbergen and Stauder2003; Santesso, Segalowitz, & Schmidt, Reference Santesso, Segalowitz and Schmidt2005). These studies compare amplitudes and latencies between children and adults or test differences across different trial types (e.g., go vs. no-go trials). However, very few studies to date have utilized medial–frontal ERPs to examine children's emotional processes. Exceptions are Santesso et al. (Reference Santesso, Segalowitz and Schmidt2005), who report lower ERN amplitudes for undersocialized children, Ladouceur, Dahl, Birmaher, Axelson, and Ryan (Reference Ladouceur, Dahl, Birmaher, Axelson and Ryan2006), who report higher ERN amplitudes for anxious children, and Nelson and Nugent (Reference Nelson and Nugent1990), who found greater amplitude N2-like components to angry than happy faces in normal children. Four of our own studies have contributed to this line of investigation. In two of these, N2 amplitudes were greater to angry than happy faces in 4- to 6-year-olds (Lewis, Todd, & Honsberger, Reference Lewis, Todd and Honsberger2007; Todd, Lewis, Meusel, & Zelazo, Reference Todd, Lewis, Meusel and Zelazo2008). In the first of these, N2 latencies also correlated with fearful temperament (Lewis et al., Reference Lewis, Todd and Honsberger2007). In the second, an N2-like component was greatest to mothers' angry faces (Todd et al., Reference Todd, Lewis, Meusel and Zelazo2008). Two studies of older children employed the same task as the present research. In one of these, a negative mood induction (based on the loss of earned points) increased N2 amplitudes in normal children aged 13 to 16 years (Lewis, Lamm, et al., Reference Lewis, Lamm, Segalowitz, Stieben and Zelazo2006). In the other study, which investigated subtypes of aggressive children, comorbid (internalizing/externalizing) children showed greater N2s than pure externalizers in response to the same mood induction (Stieben et al., Reference Stieben, Lewis, Granic, Zelazo and Segalowitz2007). In sum, N2s (and related components) tapping cognitive control are larger in the presence of negative emotion, and more rapid for children with traitlike anxiety, suggesting a cortical locus of emotion regulation that varies in activation strength.
Dense-array EEG techniques (e.g., recording from 128 channels rather than just a few) allow researchers to model the cortical activity underlying ERPs using source analysis methods. We have made use of these techniques to test hypotheses about the approximate location of cortical activities that may underpin unique mechanisms of emotion regulation. Source analyses of medial–frontal ERPs (including the N2 and ERN) indicate a key generator in the region of the ACC for adults (e.g., Bekker, Kenemans, & Verbaten, Reference Bekker, Kenemans and Verbaten2005; Bokura, Yamaguchi, & Kobayashi, Reference Bokura, Yamaguchi and Kobayashi2001; Dehaene, Posner, & Tucker, Reference Dehaene, Posner and Tucker1994; Fallgatter, Mueller, & Strik, Reference Fallgatter, Mueller and Strik1999; Nieuwenhuis, Yeung, Van den Wilenberg, & Ridderinkhof, Reference Nieuwenhuis, Yeung, Van den Wildenberg and Ridderinkhof2003; van Veen & Carter, Reference van Veen and Carter2002) and children (Jonkman, Sniedt, & Kemner, Reference Jonkman, Sniedt and Kemner2007; Lewis et al., Reference Lewis, Lamm, Segalowitz, Stieben and Zelazo2006). Similarly, the region of the OFC has been identified as a probable source of the N2 in studies of adults and children (Bokura et al., Reference Bokura, Yamaguchi and Kobayashi2001; Lavric, Pizzagalli, & Forstmeier, Reference Lavric, Pizzagalli and Forstmeier2004; Pliszka, Liotti, & Waldorff, Reference Pliszka, Liotti and Woldorff2000). Recall that these are the very same prefrontal regions that have been implicated in supervisory versus stimulus-bound styles of emotion regulation. Source analysis of scalp EEG cannot provide definitive anatomical information, because more than one source solution can produce similar scalp topographies. Moreover, reliable anatomical hypotheses concerning children's neural activation patterns have only recently emerged in the literature. Nevertheless, findings from cortical source modeling, and their correspondence with fMRI data, suggest that ERPs tapping inhibitory control or action monitoring reflect activation of frontal regions targeted by imaging studies of emotion regulation. We therefore wished to utilize source modeling to examine the relative contributions of dorsal and ventral prefrontal systems to the cortical underpinnings of emotion regulation in children who either improve or do not improve with treatment.
Evidence-Based Treatments
Among the most effective treatments for aggressive children are family-based PMT with or without child-focused CBT (Brestan & Eyeberg, Reference Brestan and Eyberg1998; Dumas, Reference Dumas1989; Kazdin, Reference Kazdin1997). Both PMT and CBT focus on increasing children's capacity to regulate their distressing emotions and destructive behaviors. PMT for aggressive children grew, in part, from Patterson and colleagues' (Patterson, Reference Patterson1982; Patterson, Reid, & Dishion, Reference Patterson, Reid and Dishion1992) applied observational research and Forgatch's research on family problem-solving interactions (Forgatch, Reference Forgatch1984). PMT directly targets coercive family interactions and attempts to replace lax and aversive parenting practices with mild sanctions (e.g., time out) that contingently target misbehavior (Forehand, Reference Forehand1986, Reference Forehand1988). PMT also promotes positive parenting practices such as skill encouragement, problem solving, and monitoring (Forgatch & Degarmo, Reference Forgatch, DeGarmo, Cox and Brooks-Gunn1999; Martinez & Forgatch, Reference Martinez and Forgatch2001). Several randomized control studies have examined the impact of PMT on children's aggressive behavior (Forgatch & Degarmo, Reference Forgatch, DeGarmo, Cox and Brooks-Gunn1999; Martinez & Forgatch, Reference Martinez and Forgatch2001; Patterson, Chamberlain, & Reid, Reference Patterson, Chamberlain and Reid1982). Results confirmed that (a) on average, PMT decreases children's level of aggressive behavior and (b) reduced coercive parenting is one of the means by which children's behavior improves.
Combining PMT with child-focused CBT is another evidence-based strategy for improving children's problem behavior. Aggressive children often misunderstand social cues and they have difficulty regulating their resulting negative emotions (Dodge, Reference Dodge, Pepler and Rubin1991; Larson & Lochman, Reference Larson and Lochman2002). CBT targets aggressive behaviors and cognitions through techniques such as behavior management, role playing, modeling, problem solving, cognitive restructuring, social and token reinforcements, contingent consequences and generalization activities (Barkley, Reference Barkley2000; Bloomquist & Schnell, Reference Bloomquist and Schnell2002). Several studies have documented the effectiveness of combined PMT and CBT interventions for aggressive children (Brestan & Eyberg, Reference Brestan and Eyberg1998; Tremblay, Pagani-Kurtz, Masse, Vitaro, & Pihl, Reference Tremblay, Pagani-Kurtz, Masse, Vitaro and Pihl1995; Webster-Stratton & Hammond, Reference Webster-Stratton and Hammond1997). In studies that have compared treatment effects of CBT, PMT, and combined programs, combined CBT/PMT has been found to be most effective, at least with children from 5 to 12 years of age (Kazdin, Siegel, & Bass, Reference Kazdin, Siegel and Bass1992; Lochman & Wells, Reference Lochman and Wells2004; Webster-Stratton & Hammond, Reference Webster-Stratton and Hammond1997). In the current study, we partnered with community-based agencies who deliver CBT/PMT to examine neural correlates of clinical change.
Design and Hypotheses
The current study was designed to identify a frontal ERP (the inhibitory N2), and to assess differences in the activation strengths of two broad regions of PFC that generate it: the ventral PFC (including the ventral ACC) region and the dorsomedial region suggestive of dorsal ACC, before and after a community treatment program for children with behavior problems. We wished to determine any scalp differences, and especially differences in cortical activation, corresponding with successful versus nonsuccessful treatment, under the assumption that these differences tapped neurocognitive mechanisms of emotion regulation important for behavioral improvement. All participants completed 14 weeks of a combined PMT/CBT program. Before the start of the program and immediately afterward, children were brought to the EEG lab with their mothers where they took part in a go/no-go task integrated with an emotion induction procedure. However, because we were interested in measuring change through the administration of the same task twice, we needed to determine whether and to what extent practice effects produced a change in the neural response to the task. Therefore, a group of normal same-aged children went through the same two assessments, also 14 weeks apart. As opposed to a conventional “control group,” this “nonclinical group” was included in order to avoid overinterpreting practice effects as indicators of real behavioral change. Children earned points for successful task performance in the first block of trials (Block A), then lost all their points because of more rapid stimulus presentation during Block B, and then had a chance to regain their points when stimulus presentation slowed down again in the third block of trials (Block C). ERP and source data were analyzed for Block A (preemotion induction) and Block C (postemotion induction), to see whether brain activation differences thought to tap emotion regulation varied with the added challenge of induced negative emotion. For the clinical children, treatment effectiveness was assessed using parent- and clinician-reported standard instruments. Based on these measures, children were grouped into “improvers” (IMPs) and “nonimprovers” (NIMPs), and these groups were compared on each of the neural variables. Finally, standardized parent-, teacher-, and clinician-rated measures were used to determine the degree of internalizing and externalizing behavior problems characteristic of our sample, to help us interpret the neurocognitive differences we observed.
Given that our clinical participants were comorbid for internalizing and externalizing behavior problems, the following three hypotheses were tested:
1. Within sessions, the N2 amplitudes of both clinical and nonclinical children would increase following the emotion induction (Block B). However, we had no specific predictions as to changes in N2 amplitudes corresponding with treatment outcomes.
2. Clinical children would show greater activation of ventral regions of PFC than their nonclinical counterparts. Children who improved with treatment would show decreased activation of the ventral PFC compared with NIMPs, underlying decreased reliance on a rigid, stimulus-bound style of emotion regulation.
3. Clinical children would show less activation of dorsal midline frontal regions than nonclinical children. However, children who improved with treatment would show increased activation of dorsal regions compared to NIMPs, underlying increased utilization of a voluntary, supervisory style of emotion regulation.
Method
Participants
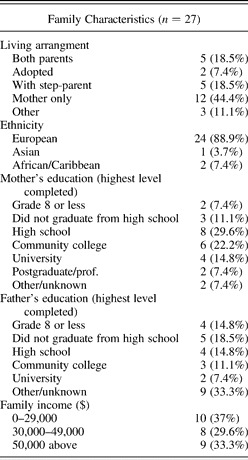
Forty-five children (40 boys), who were 8 to 12 years of age, were recruited from two outpatient treatment programs for aggressive children. Participants were referred to the program by mental health professionals, teachers, and/or parents. To be included in the study, referred children had to score within the clinical or borderline-clinical range on the externalizing subscale of either the parent- or teacher-report form of the Child Behavior Checklist (CBCL; Achenbach, Reference Achenbach1991a, Reference Achenbach1991b). In addition, 19 nonclinical children between the ages of 8 and 12 years were included as part of a larger community sample. These children were recruited through advertising in a citywide newspaper. Exclusion criteria for clinically referred children and their nonclinical age mates included significant developmental delay and residence outside the large urban center where the study was conducted. Eighteen clinically referred children and four nonclinical children were eliminated from all analyses because of insufficient ERP trial counts. The 18 excluded clinical children were compared to the sample of 27 included clinical children on demographic variables and CBCL scores. The t tests (on child's age and CBCL internalizing and externalizing scores) and chi-square analyses (of ethnicity, family structure, mother's highest level of education, father's highest level of education, and family income) revealed no significant differences with one exception: children included in the study scored significantly higher on pretreatment levels of externalizing scores than children excluded from the study, t (26) = 2.06, p = .05. Table 1 shows the demographics of our final sample of 27 clinically referred children.
Demographic data

Intervention
The treatment program was an evidence-based intervention for children between 8 and 12 years of age and their parents. The program is called Stop Now and Plan (SNAP; Earlscourt Child and Family Centre, 2001; Goldberg & Leggett, Reference Goldberg and Leggett1990), and it combines PMT and CBT. The clinical directors of the program have been consulting with the original developer of PMT (Marion Forgatch at the Oregon Social Learning Center) for over 10 years to ensure fidelity to the original PMT model. Therapists were social workers, childcare workers, or MA or PhD level clinical psychology students. Like most social welfare programs in Canada, families were not charged for treatment services. The program was delivered to both parents (PMT) and children (CBT) once a week for 14 weeks in a group format. The groups met for 3 hr during the evening at the community agencies. In the PMT groups, parents were taught to replace coercive or lax discipline strategies with mild sanctions (e.g., time out) that contingently target misbehavior (Forehand, Reference Forehand1986). The groups also promoted positive parenting practices such as skill encouragement (e.g., providing contingent praise for success, prompting for appropriate behavior), problem solving, and monitoring (Forgatch & Degarmo, Reference Forgatch, DeGarmo, Cox and Brooks-Gunn1999; Martinez & Forgatch, Reference Martinez and Forgatch2001). In the CBT groups, aggressive behaviors and negatively biased cognitions were targeted for change through well-documented strategies such as behavior management, role playing, problem solving, cognitive restructuring, social and token reinforcements, and generalization activities (Barkley, Reference Barkley2000; Bloomquist & Schnell, Reference Bloomquist and Schnell2002).
As previously reviewed, there are numerous randomized control trials that have established the efficacy of PMT and CBT. In addition, the SNAP program itself has undergone two evaluations to assess its effectiveness. A within-group design comparing baseline, discharge (3 months later), and 6- and 12-month follow-up data for 104 children admitted between 1985 and 1988 showed significant decreases in children's externalizing behavior (as measured by the CBCL; Achenbach, Reference Achenbach1991a). These treatment gains were maintained over the 6- and 12-month follow-up period (Hrynkiw-Augimeri, Pepler, & Goldberg, Reference Hrynkiw-Augimeri, Pepler and Goldberg1993). A recently completed randomized control trial (Augimeri, Farrington, Koegel, & Day, Reference Augimeri, Farrington, Koegl and Day2007) indicated that children randomly assigned to the treatment group, compared to an “attention” control group, showed decreases in externalizing scores; treatment gains were maintained over 6- and 12-month follow-up periods. For child- and parent-reported delinquency, effect sizes (d) exceeded 1.2.
Control for practice effects
As noted above, a group of nonclinical children between the ages of 8 and 12 years old was also assessed on two sessions, 14 weeks apart, a lag that was approximately the same as the lag between the pre- and posttreatment assessments carried out with clinically referred children. We do not refer to this group as a control group because they were not matched with the other children (except on a few global parameters such as approximate age and absence of mental illness) and they were not intended to ascertain the effect of treatment in any direct way. Rather, they were intended to ascertain the effect of the repeated administration of our task. If performing the task on repeated occasions increased the ease of performance, or in some other way decreased anxiety, discomfort, or other negative emotional states, then any change in cortical response may have reflected that difference rather than an effect of treatment. The inclusion of a nonclinical group allowed us to isolate such an effect, if it existed. Thus, the nonclinical children were included so as to avoid overinterpreting practice effects as an indication of meaningful behavioral change.
Procedure
Just prior to the beginning of treatment and then again after treatment, clinically referred children were accompanied to the laboratory by a parent. Nonclinical children were also tested twice with roughly 14 weeks between testing sessions. Following a brief introduction to the testing environment, electrode sensor nets, and recording system, parental consent and child assent were obtained. Parents were seated in an adjacent room and asked to complete the CBCL. Children were then informed that they could win a prize for playing the EEG computer game and were shown two toy bins. One of the bins contained small, undesirable toys such as small plastic cars, whereas the second bin contained a wide selection of more desirable, age-appropriate toys such as large action figures, stuffed animals, games, and $10.00 gift certificates from a local music store. The children were informed that, with successful performance (accumulation of points) in the game, they would be able to choose their desired prize, but that less successful performance would limit their choice to the less desirable toy bin. Children were then seated in front of a computer monitor with the distance and alignment to the monitor controlled by the use of a chin rest. The electrode sensor net was applied. Children were instructed to make responses during the game by clicking a button on the response pad with the index finger of their dominant hand (writing hand). They were given a practice block of 30 trials to ensure proficiency with the task.
Measures and tasks
CBCL
The CBCL (Achenbach, Reference Achenbach1991a) is a standardized, highly reliable, and valid measure of children's emotional and behavioral problems. At pre- and posttreatment, parents were asked to indicate whether, and to what degree, their child exhibited a list of symptoms. The instrument yields standardized T scores for numerous subscales. For this study, only the internalizing and externalizing problems subscales were used.
Teacher Report Form (TRF)
The TRF (Achenbach, Reference Achenbach1991b is a parallel measure to the CBCL but is completed by the child's teacher at pre- and posttreatment. It is also a standardized, highly reliable, and valid measure. It generates the same standardized T scores as the CBCL and again, only the internalizing and externalizing subscales were used for this study.
Child and Adolescent Functional Assessment Scale (CAFAS)
The CAFAS (Hodges & Wong, Reference Hodges and Wong1996) is completed by the clinician at pre- and posttreatment. Before clinicians can complete the CAFAS, they undergo a training period conducted by a CAFAS-certified trainer and are subsequently tested on a number of vignettes; they must achieve a prespecified level of reliability before they are CAFAS certified. The CAFAS measures the degree of disruption in the child's current functioning in eight psychosocial areas. To rate the child, the clinician collects information from multiple informants in different settings including the child's parents, teachers, and any other significant adults that know the child (e.g., grandparent, school counselor). Each of the eight subscales is rated and scored for level of severity: severe (30), moderate (20), mild (10), and minimal or none (0). For our purposes, we focused on four scales: school, home, community, and behavior toward others. The reliability and validity of the instrument have been well established (e.g., Hodges & Gust, Reference Hodges and Gust1995; Hodges & Wong, Reference Hodges and Wong1996). Critically, the CAFAS has been shown to be sensitive to clinical change over time (Hodges, Reference Hodges and Maruish1999; Hodges & Wong, Reference Hodges and Wong1996; Hodges, Wong, & Latessa, Reference Hodges, Wong and Latessa1998). A decrease of 20 points or more from pre- to posttreatment is considered clinically significant improvement (Hodges et al., Reference Hodges, Wong and Latessa1998; Hodges & Wong, Reference Hodges and Wong1996).
ERP task
The emotion induction go/no-go task that was used in the present study was partly adapted from a task developed by Garavan, Ross, and Stein (Reference Garavan, Ross and Stein1999), and was presented using E-Prime software (Psychological Software Tools, Pittsburgh, PA). In standard go/no-go paradigms, participants are required to press a button as fast as possible given a particular category of stimuli (the go condition) and withhold responding given another category of stimuli (the no-go condition). Participants in this study were instructed to click the button for each letter presented but to avoid clicking when a letter was repeated a second time in succession. Different pairs of similarly shaped letters were used for each block (Block A: x, y; Block B: o, p; Block C: u, d) to enhance novelty without modifying the level of difficulty and to facilitate guided recall during a self-report scale administered at the end. The no-go error rate for the task was maintained at 50 ± 10% by dynamically adjusting the stimulus duration and thus the intertrial interval. Stimulus duration was increased with each erroneous response made on no-go trials. Stimulus duration was decreased following correct no-go trials, but only when the no-go trial followed a correct go trial. This constraint was incorporated to prevent stimulus time adjustments because of chronic nonresponding. The dynamic adjustment of the stimulus time was intended to provide the same level of challenge for all participants at all ages, and to obtain a sufficient number of correct no-go trials for ERP averaging. Error feedback was provided by a red bar in the middle of the screen following incorrect responses, omitted responses, and late responses.
Children were presented with a practice block and three blocks of trials (Blocks A, B, and C). In Blocks A and C children gained points quite steadily. These blocks were structurally identical, each consisting of 200 trials, including 66 no-go trials, in pseudorandom sequence. In Block B, children immediately began to lose their points, because of a change in the point-adjustment algorithm. By the end of block B, children had lost all, or almost all, their points. The loss of points was intended to induce negative emotions, such as anxiety, sadness, and anger. To limit the duration of children's distress, Block B consisted of only 150 trials, including 40 no-go trials. With a return to the more generous algorithm in block C, children regained their points to win the desired prize. For each block, their accumulated points were displayed approximately every 20 trials in the center of the computer screen. Points were added for correct no-go responses and deducted for response errors on both go and no-go trials. Children were reminded at the beginning of the task, and the onset of each block, that a high number of points were required to win the “big prize.”
Self-report emotion-induction check
The emotion-induction scheme was assessed with a subjective rating scale administered directly after the go/no-go task. An 8.5 × 11 in. card with animated faces of five different emotions was presented to the children. The five emotions were upset, mad, nervous, satisfied, and excited. Children were asked to rate the intensity of each of these emotions on a 10-point Likert scale for each of the three blocks. Cards showing animated emotion faces of different intensities were used to help children identify the intensity of their emotions. Furthermore, to help children recall how they felt in each of the blocks, researchers indicated which letter combination was used for each block (e.g., x/y in Block A, o/p in Block B).
Analyses
EEG data collection and analysis
EEG was recorded using a 128-channel Geodesic Sensor Net and sampled at 250 Hz, using EGI software (Electrical Geodesic, Inc., Eugene, OR). Data acquisition was started after all impedances for all EEG channels were reduced to below 50 kΩ. All channels were referenced to Cz (channel 129) during recording and later rereferenced against an average reference (Bertrand, Perrin, & Pernier, Reference Bertrand, Perrin and Pernier1985; Tucker, Liotti, Potts, Russell, & Posner, Reference Tucker, Liotti, Potts, Russell and Posner1993). Eye blink and eye movement artifacts (70 µV threshold), signals exceeding 200 µV, and fast transits exceeding 100 µV were removed during the averaging process. Data were filtered using an FIR bandpass filter with a low-pass frequency of 30 Hz and a high-pass frequency of 1 Hz. Correct no-go data were segmented into epochs from 400 ms before to 1000 ms after stimulus onset and baseline corrected for the 400 ms preceding the stimulus. Correct no-go trials that did not have a correct go trial preceding and following them (or preceding or following them, in the case of consecutive no-go trials) were removed, because they most likely reflected attentional lapses or chronic nonresponding. The mean number of trials comprising correct no-go ERPs for the pretreatment session was 23.69 (range = 11–37 trials) and for the posttreatment session was 25.28 (range = 8–50 trials). To avoid the confounding effect of trial count on amplitude values, amplitude analyses were conducted with trial count as a covariate. The no-go N2 was scored as the largest negative deflection with a medial–frontocentral topography between 200 and 500 ms poststimulus. Scoring was performed by two independent coders and intercoder agreement was 90%. The N2 amplitudes for blocks A and C were analyzed. Block B ERPs were not analyzed because of insufficient trial counts.
Source-space analysis
Source modeling programs often fit hypothetical generators or “dipoles” in a model of the cortex and test for goodness of fit against the scalp data (e.g., BESA, MEGIS Software, GmbH). Other programs compute activation voxel by voxel, producing images that somewhat resemble fMRI images but again on the basis of scalp voltage patterns. In the current study we utilized the second of these approaches, partly in response to criticisms of dipole-based source modeling techniques. Specifically, we utilized an algorithm called LAURA (local autoregressive average), a constraint applied to the minimum-norm method that minimizes the discrepancy between values of adjacent voxels (to achieve the most realistic model). Although LAURA source modeling does not permit precise anatomical localization, its estimates of regions of activation are more reliable than those of dipole-fitting methods. This makes it ideal for testing global hypotheses, in this case concerning the relative weight of dorsal versus ventral sources of frontomedial activation.
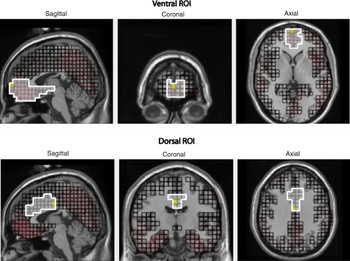
To estimate the cortical generators for the N2, LAURA constraints were applied to calculate the inverse solution within the GeoSource (EGI) interface (for a review of these constraints and other minimum norm solutions, see Michel et al., Reference Michel, Murray, Lantz, Gonzalez, Spinelli and Grave de Peralta2004). Before any group or block differences were assessed, the “fit” between the inverse solution and the scalp topography was evaluated. Morphology-based regions of interest (ROIs) were generated using the Montreal Neurological Institute average adult MRI. The ventral ROI, shown in Figure 1, approximates activation in the ventromedial PFC, OFC, and subgenual ACC. The dorsal ROI, also shown in Figure 1, approximates activation in the dorsal ACC. Each ROI was composed of a subset of dipoles (or voxels). Source waveform amplitudes (nA) for all dipoles within an ROI were baseline corrected (400 ms before stimulus onset). Because source waveforms do not have distinct components as found in scalp waveforms (e.g., N1, P2, N2, and P3), they were not individually visualized and hand coded. However, we still wanted to extract values that were most representative of the N2 and that did not include activation subserving other frontal components, such as a later negativity often found after the parietal P3. The latency range for the N2 was subdivided into 50-ms bins, and the three bins closest in time to the peak grand-averaged N2 were sufficient to exclude activation from other ERP components for nearly all children. Thus, we ended up with a 150-ms window (250–400 ms) from which the maximal activation value for each voxel was exported. Last, for each participant, and for each ROI, we selected the maximal value across all these voxels. In other words, each participant's data was reduced further to capture the maximal activation value within each ROI (for the 150-ms time window corresponding with the N2).
Morphology-based ROIs generated using the Montreal Neurological Institute average adult MRI scan. [A color version of this figure can be viewed online at journals.cambridge.org/dpp]

Results
Preliminary analyses
Outcome group classification of clinically aggressive children
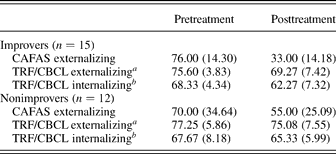
Children were classified as IMPs or NIMPs based on a combination of information from the CBCL and CAFAS. Clinically significant improvement was operationalized as a drop in score of at least 0.5 standard deviation (T score = ≥5) on the CBCL and a drop of 20 or more points on the CAFAS (Hodges et al., Reference Hodges, Wong and Latessa1998; Hodges & Wong, Reference Hodges and Wong1996). If the two measures were inconsistent (i.e., if one measure indicated clinical improvement and the other did not), then priority was given to the CAFAS, because it combined information from multiple informants, not just the parent. Based on these criteria, 15 children were classified as IMPs and 12 were classified as NIMPs. Means and standard deviations on the CAFAS and CBCL subscales are presented in Table 2.
Means and standard deviations for clinical measures
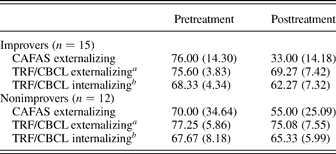
aBased on the maximum value for either the CBCL or TRF externalizing scales.
bBased on the maximum value for either the CBCL or TRF internalizing scales.
It is important to note that, consistent with epidemiological and clinical studies, our sample was clinically impaired in terms of internalizing problems as well as externalizing problems. The sample mean was above the clinical cutoff (T = 64) on internalizing (M = 68.13, SD = 7.22), and all but one participant had internalizing scores in the clinical or borderline clinical range (T ≥ 60). Almost the entire sample was thus comorbid for internalizing and externalizing symptoms.
Go/no-go behavioral data analyses
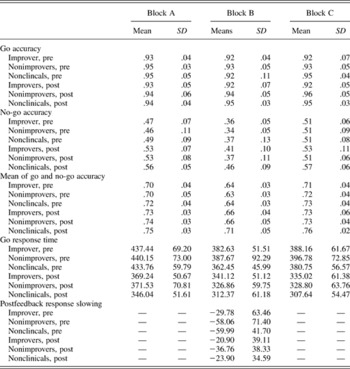
A 2 (Session) × 3 (Group) × 3 (Block) repeated-measures analysis of variance (ANOVA) was conducted for go response times and go/no-go performance accuracy. Furthermore, a 2 (Session) × 3 (Group) repeated-measures ANOVA was conducted on postfeedback slowing for the mood induction block only (the only block in which feedback was consistently negative). Age, gender, and medication were entered as covariates in all behavioral analyses. The response time measure was straightforward. However, because perseverative responding leads to high accuracy on go trials and low accuracy on no-go trials, whereas chronic nonresponding leads to high accuracy on no-go trials and low accuracy on go trials, each of these measures is misleading on its own. Therefore, to better reflect the overall quality of performance, we also report accuracy scores averaged across both trial types (see Table 3). Next, the postfeedback response slowing score consisted of the difference in response time between the average of three consecutive go trials before the appearance of a points feedback window and the average of three trials after the window. Negative values indicated response slowing, which is generally taken to mean that the individual is engaging in performance monitoring triggered by negative feedback. Means and standard deviations for response time, performance accuracy, and postfeedback slowing are displayed in Table 3.
Means and standard deviations for behavioral data

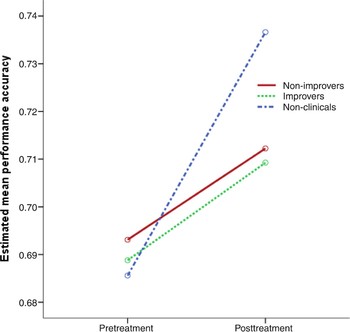
Following adjustments for covariates, performance accuracy results revealed a main effect for session, F (1, 35) = 11.36, p = .002, with greater accuracy observed in the posttreatment session (p < .001). This pattern of results may be because of increased familiarity with the task at posttreatment. Furthermore, a Group × Session interaction was found, F (2, 35) = 3.74, p = .03. Planned contrasts revealed greater accuracy for normal children than IMPs in posttreatment only (p = .05). No other significant or trend-level effects were found (ps = .14–.83). Thus, as shown in Figure 2, IMPs and NIMPs did not differ in performance accuracy. Furthermore, both the go response time and postfeedback slowing results showed no differences for group or session.
Group differences in performance accuracy before and after treatment. [A color version of this figure can be viewed online at journals.cambridge.org/dpp]

Emotion-scale analyses
Emotion-scale data were only collected for the clinically referred children. A 2 (Session) × 2 (Group) × 3 (Block) × 3 (Negative Emotion) repeated-measures ANOVA revealed no differences among the three negative emotions (i.e., no main or interaction effects). Thus, we averaged the three negative-emotion scales to form a global measure of experienced negative affect. We then conducted a 2 (Session) × 2 (Group) × 3 (Block) repeated-measures ANOVA. Because no significant differences were observed for this analysis, we reran the ANOVA without group as a factor, to increase power. In addition, because we were only concerned with block and session differences, age, gender, and medication were removed from the analysis as covariates, further increasing power. This time, results revealed a substantial quadratic main effect of block, F (1, 24) = 45.24, p < .001, and a Block × Session interaction, F (1, 24) = 12.28, p = .002. Planned contrasts, for both sessions, revealed that the emotion induction block (Block B), was perceived as significantly more negative than both Block A and Block C (p < .001). Contrasts also indicated that Block A was perceived as more negative in pretreatment than in posttreatment (p = .008). Thus, a negative mood induction in Block B was confirmed by children's self-report. However, we have no evidence for a continuation of this negative mood into Block C. We infer that, after the task was completed and the game had been “won,” which is when the self-report scale was administered, participants appraised Block C as more positive. Nevertheless, children's emotional state during Block C was probably more negative (compared to Block A), partly because this period immediately followed the loss of all points in Block B, and partly because of anecdotal descriptions by the examiners of tension, anxiety, moodiness, and vigilance indicated by children's behavior (e.g., posture, utterances) during Block C.
ERP analyses
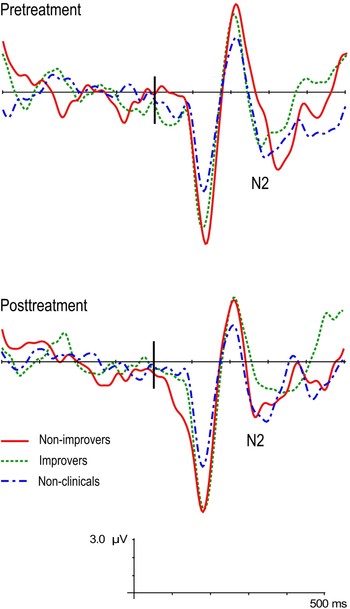
All analyses of N2 amplitudes were conducted on correct no-go stimulus-locked waveforms. These waveforms, shown in Figure 3, reveal N1, P2, and N2 components that are distinct and well formed at both pre- and posttreatment for all groups. However, grand-average waveforms can be visually deceptive and give the appearance of group differences that are not actually present. Statistical analyses were performed on values averaged across electrodes Fz and FCz, where grand-averaged ERPs revealed maximal scalp activation. Age, gender, trial count, and medication were included as covariates in all analyses, because each of these variables can affect ERP amplitudes. A 2 (Session) × 2 (Block) × 3 (Group) repeated-measures ANOVA revealed no significant or trend-level main effects or interactions (F = .009–1.38, ns). Thus, the N2 amplitudes of clinically referred children did not differ from each other as a function of treatment success, nor did they differ from those of nonreferred children.
Grand-averaged ERP waveforms at site FCz for IMPs, NIMPs, and nonclinical participants at pretreatment and posttreatment sessions. [A color version of this figure can be viewed online at journals.cambridge.org/dpp]

No hypotheses had been specified concerning changes in N2 amplitudes, partly because ERP amplitudes can be influenced by contrasting factors such as efficiency and vigilance, and partly because ERP amplitudes are compilations of the activities of several cortical generators. Our hypotheses were specific to generators that may well have had counteracting effects on N2 amplitudes. Thus, differences in cortical source waves (e.g., those emanating from ventral versus dorsal prefrontal regions) could cancel each other out by the time they got to the scalp! Nevertheless, the N2 is thought to index high-level executive processes such as those involved in self-regulation or inhibitory self-control. Therefore, it made sense to use the N2 as a temporal marker for a presumed cognitive event and to compare ROI activation values at that time point, despite the absence of group or session differences in N2 amplitudes.
Source-space analyses
Similar to ERP analyses, all analyses of source-space activity were conducted on correct no-go stimulus-locked source waveforms. However, as outlined in the Method section, source waveforms do not have distinct components (e.g., N1, P2, N2, and P3) to guide individualized coding. Therefore, we shrunk the latency range for the source waveforms to the 150-ms window surrounding the average N2 latency for the sample as a whole, thus minimizing the possibility of the (automatic) extraction of a value that was unrelated to the N2. As described earlier, activation levels were estimated for two ROIs: a dorsomedial and ventromedial region.
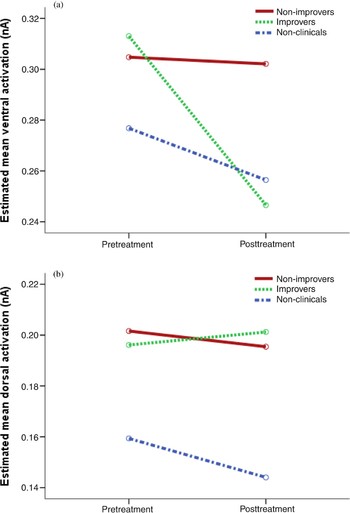
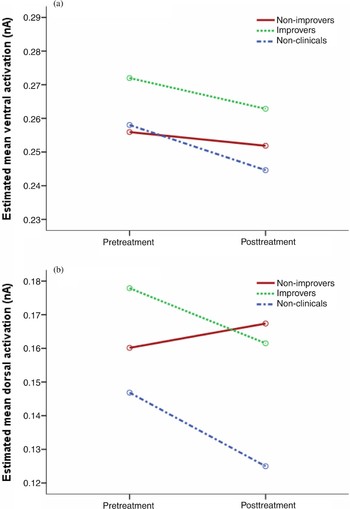
We then ran a 3 (Group: IMPs, NIMPs, and normals) × 2 (Session: pre vs. post) × 2 (Region: ventral vs. dorsal) × 2 (Block A vs. C) repeated-measures ANOVA as an omnibus test of differences. As with ERP analyses, all source-space analyses had gender, age, medication, and trial counts covaried out. Results revealed a main effect of region, F (1, 31) = 5.86, p = .02, with the ventral region showing higher activation than the dorsal region, and a main effect of block, F (1, 31) = 4.93, p = .03, with the postinduction block (C) showing greater activation than the preinduction block (A). Moreover, as shown in Figure 4, a Session × Region × Group interaction was found, F (2, 31) = 4.58, p = .02. Planned contrasts, collapsing across blocks, revealed a substantial decrease in ventral activation from pretreatment to posttreatment for the IMPs (p = .008), but no change for NIMPs (p = .93) or nonclinical children (p = .45), as hypothesized (see Figure 4a). There was also less ventral activation for IMPs than NIMPs at posttreatment only (p = .04). Thus, as predicted, children whose behavior improved with treatment showed less ventral activation, compared with their own previous levels and compared with children who did not improve. In addition, as shown in Figure 4B, the IMPs and NIMPs had very similar levels of activation in the dorsal ROI, and no change from pretreatment to posttreatment (ps = .15–.85 in planned contrasts). Moreover, as highlighted in the figure and confirmed by contrasts, dorsal activation was lower for the nonclinical children than for IMPs at a borderline-significance level (p = .06). Thus, contrary to our hypotheses, IMPs showed no increase in their dorsomedial activation compared to NIMPs, nor did they come to resemble their nonclinical age mates. In fact, again contrary to our predictions, dorsomedial activation was consistently lower, not higher, for nonclinical children.
Group differences in (a) ventral and (b) dorsal activity pre- and posttreatment for a latency range of 250–400 ms. This time range represents a narrowed window surrounding the average N2 peak for the sample. [A color version of this figure can be viewed online at journals.cambridge.org/dpp]

Supplementary source-space analyses
Regulation versus emotion: Testing for general cortical arousal
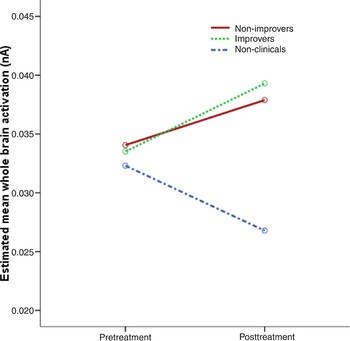
The decrease in ventral activation with treatment for the IMPs, outlined above, could be associated with a number of processes. It may be that, at posttreatment compared to pretreatment, IMPs simply had less cortical arousal, reflecting reduced emotional arousal, or children who improved with treatment may have relied less on ventrally mediated regulatory activities, as hypothesized. It was important to try to resolve this ambiguity. The fact that IMPs did not show a drop in dorsal activation at posttreatment argued against a general decrease in cortical arousal. However, to further test this possibility, we exported the average cortical activation value for the entire brain and then computed each child's maximal activation for the same time range used in the source-space analysis (250–400 ms poststimulus). We conducted a 3 (Group) × 2 (Session) × 2 (Block) repeated-measures ANOVA that revealed a Session × Group interaction, at the level of a trend, F (2, 31) = 3.19, p = .06. Contrasts, corrected for multiple comparisons, revealed an increase in cortical activation from pretreatment to posttreatment at a borderline level of significance (p = .05). The values for each group are shown in Figure 5. Thus, our principal finding of a pre- to postdecrease in ventral activation (for IMPs) cannot be explained by a general decrease in cortical arousal and a corresponding drop in emotional reactivity.
Group differences in whole brain activation before and after treatment for a latency range of 250–400 ms. [A color version of this figure can be viewed online at journals.cambridge.org/dpp]

Regulation versus emotion: Testing for the temporal specificity of activation change
The N2, occurring at roughly 200–400 ms, has been linked with various regulatory functions, such as inhibitory control. The treatment-related decrease in ventral activation for the IMPs may have been specific to this time window (and its corresponding functions) or it could have extended more broadly across the ERP waveform. The former, more specific timing of the decrease would support the argument for a change in regulatory activities, whereas the latter, more extended period of decreased activation would support the argument for a more general change in cortical activation, possibly reflecting emotional arousal. To select between these possibilities, we tested a second 150-ms time window, separated from the N2 window by 100 ms lag to minimize potential overlap with activation subserving the N2. A window from 500 to 650 ms was tested. We conducted a 3 (Group) × 2 (Session) × 2 (Region) × 2 (Block) repeated-measures ANOVA that revealed no significant or trend-level results. In addition, even contrasts uncorrected for multiple comparisons did not reveal a treatment-related decrease in ventral activation for the IMPs during this second time window (p = .70). As shown in Figure 6a, the slope of the line plotting IMPs' values from pretreatment to posttreatment is almost flat (as is the case for the other groups as well). These results indicate that the pre- to postdecrease in ventral activation for the IMPs was unique to the time period of the N2. Thus, the change in ventral activation corresponding with treatment success appears specific to a time period characterized by inhibitory control processes.
Group differences in (a) ventral and (b) dorsal activity pre- and posttreatment for a latency range of 500–650 ms. This time range represents a window that is not associated with the N2. [A color version of this figure can be viewed online at journals.cambridge.org/dpp]

Discussion
This study set out to determine whether cortical activities thought to underlie emotion regulation changed as a function of successful treatment, for children with serious behavior problems. Because our sample of clinically referred children was characterized by comorbidity, with high scores on both externalizing and internalizing scales, their difficulties in emotion regulation were thought to involve both overcontrol and undercontrol. Overcontrol includes excessive attention to threat, overengagement, and/or rumination, a regulatory style thought to be mediated by activation in ventral prefrontal systems. However, undercontrol includes a failure to inhibit aggressive impulses, a regulatory style associated with underactivation of both dorsal and ventral prefrontal regions but especially linked with dorsal ACC. Thus, we expected the clinically referred children in our sample to show overactivation of ventral prefrontal systems, consistent with their internalizing dynamics, and underactivation of dorsal systems, consistent with their externalizing problems. Based on this reasoning, we hypothesized that successful treatment outcomes would correspond with a regularization of both cortical systems: a decrease in the activation of the ventral PFC and an increase in the activation of the dorsomedial PFC. These brain changes should allow children to disengage more easily from fixation on negative events while asserting more voluntary control over their behavioral choices.
The results supported our hypotheses concerning ventral but not dorsal cortical regions. Children who improved showed a decrease in ventral PFC activation with treatment, demonstrating less ventral activation at posttreatment than children who did not improve. Although these results are preliminary and require replication, they constitute the first record of brain changes corresponding with the successful treatment of children's behavior problems.
We argue that ventral prefrontal activation underlies a particular mechanism of emotion regulation for children with behavior problems, and we suggest that the drop in ventral activation shown by our IMPs mediated a shift in their emotion regulatory habits. There are several lines of evidence to support this contention. First, using an admittedly coarse measurement protocol, only the ventral PFC appeared to show reduced activation at posttreatment. Other regions of the PFC, and a global measure of cortical activation, showed either no change or else increased activation from pre- to posttreatment. The ventral PFC is indeed one of the cortical regions most consistently associated with emotion. The ventral PFC is thought to be a center for emotion processing, recruited to appraise the impact of a stimulus on one's well-being (e.g., Barbas, Reference Barbas2000; Ressler & Mayberg, Reference Ressler and Mayberg2007; Rolls, Reference Rolls1999; Schmitz & Johnson, Reference Schmitz and Johnson2006). More specifically, anxiety, depression, and inhibited temperament have been associated with greater levels of activity in the ventral PFC, both in adolescents and in adults (Bush et al., Reference Bush, Luu and Posner2000; Drevets et al., Reference Drevets, Videen, Price, Preskorn, Carmichael and Raichle1992, Reference Drevets, Price, Simpson, Todd, Reich and Vannier1997; Hasler et al., Reference Hasler, Fromm, Alvarez, Luckenbaugh, Drevets and Grillon2007; Monk et al., Reference Monk, Nelson, McClure, Mogg, Bradley and Leibenluft2006; Steele, Currie, Laurie, & Reid, Reference Steele, Currie, Lawrie and Reid2007). Second, studies of depressed or anxious adults have shown decreased or normalized ventral activation resulting from successful treatment (Drevets & Raichle, Reference Drevets and Raichle1998; Fu et al., Reference Fu, Williams, Cleare, Brammer, Walsh and Kim2004; Mayberg et al., Reference Mayberg, Liotti, Brannan, McGinnis, Mahurin and Jerabek1999; for review, see Ressler & Mayberg, Reference Ressler and Mayberg2007). According to Drevets (Reference Drevets2000), this normalization may indicate that ventral PFC is able to “relax” following successful intervention. Moreover, this change probably corresponds with reduced activity in the amygdala, to which the ventral PFC is positively coupled in internalizing individuals (Heinz et al., Reference Heinz, Braus, Smolka, Wrase, Puls and Hermann2005, McClure et al., Reference McClure, Monk, Nelson, Parrish, Adler and Blair2007; Schmitz & Johnson, Reference Schmitz and Johnson2006; for review, see Phillips, Drevets, Rauch, & Lane, Reference Phillips, Drevets, Rauch and Lane2003).
Third, our IMPs showed reduced ventral activation only in the time window of the N2, a component that is understood to tap self-regulatory functions such as response inhibition or inhibitory control. A link between the N2 and ventral PFC has turned up in a number of studies. For example, the orbitofrontal region has been identified as a likely generator of the N2 in studies of adults and children (Bokura et al., Reference Bokura, Yamaguchi and Kobayashi2001; Lavric et al., Reference Lavric, Pizzagalli and Forstmeier2004; Pliszka et al., Reference Pliszka, Liotti and Woldorff2000), even though the dorsal ACC is associated with the N2 as frequently or more frequently. In our own previous work, we have used a version of the present paradigm and another paradigm utilizing negative emotion faces to induce negative emotions in children. In these studies, children of different ages showed enhanced N2 amplitudes corresponding with negative emotion blocks or trials (e.g., Lewis, Granic, & Lamm, Reference Lewis, Granic and Lamm2006; Lewis et al., Reference Lewis, Todd and Honsberger2007; Stieben et al., Reference Stieben, Lewis, Granic, Zelazo and Segalowitz2007). A robust dipole in the right OFC area was the primary generator of the N2 in some of this research (e.g., Lewis, Granic, et al., Reference Lewis, Granic and Lamm2006; Lewis, Lamm, et al., Reference Lewis, Lamm, Segalowitz, Stieben and Zelazo2006). Thus, a body of interrelated findings points to a convergence among the N2, ventral prefrontal activity, and the regulation of negative emotion.
A recent meta-analysis found that normal individuals only recruit ventral prefrontal regions in “emotional” tasks, but depressed subjects recruit ventral regions in tasks of all kinds: “cognitive” tasks as well as tasks involving negative emotions (Steele et al., Reference Steele, Currie, Lawrie and Reid2007). In other words, they are less discriminating and they overgeneralize expectations and interpretations focused on threat, rejection, or unpleasantness. A similar interpretation has been used to explain the threat-focused attentional bias of anxious and inhibited adolescents (Perez-Edgar at al., Reference Perez-Edgar, Roberson-Nay, Hardin, Poeth, Guyer and Nelson2007). Like these populations, our clinical participants may have interpreted the task, the loss of points, and the social situation in which they were embedded as threatening, despite cues to the contrary. This may be the bias they bring to social situations in general, initiating defensive reactions, counterthreats, withdrawal, and/or aggression. Emotion regulation mechanisms based on ventral prefrontal activities would be expected to maintain these threat-focused expectations, resulting in a defensive, rigid style of thinking about and responding to all kinds of social circumstances. The children in our sample whose behavior improved with treatment may have been able to “relax” this ventral predisposition, to paraphrase Drevets (Reference Drevets2000), thereby reducing ventral activation in the time range of the N2 and showing greater flexibility and openness in social situations. Those who did not improve, for whatever reason, may have remained stuck in their ventral style of emotion regulation, making it difficult to process social cues without defensiveness.
Indeed, the purpose of therapeutic intervention for these children was to foster greater flexibility in their appraisals of the emotional meaning of events, greater flexibility in their response to those events, and greater capacity to view events as neutral or potentially positive rather than challenging or threatening. The CBT portion of treatment included specific strategies for reappraising social situations and for delaying responses until those reappraisals took hold. The PMT portion of treatment was intended to reduce hostile interactions between children and their parents, so that everyday situations would not be as emotionally loaded, threatening, and doomed to failure. The reduction in ventral activation we observed in our IMPs may constitute the beginnings of a shift in cortical habits of emotion regulation in response to the thrust of these treatment goals. If this interpretation is borne out by future studies, it would imply that prefrontal regulatory mechanisms can be rapidly retrained when the social world is shown to be less threatening and more supportive.
However, a second prefrontal mechanism of emotion regulation, centered in dorsomedial systems for voluntary control, was also expected to change with successful treatment. Increases in dorsal ACC activity were expected to allow children to flexibly monitor their behavior and inhibit aggressive acts. This prediction was not borne out. In fact, nonclinical children showed marginally lower levels of dorsomedial activation than clinical children, and clinical children maintained relatively high dorsal activation whether or not they improved. Because our nonclinical group did not constitute a matched control group, we do not want to make too much of these findings, but Figure 4 reveals remarkably little differentiation between the profiles of IMPs and NIMPs. Perhaps clinical children, whether showing behavioral improvement or not, still needed to recruit dorsal ACC regulatory systems as much as possible, to maximize self-regulation in the face of a challenging task. Another interesting speculation is that anxiety-related mechanisms may be primary, not secondary, for children with comorbid symptomatology. There has been much debate as to whether anxiety stems from the consequences of aggressive behavior or whether aggressive behavior counters the isolation and anguish that accompany anxiety in comorbid children. Our findings may suggest that behavior improves as soon as attention shifts away from threat. Once their ventrally mediated threat bias starts to change, children may find it easier to stay out of trouble by choosing to avoid particular situations.
Limitations of this research include a relatively small sample size; to increase confidence in our interpretations of the data, replication with a larger sample will be needed. A second limitation is that changes in neural activation were assessed at about the same time as measures of behavioral improvement, making it impossible to determine whether neural changes were causal antecedents of behavior change. To overcome this limitation, it will be necessary to carry out research with multiple time points, so that neural changes assessed at one time can be associated with later behavioral changes. We are gathering 1-year follow-up data on the children who participated in this research in hopes of addressing this issue. Next, the use of children comorbid for externalizing and internalizing symptoms prevented us from isolating neural mechanisms specific to each. However, this choice constituted a strength as well as a weakness. We studied a community sample representing real-world behavior problems. Therefore, the results of our research can be generalized more easily to a clinically relevant population. Another limitation was the absence of a proper wait-list control group. We decided that it was most important to control for the practice effects of our task, so we utilized a group of nonclinical children to confirm that practice effects were not responsible for the observed changes in ventral prefrontal activation. Contrasting IMPs and NIMPs provided a within-group control, but we still cannot rule out some fundamental difference between these children that influenced their response to the task. Finally, we did not use a randomized control design because we were primarily interested in individual differences in treatment outcomes rather than treatment efficacy more broadly. Nevertheless, without the benefit of random assignment, we cannot be absolutely sure that the changes we observed were a result of treatment. It would be possible to integrate random assignment with neural and behavioral measures across several time points in a larger study.
Despite these limitations, we managed to bring children with serious behavior problems into a neural assessment environment for multiple testing sessions, expose them to a task designed to elicit anxiety and frustration, and derive sufficient artifact-free data to conduct statistically meaningful comparisons. These comparisons suggest partial support for a model of prefrontally mediated emotion regulation processes, whereby different cortical systems play unique roles in the regulation of negative emotions underlying children's behavior problems. In conclusion, we have compiled a preliminary data set linking treatment success with a reduction in ventral prefrontal activation at the time of an inhibitory control function indexed by the frontal N2. We see this neural change as a shift in the cortical underpinnings of emotion regulation habits that have maintained patterns of social interaction that are unrewarding and ultimately destructive. Our interpretation of these findings is provisional at present, but we see this as the first of many steps toward understanding the biological correlates of effective treatment for children with behavioral difficulties.