Introduction
Bryozoan material was collected by Charles Darwin from Hobart, Tasmania (van Diemens Land), during the voyage of HMS Beagle and later described by William Lonsdale as an appendix to Darwin (Reference Darwin1844). Several new species were described, including the trepostome Stenopora tasmaniensis Lonsdale, Reference Lonsdale and Darwin1844, and the genus erected with an informal description in footnotes. The genus was later given a full formal description by Lonsdale (Reference Lonsdale and Strzelecki1845) in an appendix to Strzelecki (Reference Strzelecki1845).
Darwin's type material for Stenopora tasmaniensis (and S. ovata Lonsdale, Reference Lonsdale and Darwin1844) was noted by Nicholson and Etheridge (Reference Nicholson and Etheridge1879) as lost before 1879. Although Darwin's S. tasmaniensis holotype is lost, his S. ovata holotype and other Stenopora species collected by Strzelecki and described and figured by Lonsdale (Reference Lonsdale and Strzelecki1845) are housed in the collections of the Natural History Museum, London. Without type material, S. tasmaniensis and Stenopora continued to be identified by subsequent workers on the basis of evolving perceptions of the species and genus. Bassler (Reference Bassler1941) attempted to stabilize the concept of Stenopora using material incorrectly assigned to S. tasmaniensis by Dana (Reference Dana1849). Bassler later used the same material to support the Treatise on Invertebrate Paleontology description of Stenopora (Bassler, Reference Bassler and Moore1953). The genus requires redescription based on material of the type species from the original collection locality, along with consideration of other Stenopora species described by Lonsdale (Reference Lonsdale and Darwin1844, Reference Lonsdale and Strzelecki1845).
This contribution discusses the history of the conceptual understanding of Stenopora tasmaniensis, and thus the genus Stenopora, and establishes a neotype obtained from the original collection locality. In addition, a single large colony exhibiting two morphologies is described to determine any variation between morphologies and to establish the range of variation that may be seen within one zoarium, and thus the species.
Historical background
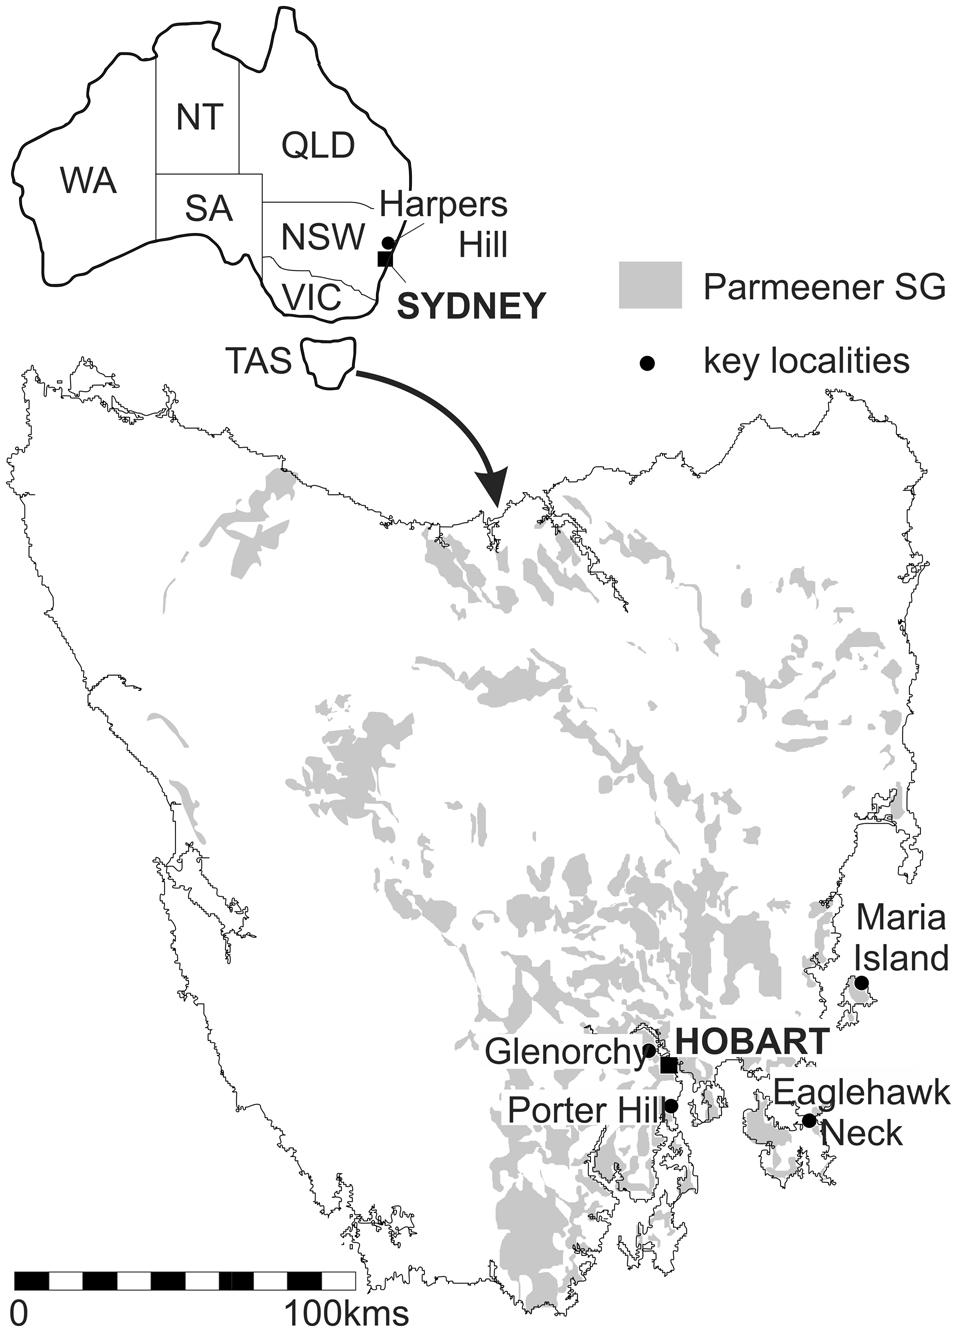
Charles Darwin laid over in Hobart in February 1836 during the voyage of the Beagle and visited several locations in and around Hobart town, collecting fossils at Porter Hill, Glenorchy, and Eaglehawk Neck (Banks, Reference Banks1971) (Fig. 1). William Lonsdale (Reference Lonsdale and Darwin1844) described the first six recorded species of Australian “corals” (bryozoans) as an appendix to Darwin (Reference Darwin1844): Stenopora tasmaniensis, S. ovata, Fenestella ampla, F. internata, F. fossula and Hemitrypa sexangular; Lonsdale did not figure the material. Lonsdale (Reference Lonsdale and Strzelecki1845) reported on the same six species in Strzelecki (Reference Strzelecki1845) along with the new species Stenopora crinita and S. informis and this time included figures of all species. Stenopora tasmanienis is described in detail by Lonsdale (Reference Lonsdale and Darwin1844); however, Lonsdale (Reference Lonsdale and Strzelecki1845) gave few details, likely because the material collected by Strzelecki was described as preserved in cast form. Material figured by Lonsdale (Reference Lonsdale and Strzelecki1845, pl. 13, fig. 2) appears to be skeletal material and well preserved, not moldic, and in the explanation of the plates, the figured Stenopora tasmaniensis is “a specimen in the collection of the Geological Society.” It is very likely that this was Darwin's preexisting material as there are no other early collections of Tasmanian or Australian material noted or published before Strzelecki (Reference Strzelecki1845). Further, in the explanation of plate 9 in Strzelecki (Reference Strzelecki1845), several figured Fenestella species are stated to be from the collection of Mr. Darwin. Lonsdale described the generic concept of Stenopora in Lonsdale (Reference Lonsdale and Darwin1844) but did not formalize the name as a genus until further examples of the species were available in Strzelecki's collection.
Location of sites discussed in the text and the distribution of Parmeener Supergroup surface outcrops in Tasmania. WA = Western Australia; SA = South Australia; NT = Northern Territory; QLD = Queensland; NSW = New South Wales; VIC = Victoria; TAS = Tasmania. Base map modified from Reid et al. (Reference Reid, Forsyth, Clarke and Bacon2014).

Lonsdale's (Reference Lonsdale and Darwin1844, p. 161–162) description of Stenopora tasmaniensis refers to cylindrical branches about half an inch in diameter, with oval apertures (“mouths”) surrounded by closely spaced acanthostyles (“tubercules”) with moniliform walls (“successive narrowing in each tube”). Lonsdale also stated no transverse diaphragms are seen within the zooecial tubes. He also remarked on the occurrence of a “groove” or “double ridge” between apertures and indicated that acanthostyles are present on each ridge. Last, Lonsdale referred to the closing of the mature apertures but noted that there was only one example of this. Although Lonsdale erected the name Stenopora in 1844, he described diagnostic features only briefly in footnotes and gave a full description in Strzelecki (Reference Strzelecki1845) (Lonsdale, Reference Lonsdale and Strzelecki1845). The full genus description notes “tubular mouths, closed at final (?) period of growth” (despite noting that this feature is seen only occasionally, and not at all in some species), with acanthostyles surrounding the tubes, and the presence of exilazooecia (“additional tubes”) (Lonsdale, Reference Lonsdale and Strzelecki1845, p. 262). There is no comment in the genus description of the number of exilazooecia, the relative size of the acanthostyles, or the presence or absence of diaphragms. However, in descriptions of the various species of Stenopora in both 1844 and 1845, Lonsdale either did not describe diaphragms or stated they were not developed; exilazooecia are irregular (S. crinita), not noted (S. tasmanienis and S. ovata), or numerous (S. informis). No variation in acanthostyle size is noted for any species.
Acanthostyles
Shortly after Lonsdale erected these early Australian species, the geological and paleontological results of the American Wilkes Expedition were published by Dana (Reference Dana1849). Stenopora tasmaniensis (as Chaetetes tasmaniensis) was recorded by Dana (Reference Dana1849) from Harper's Hill in the Hunter Valley, and two specimens were figured; one (Dana, Reference Dana1849, plate 11, fig. 8a) shows two distinct sizes of acanthostyles, and the other (Dana, Reference Dana1849, plate 11, fig. 7a) does not. The occurrence of two sizes of acanthostyles is at odds with the initial description of Stenopora tasmaniensis. This Wilkes expedition material was subsequently used by Bassler (Reference Bassler1941, Reference Bassler and Moore1953) in his redescription of the type species of Stenopora.
Diaphragms
The presence or absence of diaphragms in Stenopora, and the validity of various genera, was a topic of frequent discussion in early literature, despite Lonsdale being clear diaphragms were absent in Stenopora tasmaniensis and from the initial description of the genus. Nicholson and Etheridge (Reference Nicholson and Etheridge1886), in their reexamination of Tasmanian and Australian species, determined that tabulae (i.e., diaphragms), perforate or whole, were present in some specimens, and concluded they were present in S. tasmaniensis. However, the determination of the presence of tabulae was based on interpreting Lonsdale's (Reference Lonsdale and Strzelecki1845, p. 262) observation of some “mouths being closed at the final period of growth” as representing tabulae in tangential section. Despite this conclusion about tabulae, they are not figured in cross sections (Nicholson and Etheridge, Reference Nicholson and Etheridge1886, plate 3, figs. 10, 13), the view in which they should be expected to be seen if they are present. In examination of Strzelecki's S. ovata material in thin section, Nicholson and Etheridge (Reference Nicholson and Etheridge1886) also appear to have interpreted oblique cross sections of monilae as partial diaphragms. Etheridge (Reference Etheridge1891) partly rescinded these conclusions and wrote that S. tasmaniensis has sparse tabulae in the axial region, and perforate diaphragms near the surface of the zoarium, although he did not figure this feature. Nicholson and Etheridge (Reference Nicholson and Etheridge1886) also noted that type material of S. tasmaniensis was already lost, and instead they described and figured material from Harper's Hill and branching and frondescent material from Tasmania.
Colony morphology
In nineteenth-century trepostome bryozoan systematics, colony morphology was a key defining feature, and individual species were usually described as being of a single morphology, although in the case of ramose forms flattened branches were included. Each species described by Lonsdale (Reference Lonsdale and Darwin1844, Reference Lonsdale and Strzelecki1845) likewise had a single morphology; however, his description of Stenopora allows for ramose, spherical, or amorphous tubular morphologies within the genus.
Etheridge (Reference Etheridge1891) discussed colony morphology at length, including the idea that one species may have more than one form; however, he could not produce proof and retained the then-existing model that a species had only one colony form. He was aware of several frondescent specimens from Tasmania and, recognizing the microscopic structure was similar to existing ramose species, saw these as allied, but separate, species and erected the name S. johnstoni as the frondescent ally to ramose S. tasmaniensis. This tradition was continued by Crockford (Reference Crockford1943, Reference Crockford1945) in her descriptions of new and existing trepostome species from Tasmania and eastern Australia, describing one morphological form per species.
Collection of more-complete specimens has revealed single colonies with more than one morphology, where frondescent forms give rise to branches, and individual species of Stenopora are now known to have multiple colony forms—and may include encrusting (sedimentary and hard substrates), delicate to coarse ramose, frondescent, or massive spheroidal colonies (Wass, Reference Wass1968; Reid, Reference Reid2003, Reference Reid2010, Reference Reid, Ernst, Schafer and Scholz2012). This is also known in other trepostomous bryozoans (Erikson and Waugh, Reference Erickson, Waugh, Wyse Jackson, Buttler and Spencer Jones2002; Waugh et al., Reference Waugh, Erickson and Crawford2005) in addition to variation in branching characters within Ordovician ramose trepostomes (Key et al., Reference Key, Wyse Jackson and Felton2016).
Bassler's type species description
The lack of clarity of the characters of Stenopora and the absence of type material led to the redescription of Stenopora by Bassler (Reference Bassler1941). He had access to material collected from New South Wales during the 1838–1842 Wilkes Expedition and identified by Dana (Reference Dana1849), and he selected one of these specimens as the basis for his description of the internal characters of the type species. Bassler (Reference Bassler1941, p. 174) gave the following brief description: “the presence of strongly beaded zooecial walls and of a large and a small set of acanthopores, the lack of mesopores (exilazooecia), and the practical absence of diaphragms of any nature.” The comments on diaphragms return the description to the concept of Stenopora that Lonsdale would have gained from the species he described in 1844 and 1845, thus resolving this issue for subsequent workers. Bassler (Reference Bassler1941) referred to a lack of mesopores (exilazooecia), but as these are figured (fig. 5, p. 175), “lack” could be taken to mean not occurring often, rather than completely absent. Again, this aligns with the detailed description by Lonsdale (Reference Lonsdale and Strzelecki1845). A key point of difference from Lonsdale's figured material is Bassler's description and figure of two clear sizes of acanthostyles. In selecting Dana's (Reference Dana1849) material from Harper's Hill, New South Wales, Bassler (Reference Bassler1941) was not describing material from the type locality in Tasmania. Dana (Reference Dana1849) is the only previous author to have referred to two sizes of acanthostyles in S. tasmaniensis; all other workers described one size only within species erected by Lonsdale (if described). This misidentification of two sizes of acanthostyles in the type species of Stenopora is further exacerbated by Bassler in the 1953 bryozoan Treatise, where he reuses the figure of Dana's material from Bassler (Reference Bassler1941) and defines a “megacanthopore on distal side of each zooecial tube, and many micracanthopores between tubes, mostly at zooecial angles” (Bassler, Reference Bassler and Moore1953, fig. 65, 1a, b, pages G101–102). This description is prescriptive about the arrangement of acanthostyles and differs significantly from Tasmanian examples of the type species Stenopora tasmaniensis.
Stratigraphy
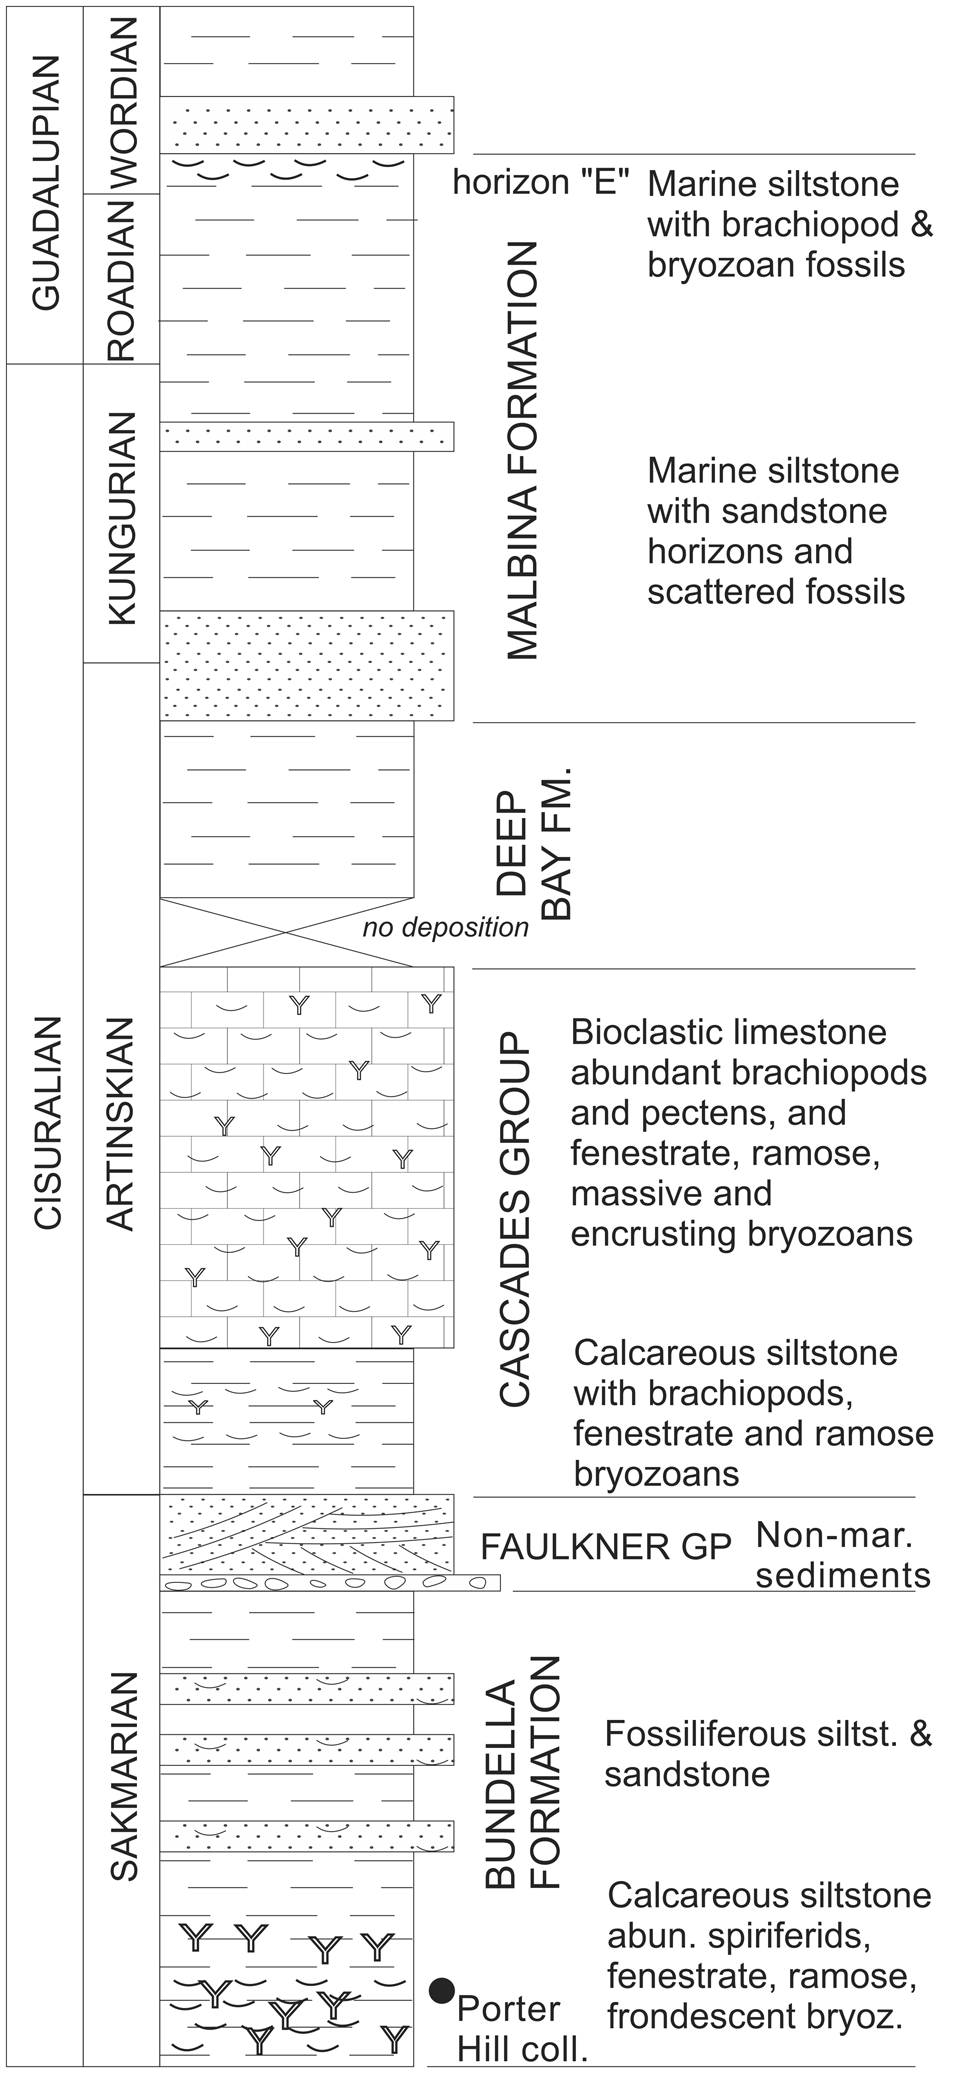
Carboniferous to Triassic rocks are widespread in Tasmania within the Parmeener Supergroup (Fig. 1) (Banks, Reference Banks1973). Permo-Carboniferous Lower Parmeener Supergroup rocks are dominated by marine units overlain by nonmarine late Permian and Triassic rocks of the Upper Parmeener Supergroup (Forsyth et al., Reference Forsyth, Farmer, Gulline, Banks, Williams and Clarke1974). Tasmania lay at approximately 70°S during the late Palaeozoic Ice Age (Li and Powell, Reference Li and Powell2001), and Carboniferous and earliest Permian rocks include glacial diamictites and pebbly mudstones, with well-developed marine fossiliferous beds not appearing until the Sakmarian. Brachiopod, bryozoan, crinoid, and bivalve fossils are common in the Bundella Mudstone (Fig. 2) in Hobart, and equivalent beds on Maria Island, where large frondescent examples of Stenopora tasmaniensis are common. A brief nonmarine incursion in the late Sakmarian is followed by marine fossiliferous siltstones and bioclastic limestones in the Artinskian Cascades Group. The limestones are rich in well-preserved bryozoans, brachiopods, crinoids, and pectens. Marine conditions continued in overlying units but are siliciclastic in nature with scattered fossil horizons and often poor preservation. One exception is the fossiliferous horizon “E” at the top of the Malbina Formation that, at Eaglehawk Neck, has well-preserved colonies of Stenopora crinita.
Generalized stratigraphic column of the main fossiliferous Permian marine beds in the Tasmania Basin. Position of Charles Darwin's Porter Hill collection locality shown. Stratigraphic nomenclature from Reid et al. (Reference Reid, Forsyth, Clarke and Bacon2014).

Charles Darwin collected fossils from the Bundella Mudstone at Porter Hill, Cascades Group at Glenorchy, and Malbina Formation at Eaglehawk Neck (Banks, Reference Banks1971).
Materials and methods
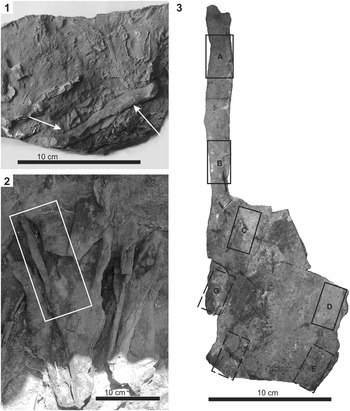
Field collections were made primarily from the Bundella Mudstone on the shoreline below Porter Hill (2008, 2009, and 2015) and from equivalently aged “basal beds” at the Fossil Cliffs of Maria Island (2009). Effort was made to collect several examples of both ramose and frondescent bryozoan specimens and colonies where both morphologies are displayed. Numerous branching specimens were examined; however, only those with characters aligning with Lonsdale's initial descriptions are described. Overall, three ramose and four frondescent specimens were sectioned and measured from Porter Hill, along with one frondescent colony from Maria Island. In addition, a single colony from Maria Island displaying both frondescent and ramose morphologies was sampled and measured at several positions across the colony to investigate intracolony variation (Fig. 3).
Field- and hand-specimen photographs. (1) Hand specimen of Stenopora tasmaniensis Lonsdale, Reference Lonsdale and Darwin1844 neotype TMAG Z10552 from Bundella Mudstone, shoreline below Porter Hill, Lower Sandy Bay, Hobart. Note variety of other ramose trepostomes of differing size in the same sample and fenestrate bryozoans. (2) Large S. tasmaniensis specimen TMAG Z10560, Basal Beds, south Fossil Cliffs, Maria Island in outcrop with frondescent lower zoarium giving rise to ramose portions in upper parts. Box denotes portion collected and shown in Figure 3.3. (3) Specimen map of thin sections A–G taken across the single sample TMAG Z10560. Solid boxes indicate tangential sample from front of specimen; dashed boxes indicate tangential sample taken from sediment-covered reverse surface.

Acetate peels and thin sections were made from individual specimens in tangential, transverse, and longitudinal view. Peels were prepared to provide initial internal views; however, as acetate peels may deform over time, all views from each specimen were finished with a glass-mounted thin section that, in tangential view, was slightly oblique to preserve deep and shallow features. Peels and thin sections were examined under a petrographic microscope, and standard skeletal measurement made using Nikon Elements software. For material designated as the neotype (TMAG Z10552) up to 40 measurements were taken of each skeletal character, where possible. For additional material, a maximum of 20 measurements of each character were made.
Statistical analyses
Zoarial character measurements were made across the prepared material, and summary statistics, including coefficient of variation, were produced in Excel. Intracolony variation of skeletal parameters was measured in subsamples of a single colony displaying both ramose and frondescent morphologies (TMAG Z10560A–B ramose, TMAG Z10560C–G frondescent). ANOVA tests in Paleontological Statistics software (PAST) (Hammer et al., Reference Hammer, Harper and Ryan2001) were performed to determine differences between subsampled means of skeletal parameters most closely associated with the living zooid, these being aperture width, length, and distance between apertural centers (AW, AL, and ACD, respectively), along with exozonal wall thickness (EXW) and the number of acanthostyles per autozooecium (AAZ). Where differences were found, Tukey's honestly significant difference (HSD) results were assessed to identify the dissimilar samples.
The diameter of each acanthostyle was measured sequentially around individual apertures in the neotype and selected other material, Anderson–Darling normality tests were performed, and normal probability plots were produced to investigate acanthostyle size distributions. These analyses and figure plots were produced in PAST.
Repository and institutional abbreviation
All material is stored in the Tasmanian Museum and Art Gallery Geology collections (TMAG-Z10552–TMAG-Z10560).
Systematic paleontology
Phylum Bryozoa Ehrenberg, Reference Ehrenberg1831
Class Stenolaemata Borg, Reference Borg1926
Order Trepostomata Ulrich, Reference Ulrich1882
Family Stenoporidae Waagen and Wentzel, Reference Waagen and Wentzel1886
Genus Stenopora Lonsdale, Reference Lonsdale and Darwin1844
Type species
Stenopora tasmaniensis Lonsdale, Reference Lonsdale and Darwin1844; Sakmarian of Tasmania, Australia.
Diagnosis
Zoarium ramose, frondescent, encrusting, massive, or discoidal. One or more morphological forms may be exhibited in one zoarium or species. Endozonal walls thin and tubes free of diaphragms. Exozonal walls thickened by irregularly or regularly spaced monilae, diaphragms absent. Autozooecial apertures oval to rounded, exilazooecia present, rare to common. Apertures surrounded by acanthostyles of one size, either restricted to autozooecial wall junctions or regularly spaced about apertures. Maculae may be developed.
Remarks
Differentiated from Tabulipora Young, Reference Young1883 and Stenodiscus Crockford, Reference Crockford1945 by the absence of diaphragms and the presence of ring septa in the former. Only ramose and frondescent forms have been confirmed in the type species to date; however, other species of Stenopora include encrusting, massive, and discoid forms.
Stenopora tasmaniensis Lonsdale, Reference Lonsdale and Darwin1844
Figures 3–5; Table 1
- Reference Lonsdale and Darwin1844
Stenopora tasmaniensis Lonsdale, p. 161.
- Reference Lonsdale and Strzelecki1845
Stenopora tasmaniensis; Lonsdale, p. 262, pl. 8, fig. 2–2e.
- non Reference Dana1849
Stenopora tasmaniensis; Dana, pl. 11, figs. 7a, 8a.
- Reference Nicholson and Etheridge1886
Stenopora tasmaniensis; Nicholson and Etheridge, p. 178, pl. 3, figs. 9–13.
- Reference Etheridge1891
Stenopora tasmaniensis; Etheridge, p. 60, pl. 4, figs. 3, 4, pl. 5, figs. 7, 8.
- Reference Etheridge1891
Stenopora johnstoni; Etheridge, p. 59, pl. 7, fig. 7.
- Reference Hummel1915
Stenopora johnstoni; Hummel, p. 74, pl. 8, figs. 4a, b.
- Reference Crockford1945
Stenopora johnstoni; Crockford, p. 20, text-figs. 24, 25.
- non Reference Wass1968
Stenopora tasmaniensis; Wass, p. 23, pl. 2, figs. 2, 3, pl. 3, figs. 1–3, pl. 4, figs. 1, 2.
- Reference Reid2003
Stenopora tasmaniensis; Reid, p. 117, fig. 50, table 43.
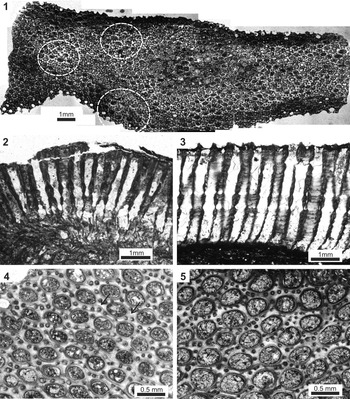
Thin-section photomicrographs of Stenopora tasmaniensis Lonsdale, Reference Lonsdale and Darwin1844. (1) Composite image of neotype TMAG Z10552 in shallow tangential section. Unraised maculae are circled. (2) Ramose colony TMAG Z10554 in transverse view showing partly crushed endozone and exozone with monilate walls. (3) Frondescent colony portion UC22041E showing exozone only; endozone completely crushed. (4) Neotype TMAG Z10552 tangential section showing typical arrangement of oval apertures and acanthostyles in ramose forms. Note the alignment of apertures and appearance of a double row of acanthostyles (arrows). (5) TMAG Z10558 showing typical oval to rounded apertures in frondescent forms.

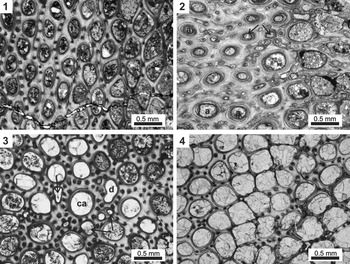
Thin-section photomicrographs of Stenopora tasmaniensis to show variation in tangential section and macular characters. (1) Neotype TMAG Z10552 in oblique tangential section showing usual arrangement of acanthostyles and wall thickness at level of monilae, left side of image, and reduced size and number of acanthostyles, and thinner wall, deeper in the exozonal wall. (2) Ramose colony TMAG Z10553 tangential acetate peel of a maculae, left side of image, showing exilazooecia (arrowed) and extreme thickening of walls reducing the diameter of autozooecial apertures (a) toward the colony surface. (3) Frondescent colony portion TMAG Z10560E tangential thin section showing maculae with large central aperture (ca), radial arrangement of regular apertures, and numerous exilazooecia (arrows). Note also the deformed aperture (d). (4) Ramose TMAG Z10560B tangential section through section of outer exozone with well-developed acanthostyles in wall unthickened by monilae.

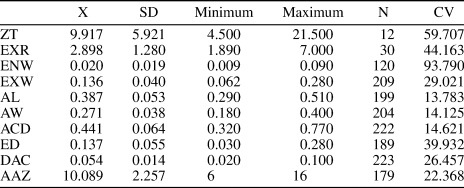
Summary measurements for Stenopora tasmaniensis. ZT = zoarial thickness; EXR = radius of exozone; ENW = endozone wall thickness; EXW = exozone wall thickness at level of monilae; AL = autozooecial aperture length; AW = autozooecial aperture width; ACD = distance between autozooecial centers; ED = exilazooecia diameter; DAC = acanthostyle diameter; AAZ = number of acanthostyles about each autozooecial aperture; X = mean; SD = standard deviation; N = number of counts; CV = coefficient of variation. Summary statistics generated from measurement of all type-locality material (TAG Z10552-Z10558) along with Maria Island specimens TMAG Z10559 and TMAG Z10560A (ramose) and TMAG Z10560D (frondescent).

Neotype
TMAG Z10552. Selected for the conformity of zoarial diameter, and aperture and acanthostyles characters with the original description by Lonsdale (Reference Lonsdale and Darwin1844). The holotype was first noted as lost by Nicholson and Etheridge (Reference Nicholson and Etheridge1879, Reference Nicholson and Etheridge1886). Material collected by Charles Darwin should be housed in the Natural History Museum, London (NHM) collections. The author has inspected the NHM collections (February 2011), confirming that while other materials collected by Darwin (and Strzelecki), and described by Lonsdale, are present, the holotype for Stenopora tasmaniensis is missing. Attempts to locate the material in regional museums have failed.
Diagnosis
Zoarium ramose and bilaminar frondescent. Wall irregularly thickened in exozone, monilae variously widely spaced, to confluent in places. Autozooecial tubes meet zoarial surface at approximately 90°. Diaphragms are absent. Autozooecial apertures oval to subcircular and surrounded by numerous acanthostyles. Maculae may be present flush with the zoarial surface or raised above it. Exilazooecia circular to oval and uncommon but may be abundant within maculae.
Occurrence
Material from the Sakmarian Bundella Mudstone from shoreline below Porter Hill, Lower Sandy Bay, Hobart, and the Sakmarian basal beds at Fossil Cliffs, Maria Island, are examined in this study. The species has previously been recorded from these, and other, Sakmarian units throughout Tasmania (Nicholson and Etheridge, Reference Nicholson and Etheridge1886; Etheridge, Reference Etheridge1891; Hummel, Reference Hummel1915; Reid, Reference Reid2003). In New South Wales the species is known from similarly aged Allandale Stage beds in the Hunter Valley, including Harper's Hill (Nicholson and Etheridge, Reference Nicholson and Etheridge1886; Etheridge, Reference Etheridge1891; Hummel, Reference Hummel1915; Crockford, Reference Crockford1945).
Description
Zoarium ramose and bilamellar frondescent, some colonies exhibiting both morphologies. Zooecial tubes in the endozone are thin walled and are commonly crushed, especially in frondescent forms. In well-preserved ramose forms, arcuate rows of widely spaced monilae may cross the endozone. The exozone is thickened by one or more layers, each with irregularly spaced monilae in the zooecial walls that tend to become confluent toward the outer part of the exozone. As a result, the exozone can vary in thickness as does the total thickness of the colonies. Diaphragms are absent.
Autozooecial apertures at the level of monilae thickening are oval to rounded. In ramose forms, apertures are typically oval with the long axis usually parallel to the direction of growth, and in frondescent forms rounded or oval, often with no preferred direction. Apertures are surrounded by numerous acanthostyles, usually 9–12, both at wall junctions and the spaces between, but up to 16 within maculae. In deeper section, acanthostyles may be present only at wall junctions, with as few as six surrounding each aperture. Acanthostyles of one size are in a single row about each aperture but may be slightly larger within maculae, or smaller if seen only in deeper section. In ramose forms, where oval apertures may be aligned and wall junctions thicker, there may occur two rows of acanthostyles aligned with the direction of the branch (Fig. 4.4). Oval to rounded exilazooecia are rare across the general zoarium but may be abundant within maculae. Maculae occur as either flattened or raised areas identified by an abundance of exilazooecia, thickened walls, and more-numerous acanthostyles. In the center of some maculae of frondescent forms is a single enlarged aperture, with other apertures arranged radially about it (Fig. 5.3). The thickening of the walls within maculae may impinge on the apertures, reducing their size (Fig. 5.2).
Materials
TMAG Z10552–Z10558 Bundella Mudstone, Lower Sandy Bay, Hobart (45°55′19.40″S, 147°21′39.75″E); TMAG Z10559 basal beds, Fossil Cliffs, Maria Island (42°34′19.90″S, 148°04′43.45″E); TMAG Z10560 basal beds, Fossil Cliffs, Maria Island (42°34′28.20″S, 148°04′47.25″E).
Remarks
All material here accepted as S. tasmaniensis is Sakmarian in age. Material assigned to S. tasmaniensis by Wass (Reference Wass1968) from younger beds (Artinskian to Wordian) of Queensland was referred to Stenopora seriatensis Reid, Reference Reid2003 in the establishment of that species.
Results
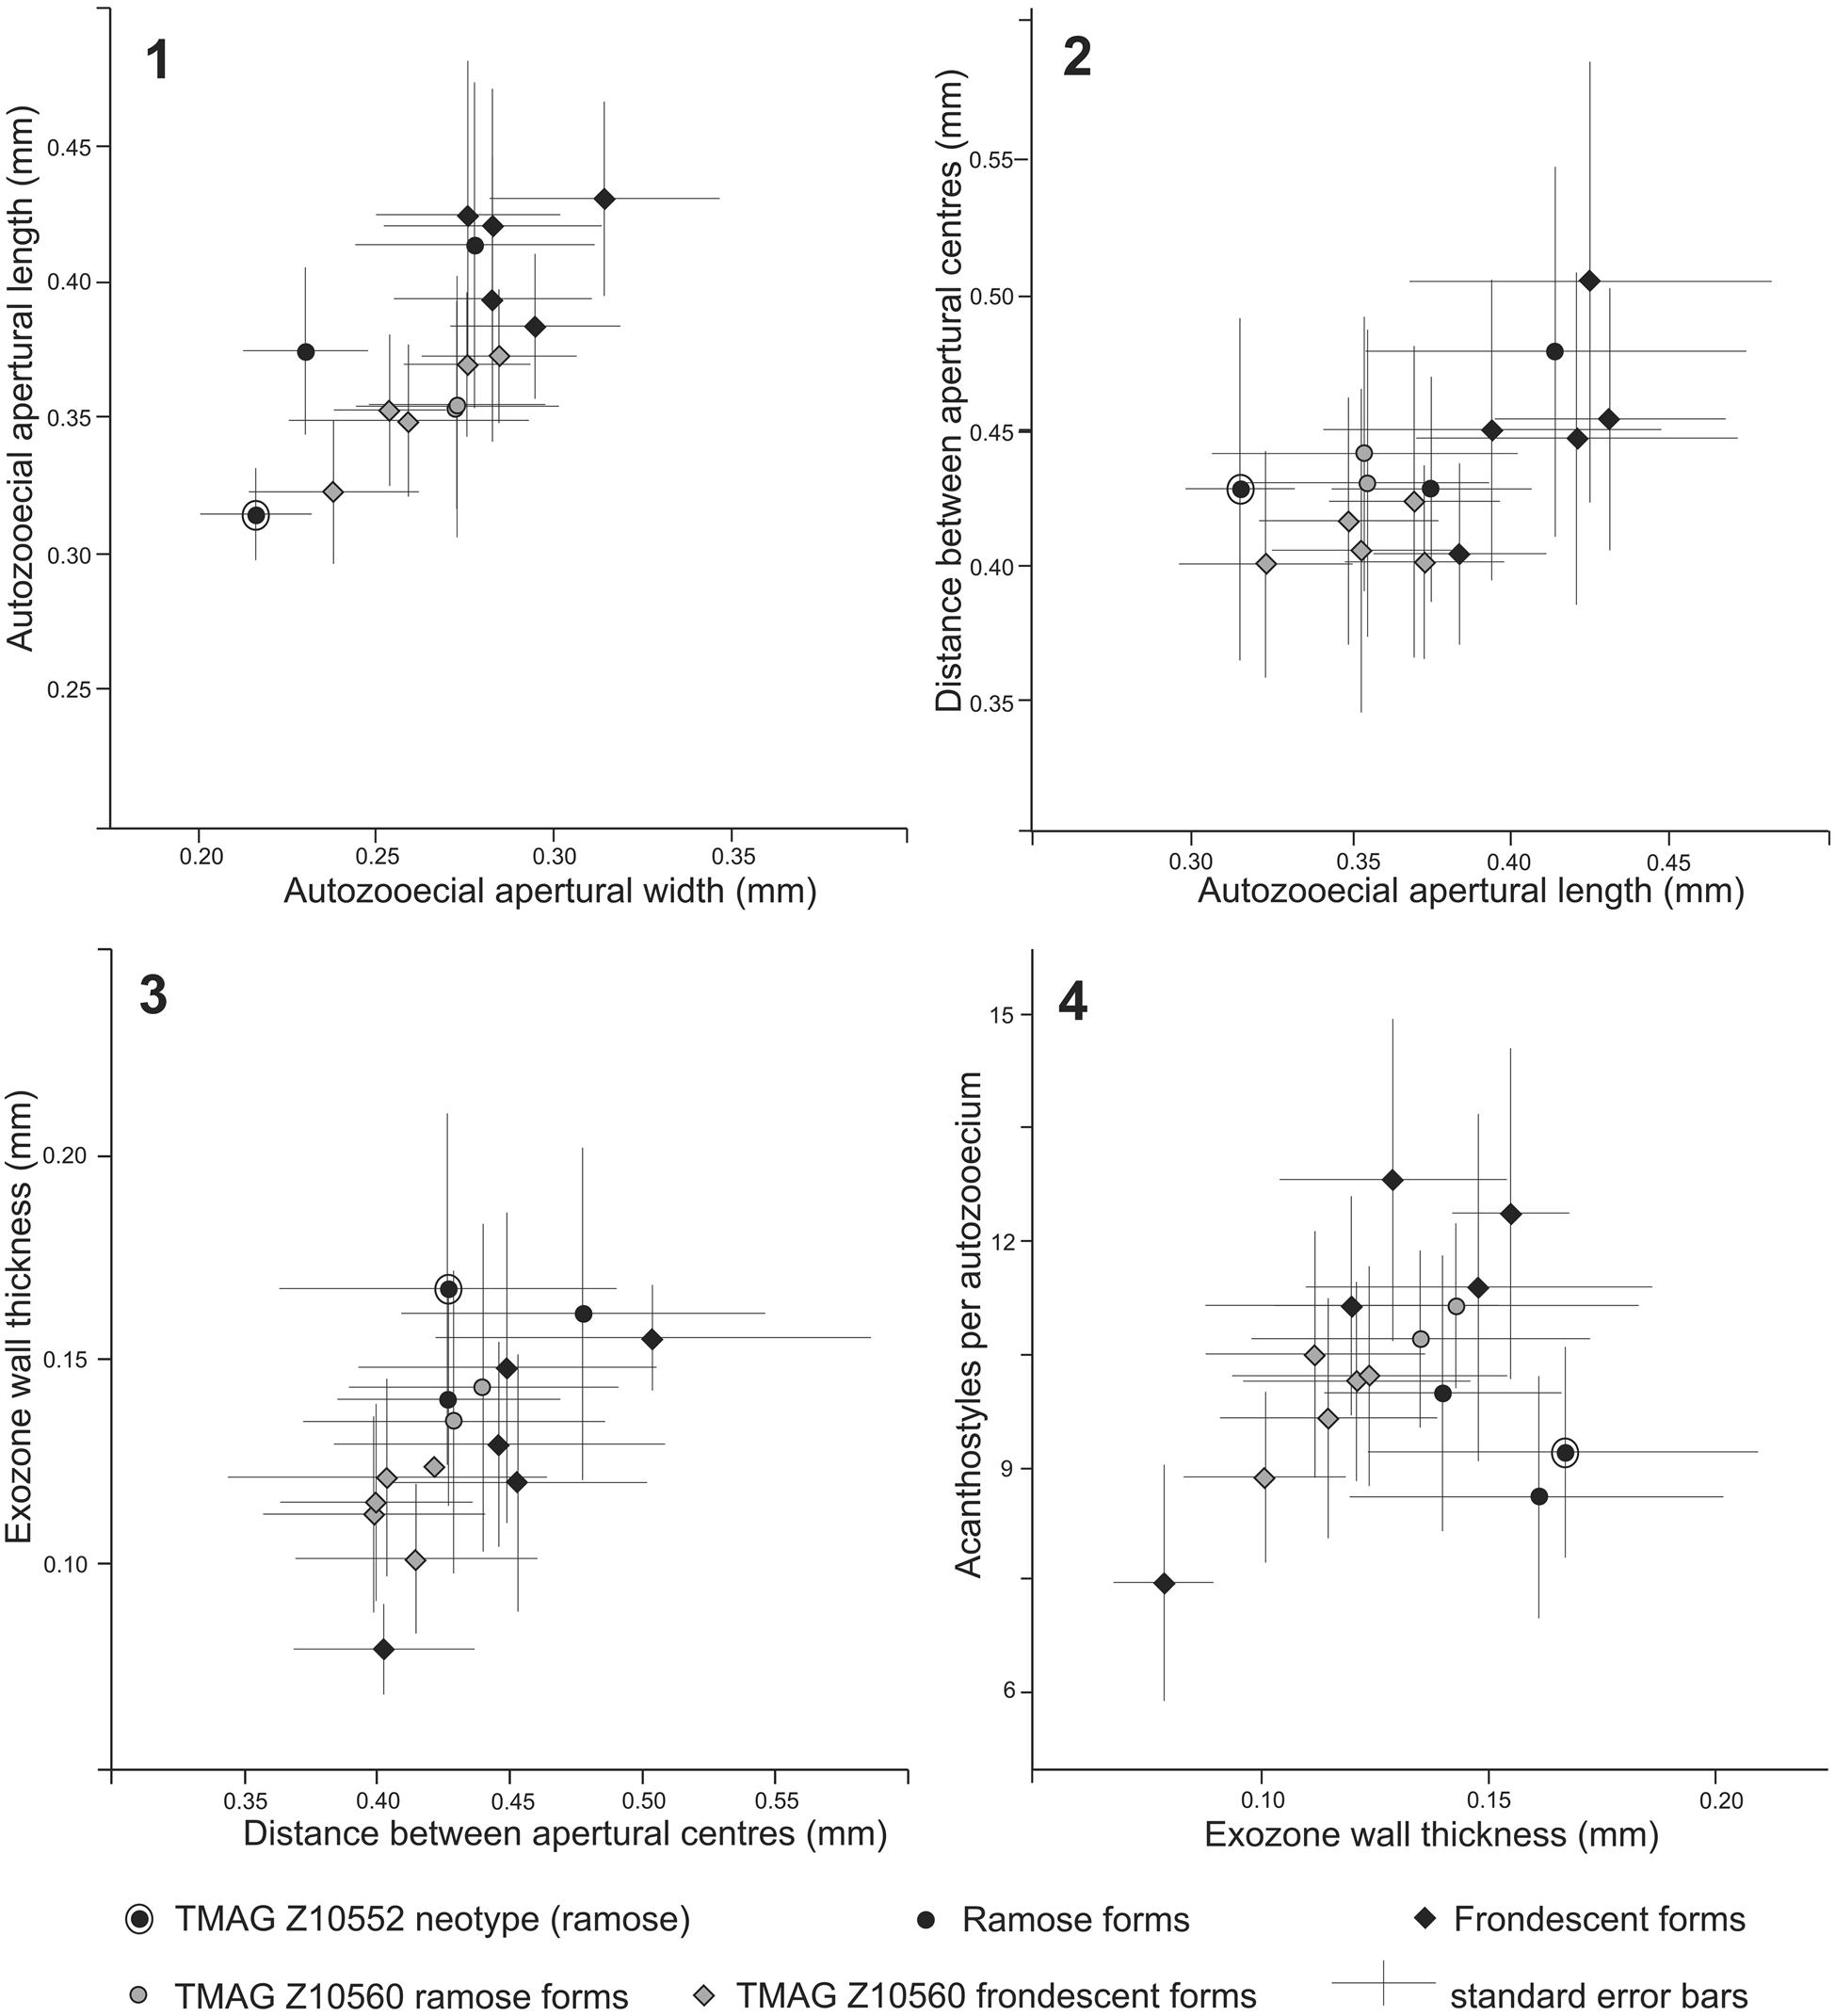
Visual analysis of the material confirms species identification, and summary statistics of zoarial parameters for all samples show lowest coefficient of variation for characters associated with the autozooid (i.e., aperture length, width, distance between centers) and higher variation in characters associated with zoarial form (i.e., zoarial thickness and exozone thickness) (Table 1). Plots of individual sample means and standard errors for aperture width, length, distance between centers, exozonal wall thickness, and acanthostyle number (Fig. 6) reveal variation between samples despite low, or relatively low, coefficients of variation for these parameters
Graphical presentation of selected internal characters (mean with standard error). Black points are data from individual specimens; gray points are all data from the polymorphic colony shown in Figure 3.3. (1) Autozooecial apertural width versus length (mm). (2) Autozooecial apertural length versus distance between apertural centers (mm). (3) Distance between apertural centers versus exozone wall thickness (mm). (4) Exozone wall thickness (mm) versus acanthostyles per autozooecium (n) nearest zoarial surface.

Intracolony variation
The subsampled sections of colony (TMAG Z10560) with an initial frondescent morphology giving rise to ramose portions (Fig. 3) show a range of sample means. For aperture width and length (Fig. 6.1), frondescent samples show a wide range of means, and ramose samples are encompassed within them. A one-way ANOVA reveals significant differences within the sample set (p < 0.001 for both AW and AL), and Tukey's tests reveal the greatest differences exist between frondescent subsamples E and G (see Fig. 3) and other samples. The ACD (Fig. 6.2) shows no significant difference between samples (ANOVA p > 0.1), and all samples show a normal distribution. Exozonal wall thickness and the number of acanthostyles per autozooecium (Fig. 6.3, 6.4) show significant variation between samples (ANOVA p < 0.001 for both EXW and AAZ), although sample data for acanthostyles per autozooecium do not follow a normal distribution. Tukey's analysis for exozonal wall thickness reveals the ANOVA result is driven by ramose sample B differing from frondescent samples, and for acanthostyles per autozooecium the ANOVA result is driven by sample C differing from all other samples.
Acanthostyle size distribution
Visual examination of tangential sections of all samples reveals acanthostyles about each autozooecium are the same size (Figs. 4.4, 4.5, 5.1–5.4). Statistical analysis of the acanthostyle diameter measured as a series about 12 autozooecial apertures on TMAG Z10552 and a further 10 from TMAG Z10560B and E reveals that acanthostyles per aperture each have a normal distribution (Anderson–Darling test p > 0.22 for all samples). Visual inspection of normal probability plots confirms a normal rather than bimodal distribution. Within each colony there is a significant difference between individual aperture acanthostyle mean diameters (ANOVA p < 0.001). In other words, while acanthostyles about each aperture are of a similar size with normal distribution, acanthostyle size may differ across the zoarium.
Discussion
Paleozoic bryozoan species are typically identified, as was the case here with Stenopora tasmaniensis, by assessment of both qualitative and quantitative characters, such as approximate size and shape of the aperture, wall thickness, acanthostyle number and appearance, and the number of exilazooecia. Quantitative measures show at times a high degree of variability, as seen here by the high coefficient of variation for some characters (Table 1). Characters with lower coefficients of variation (<25) in pooled data still reveal variation between individual colonies (Fig. 6). However, the results of repeated measures across a single large colony TMAG Z10560 (Fig. 3) shows that within-colony variation is high, with statistically significant variation between subsample means for some parameters. Intercolony morphological variation has been shown previously and inferred to be genetic in origin (Schopf, Reference Schopf1976; Key, Reference Key and Ross1987), and within-colony variation has been interpreted to be from environmental gradients (Key, Reference Key and Ross1987; Hageman et al., Reference Hageman, Wyse Jackson, Abernethy and Steinthorsdottir2011). The variation in the single colony shown here, along with variation between other individual specimens, confirms the importance of qualitative assessment in identifying Paleozoic bryozoan species. The quantitative measurements remain important in definition of the species and understanding of differences but can form only a part of the identification of an individual species, although between-species differentiation may be able to be made quantitatively for some bryozoan groups (Hageman, Reference Hageman1991; Snyder, Reference Snyder1991).
Lonsdale's initial description of Stenopora tasmaniensis Lonsdale, Reference Lonsdale and Darwin1844 was of a ramose colony, and subsequently new species were named for forms with similar characters but a different colony morphology, as is the case for S. johnstoni Etheridge, Reference Etheridge1891 despite initial suspicion by Etheridge that a species may exhibit more than one colony morphology. The occurrence of multiple colony morphologies within a species is now accepted for many Paleozoic bryozoan genera, including Stenopora (Wass, Reference Wass1968; Reid, Reference Reid2003, Reference Reid, Ernst, Schafer and Scholz2012), and this is clearly shown here in TMAG Z10560. The results of analysis of a single colony (TMAG Z10560) in this study have shown that characters related to the zooid may show variation across a colony, but these are not directly linked to any variation in morphology of the zoarial portion sampled.
The description of the genus Stenopora by Lonsdale (Reference Lonsdale and Strzelecki1845) included ramose, spherical, and amorphous tubular forms, based on his interpretation of the four species of Stenopora described (S. tasmaniensis, S. ovata, S. informis, and S. crinita). Subsequent descriptions of these species alone have expanded the range of morphologies to include ramose, encrusting (hard and soft substrates), massive, and frondescent forms (Wass, Reference Wass1968; Reid, Reference Reid2003, Reference Reid, Ernst, Schafer and Scholz2012).
Lonsdale (Reference Lonsdale and Darwin1844) described the occurrence of numerous acanthostyles surrounding each autozooid but made no comment on their relative sizes. The figured material in Strzelecki (Reference Strzelecki1845, plate 8, figs. 2a–d) shows acanthostyles of one size only, and one of these figures shows the “double row” of acanthostyles, confirming this as an occasional but not persistent feature. The material described here confirms the occurrence of only a single size of acanthostyle. Statistical analysis of sets of acanthostyles confirmed the visual assessment; acanthostyles about each aperture are of one size, although they may vary across the zoarium depending on the depth of the prepared thin section, and at times larger acanthostyles occur in the maculae (Figs. 4.4, 4.5, 5). Bassler's (Reference Bassler1941) redescription of the type species, based on material incorrectly assigned to S. tasmaniensis by Dana (Reference Dana1849), is not an accurate representation of the species, and the subsequent description of Stenopora by Bassler (Reference Bassler and Moore1953) needs to be set aside with respect to acanthostyles. The position of species exhibiting two sizes of acanthostyles, and currently included within Stenopora, now requires revision and potential removal from the genus.
Earlier literature has included much discussion about the presence or absence of diaphragms (tabulae) in Stenopora, and this was resolved by Bassler (Reference Bassler1941, Reference Bassler and Moore1953) in the correct exclusion of diaphragms from Stenopora. The absence of diaphragms in S. tasmaniensis is confirmed in this study. However, the “partial closing of the mouths” initially described by Lonsdale (Reference Lonsdale and Darwin1844), and later incorrectly referred to as diaphragms by others (Nicholson and Etheridge, Reference Nicholson and Etheridge1886; Etheridge, Reference Etheridge1891), was seen in this study (Fig. 5.2). This is a thickening of the exozonal wall occurring toward the outer surface of the colony within maculae and does not represent diaphragms. It is worth noting that Bassler (Reference Bassler1929) erected Ulrichotrypa with the absence of diaphragms its only distinction from Stenopora, which at the time was believed to possess them. In his confirmation of the absence of diaphragms in Stenopora, Bassler (Reference Bassler1941) synonymized Ulrichotrypa; however, subsequent examination led Romanchuk (Reference Romanchuk1967) to retain Ulrichotrypa based on the possession of stellapores (clusters of styles) that were not originally described by Bassler (Reference Bassler1929), and the genus remains valid.
Acknowledgments
I am indebted to the late M. Banks and E. Smith (University of Tasmania) who, along with R. Wass, initiated research on the redescription of the six species collected by Charles Darwin. I am especially grateful for the support of M. Banks during my time in Tasmania. The material was collected under Department of Industries, Parks, Water and Environment, Tasmania permits ES08091, ES09194, and ES151203. Thanks to C. Buttler for clarification of the status of Ulrichotrypa and P. Wyse Jackson for comments on a draft version of the manuscript. A. Ernst, H.A. Nakrem, and Associate Editor P. Taylor are thanked for constructive and thoughtful review of the manuscript.