1. Introduction
Poor people are frequently compelled to exploit their surroundings for short-term survival and make up the group most regularly exposed to natural-resource degradation (World Bank, 2002). Natural resources are often of a common-pool resource (CPR) type, which implies problems with overexploitation that sometimes are hard to manage, even in well-developed countries. Fish is a major source of protein for many poor people (United Nations Environment Programme, 2002–2006) and a resource to which the previous discussion applies. Almost half of the world's landings are from tropical waters (Pauly, Reference Pauly1996) and from countries in which development is at a low or medium level. These fisheries are frequently open to access with no restrictions on entry or total catch and regularly lack even rudimentary tools for management, such as landing records. In such poor institutional settings, how individuals act and interact is of utmost importance to whether or not fish stocks can be sustained.
The seminal contribution by Becker (Reference Becker1968) outlined a choice between the legal and the illegal option. The major determinant for this choice is the expected payoff, which, simply put, is a function of the risk of being punished, the expected punishment, and the net profit from violating the law. On the one hand, the management implications from the deterrence model are that monitoring must increase and that penalties must be higher.Footnote 1 On the other hand, it is socially desirable for the enforcement policy to create marginal deterrence,Footnote 2 which rules out the use of severe penalties for relatively mild violations such as fishing a closed area or landing fish below minimum size. If the marginal deterrence effect were to disappear, a criminal engaged in a minor crime might as well commit a more brutal, and more profitable, crime (Persson and Siven, Reference Persson and Siven2007). Monitoring and enforcement of fisheries is costly and accounts for 25–50 per cent of the public expenditures on fisheries (Sutinen and Kuperan, Reference Sutinen and Kuperan1999), which raises doubt as to whether increased monitoring and enforcement leads to social net benefits. Recent research in the social sciences also extends the deterrence model to include normative aspects of complying with the law, such as personal morality and legitimacy (Tyler, Reference Tyler1990; Eisenhauer, Reference Eisenhauer2004). A few empirical studies of fisheries in developed or medium-developed countries have arrived at mixed evidence. Kuperan and Sutinen (Reference Kuperan and Sutinen1998) and Hatcher et al. (Reference Hatcher, Jaffry, Thébaud and Bennett2000) found that compliance depends on both deterrence and normative variables, while Hatcher and Gordon (Reference Hatcher and Gordon2005) only confirmed the deterrence effect. These studies deal with trawl fisheries where the capital input is substantial.
The current paper studies artisan fishers in a poor, developing country. We carry out an empirical analysis of the determinants of regulatory compliance with fishery regulation. Our point of departure is an extended version of the economic model of crime in line with Sutinen and Kuperan (Reference Sutinen and Kuperan1999) and Eisenhauer (Reference Eisenhauer2004), which includes both traditional deterrence variables and normative aspects. Examples of the former are risk of detection and expected gains from violation, while the latter imply exploring potential reasons such as being moral and doing the right thing for following the rules, obeying the rules because of peer pressure from other fishers, perceiving the regulation as legitimate, and perceiving that they (the fishers) have been involved in the regulation process. We use self-reported data from 459 Tanzanian artisanal fishers in Lake Victoria, sampled from 22 landing sites in the three regions Kagera, Mara, and Mwanza around the Tanzanian part of the lake. Our analysis focuses on the minimum-mesh-size regulation, and the data are analyzed in a two-stage approach. In the first stage the whole sample is analyzed. The results indicate three categories of fishers in our sample. In our sample, 45 per cent of the fishers never violate the regulation, which is explained with respect to both deterrence and normative variables. We also identify a small group, 8 per cent of our sample, that persistently violates the mesh regulation. The likelihood of belonging to this group increases with the possession of a motorboat and being from Mwanza, while all deterrence and normative aspects variables are insignificant. As opposed to the previously mentioned groups, the third group of fishers, 47 per cent of our sample, use legal mesh size for some trips while using illegal mesh size for other trips. This middle group of alternating violators is further investigated in the second stage, and we find that both deterrence and normative aspects variables are significant in explaining the frequency of violations in this group as well.
2. Lake Victoria fisheries
Lake Victoria is the world's second largest and Africa's largest freshwater body. Kenya, Uganda, and Tanzania share Lake Victoria; the Tanzanian section encompasses 49 per cent of the lake's surface, while the Ugandan and Kenyan sections encompass 45 and 6 per cent, respectively. The Nile perch was introduced to Lake Victoria in the 1950s and experienced explosive population growth in the 1970s. Its introduction led to increase in landings and a new source of cheap protein while severely reducing biological diversity; the original 350–400 species of fish found in the early 1900s have now been reduced to fewer than 200 (Brundy and Pitcher, Reference Brundy, Pitcher, Pitcher and Hart1995; Kudhongania and Chitamwebwa, Reference Kudhongania, Chitamwebwa, Pitcher and Hart1995). Today there are three commercially important species, namely, Nile perch, Dagaa, and Tilapia, which constitute 60, 20, and 10 per cent, respectively, of Tanzania's total Lake Victoria landings (Ssentongo and Jlhuliya, Reference Ssentongo and Jlhuliya2000). The open-access nature of the lake fisheries combined with rapid population growth, lack of employment opportunities, and the increasing Nile perch market have led to an increasing number of fishers and a depletion of fish stocks (Ikiara, Reference Ikiara1999). This decline concerns one third of the population or about 30 million people supported by the lake basin in Kenya, Tanzania, and Uganda (Lake Victoria Fisheries Organization [LVFO], 1999).
The Nile perch is exported to Europe, Asia, and North America. Processing and export industries were established in Kenya and Uganda during the 1980s and in Tanzania in the early 1990s. Dagaa is to a large extent processed domestically for household consumption and animal feed (fishmeal). Small-scale fishing units generate almost all of the fishing effort on the lake. These fishers use boats or canoes that are fitted with outboard motors or a sail/paddle and hold a total crew of two to six people, including the skipper. Fishers place their nets in the late afternoon and retrieve them in the morning. Dagaa is fished at night when the moon is dark with pressure lamps to attract the fish. Owing to the need for lamps, the choice of Dagaa fishing locations is limited to sheltered environments, that is, the areas fishers can easily reach from their own beaches.
The current regulation requires fishers to pay an annual fee of approximately 20 US dollars, which is equivalent to the gross revenues from one to two days of fishing. Several minor restrictions exist, but the most important is the minimum gillnet-mesh size. For Nile perch and Tilapia the minimum mesh size is 5 inches (125 mm), while it is only 0.4 inches (10 mm) for Dagaa; so there is not a problem with Nile perch and Tilapia being caught as bycatch. There are 63 Tanzanian fishery officers who act as both extension and enforcement officers (LVFO, 2004). These officers carry out lake inspections using patrol boats and landing inspections by random sampling of vessels and landing sites. In case of violation, the catch is confiscated. Fishers may also lose their gear if they are convicted, and they may also be fined.
The focus of this study is on gillnet fishers, who target either Nile perch and Tilapia or Dagaa. As a response to the declining catch per unit of effort, fishers have increased the number of their nets and the use of a mesh of a size smaller than that prescribed. In the short run, a smaller mesh size leads to a larger catch, but the long-run implications are a smaller stock and smaller sustainable landings. Reports of the Tanzanian district fishery offices show that fishers’ compliance with regulations is poor, with the most common violations being the use of an illegal mesh size and beach seine and fishing in closed areas (Wilson, Reference Wilson1993). We are not aware of any up-to-date reports on the prevalence of the violations, but the problem is recognized, and the responsible ministers of the three countries have signed an action plan aiming at eliminating illegal, unreported, and unregulated fishing in Lake Victoria in 2004 (LVFO, 2005).Footnote 3
In 1998, the Tanzanian government, supported by the World Bank, introduced local management units commonly known as beach management units (BMUs), through the Lake Victoria Environmental Management Project. The aim is to enhance community participation in surveillance and management and to put an end to detrimental fishing practices such as using poison or dynamite. The BMU leaders do not have any legal authority but can point out culprits to the enforcement officials. According to the local fishery officers (personal communication John Mahatane, Mwanza Region Fisheries officer, November 5, 2003) the BMUs have been successful in reducing the use of poison and dynamite. A recent study also indicates that they have led to increased efficiency in both Nile perch and Dagaa fisheries (Lokina, Reference Lokina2009), which is possibly explained by fishers exchanging information and learning from each other at the regular BMU meetings.
3. Methodology, model, and data
The original deterrence model by Becker (Reference Becker1968) led to a large number of empirical papers testing the hypothesis, which by and large confirmed the theory (see, e.g., Erlich, Reference Ehrlich1996). Still, some methodological issues have been raised, which according to Manski (Reference Manski and Heineke1978) should be addressed by using survey-collected individual self-reports. Furlong (Reference Furlong1991) applied these ideas to a sample of Canadian fishers, who were found to be most sensitive to changes in the likelihood of detection, and out of various penalties fines appeared to create the greatest deterrence.
The policy conclusions following the approach of Becker (Reference Becker1968) are clear: increased changes in likelihood of detection and increased fines will lead to fewer violations. However, given the weak deterrent threat facing people who commit minor violations, this approach cannot explain why the vast majority of people act in a way consistent with the law (Robinson and Darley, Reference Robinson and Darley1997). One reason for following the rules is to avoid the disapproval of one's social group; another is that one sees oneself as a moral being who wants to do the right thing (Robinson and Darley, Reference Robinson and Darley1997). A third factor is legitimacy, which means that the individual feels that the authority enforcing the law is entitled to dictate behavior. This in turn depends on whether individuals think that the law is fair and applied in a fair manner. Whether legitimacy is maintained or undermined is dependent on people's experiences with legal authorities (Tyler, Reference Tyler1990). The rapidly expanding field of experimental and behavioral economics has also brought attention to what makes management of CPR work. Walker et al. (Reference Walker, Gardner and Ostrom1990) and Ostrom et al. (Reference Ostrom, Walker and Gardner1992) used a CPR experiment to show how the interest of individuals deviates from the social optimal outcome, but if there is a possibility of communication or informal sanctions it strongly improves the prospects for cooperation. Fehr and Gächter (Reference Fehr and Gächter2000a) further established how punishment can improve cooperation, and Fischbacher et al. (Reference Fischbacher, Gächter and Fehr2001) stressed the role of conditional cooperation; i.e., the more they see others contribute, the more the people are willing to contribute themselves to a public good. A recent study holds that reciprocal individuals can discipline the selfish ones, implying less appropriation in CPR problems (Falk et al. Reference Falk, Fischbacher, Fehr, Ostrom, Dietz, Dolsak, Stern, Stonich and Weber2002).Footnote 4 Further, empirical evidence supports the idea that people may follow rules backed by mild sanctions because of norm activation (Tyran and Feld, Reference Tyran and Feld2006).
Enforcement in fisheries has been a fairly neglected area (Sutinen and Hennessey, Reference Sutinen, Hennessey, Miles, Pealy and Stokes1986). The early contributions are theoretical and deal with the optimal stock if nonzero enforcement costs are introduced (Sutinen and Andersen, Reference Sutinen and Andersen1985; Milliman, Reference Milliman1986) and the choice of optimal government policy (Anderson and Lee, Reference Anderson and Lee1986). The first empirical study confirmed the deterrence model, showing that an increased risk of detection and conviction reduces the violation rate in a fishery (Sutinen and Gauvin, Reference Sutinen, Gauvin, Neher, Arnason and Mollet1989). The simple deterrence model predicts that most fishers will violate the regulation. The risk of detection is low; fines are modest; and the profits from violation are substantial. Still, a vast majority of fishers in various fisheries seem to comply with the regulation, which contradicts the predictions based on this model (e.g., Kuperan and Sutinen, Reference Kuperan and Sutinen1998; Eggert and Ellegård, Reference Eggert and Ellergård2003). Extended analysis is therefore necessary to include both the instrumental and the normative perspective. The empirical evidence from such an approach is mixed. Kuperan and Sutinen (Reference Kuperan and Sutinen1998) found that compliance in a Malaysian fishery depended on the tangible gains and losses, as well as the moral development, legitimacy, and behavior of others in the fishery. Hatcher et al. (Reference Hatcher, Jaffry, Thébaud and Bennett2000) reached similar conclusions, while Hatcher and Gordon (Reference Hatcher and Gordon2005) found less evidence in favor of the normative influence on fisher compliance while again confirming the deterrence effect. These studies deal with trawl fisheries where the capital input is substantial, while our study is the first to analyze artisan fishers. The fishers in our sample all have low levels of capital input; i.e., they operate simple open wooden-hulled vessels; almost half of the fishers lack motorboats and have to use sails or paddles to propel their vessels. Our theoretical point of departure is the model by Eisenhauer (Reference Eisenhauer2004), where the neoclassical utilitarian model of individual violation behavior using a concave utility function is extended to include normative and social judgments. Let Y denote wealth obtained from legal behavior and V the sinful wealth, i.e., wealth gained from illegal and immoral behavior. Individuals discount V by a factor δ, which in this monetary context can be seen as a psychic tax rate that the individual places on illicit wealth. The psychic tax rate is assumed to be greater than 0 and less than or equal to 1 and to fit into the relation Y = (1 − δ)V. All individuals experience some level of remorse that lowers the value for them of acquired sinful wealth compared to sin-free wealth Y. For example, if δ = 0.5, a sinful income V = 2 gives the same utility as a legal income Y = 1. For an individual with infinitely small δ, the choice between legal and illegal actions basically fits into the Becker framework. For those with δ = 1, the sinful wealth does not increase utility at all. Expected utility (EU) can then be expressed as (Eisenhauer, Reference Eisenhauer2004)

where p is the probability of detection and F is the penalty, which is assumed to increase with the size of V, i.e., F′ > 0. For a Taylor series expansion around V = 0, the first-order condition is

which can be rearranged to give the individual's optimal level of sinful wealth as

where A(Y) = −U″(Y)/U′(Y) is the Arrow–Pratt measure of absolute risk aversion and σ2 = (1 − p)(1 − d)2 + p(1 − d − F′)2 denotes a variance or risk factor. Hence, if the numerator is zero, the individual will abstain from earning sinful wealth. Further, equation (3) indicates that risk, risk aversion, the public penalty, and private remorse all serve as deterrents to sin (Eisenhauer, Reference Eisenhauer2004). If fishers’ behavior is influenced by perceived legitimacy of regulation, moral obligation to comply, social influence variables, or personal characteristics, these factors will influence the model via δ. We have no prior expectation on personal characteristics, while the other factors are assumed to be positively correlated with δ. If a fisher perceives the regulation as legitimate, feels a moral obligation to comply, or thinks that everybody else is complying with the rules, these factors are expected to reduce the violation rate. Estimates of A(Y) require detailed information about the assets of the respondents and the choice of a functional form of the utility function. We circumvent these potential problems by using estimated risk preferences from a risk experiment that was carried out in a previous round of interviews with the fishers in our sample. Each fisher made choices from pairwise comparisons of hypothetical fishing trips that varied in expected mean and spread of the net revenue. Based on their chosen tradeoffs, they were grouped into three categories, namely, risk-averse, risk-neutral, and risk-seekers, where the risk-averse fishers were the least willing and the risk-seekers were the most willing to accept risks (Eggert and Lokina, Reference Eggert and Lokina2007).
3.1. Econometric specification
The point of departure is that the dependent variable, the number of violating fishing days, is a latent variable that describes the degree to which fishers are in violation of the mesh size regulation. Various specifications have been used in previous studies. The work of Kuperan and Sutinen (Reference Kuperan and Sutinen1998), which has data on the number of violating days, used a tobit model but also divided the sample into non-violators and violators and used a binary probit model. Hatcher and Gordon (Reference Hatcher and Gordon2005) collected violation rate at intervals from 0 to more than 30 per cent over the allowed catch, which led to an ordered model with six ordered intervals. The Tanzanian fishers in our study fish on average 300 days per year. When asked about violation frequency last year, some stated number of days and others number of months, which led us to round off to months. The violation rate is measured as the number of months in which the fisher violated the mesh size regulation. The values therefore range from 0 for non-violators to 12 months for persistent violators. In general we specify our model as

where X is a vector of an observable variable possibly governing V and ɛ is normally distributed with mean 0 and standard deviation σ. Data on V are only observed when V = j for some j in (0, 1, 2), where 0 is for non-violators, 1 for those who violated for 1–10 months (alternating violators), and 2 for those who violated for 11 months or more (persistent violators).
The objective of our approach is twofold. First, we wish to explore why fishers choose to be non-violators or alternating or persistent violators. This is done by using an ordered probit model. Second, we are interested in why fishers may choose to comply with rather than violate the rules and vice versa. It is often found that for any regulation there is a small subgroup of persistent violators (Feldman, Reference Feldman1993), a condition that seems also to exist in fisheries (Kuperan and Sutinen, Reference Kuperan and Sutinen1998). Some of the fishers in our sample never violated the mesh size regulation during the previous 12 months, while some violated it during every trip they made. There was also a small group of fishers who always violated the regulation; i.e., they never carried out fishing trips with only legal gear during the previous 12 months. Those who always obey (violate) the rules may on some occasions be attracted to deviate from their normal behavior but lack the possibility to do so. A simple reason could be that they do not possess the illegal (legal) gear. In the second stage we analyze the middle group, i.e., those who stated that they had actually alternated between legal and illegal acts. This group evolves from self-selected participation, which implies that ordinary least squares estimates would be biased. The bias can be corrected, and we use the generalized Heckman procedure (Heckman, Reference Heckman1979). In the first step, the probability that a given individual fisher will violate the mesh size regulation is determined from an ordered probit model using all available observations in the three categories.
The ordered probit model is


where V* is not observed and V is its observed counterpart; xi is a vector of explanatory variables; μ 1 and μ 2 are threshold parameters (cut points) to be estimated with the β’s; the subscript i is the index of the individual; and the error term u is distributed as standard normal (Greene, Reference Greene2000). The econometric software Limdep uses maximum likelihood estimation, and in order to achieve a unique solution, additional identification constraints, which are that the first threshold is set equal to 0 and the variance is fixed to 1, are necessary (Greene, Reference Greene2002).
For a distribution that is truncated both from above and from below the inverse Mills ratio term is the following (Sabates-Wheeler, Reference Sabates-Wheeler2002):

where X is a vector of regressors related to the violation decision; φ is the standard normal probability density function; and Φ is the standard normal cumulative distribution function.
In the second step, λ is used as an instrument variable in the regression on the subsample of alternating violators to correct for potential bias.
3.2. Survey description and data
The data for this study were collected using a questionnaire during April–June 2003 in the three regions Kagera, Mwanza, and Mara, all bordering Lake Victoria. A total of 459 fishermen were interviewed face-to-face (approximately 160 fishermen from each region), in collaboration with the staff of the Tanzania Fisheries Research Institute (TAFIRI) in Mwanza. Tanzanian fishermen use suitable landing sites that we refer to as beaches. In collaboration with the TAFIRI staff 22 beaches, equally spread in the three regions, with more than 25 active vessels were selected. Between 20 and 25 voluntary fishermen in each of the selected beaches were recruited for the interviews. Hence, we believe that these fishermen are representative of the Tanzanian fishermen around Lake Victoria, noting that fishers from small beaches are absent. The Mwanza region has a higher population than the other two regions and probably more fishermen, indicating that they may be under-represented in our sample. The fishers in the sample were previously interviewed in September–October 2002 and in January–February, 2003 for other studies (Eggert and Lokina, Reference Eggert and Lokina2007; Lokina, Reference Lokina2009). These fishermen were all skippers and decision-makers of a fishing vessel and did not receive any payment for their participation. The questionnaire was administered in face-to-face interviews with vessel skippers with an assurance of individual anonymity and confidentiality. Consideration was taken in the design of the questionnaire to maximize the likelihood of honest responses, in particular regarding questions about the fishers’ own violation behavior. The questionnaire was administered in collaboration with the TAFIRI staff.Footnote 5 A pilot survey was conducted on three landing sites, i.e., beaches that were not in the sample, followed by revisions and minor changes. The respondents were asked about their own violation rates during the last 12-month period and gave answers such as ‘zero’, ‘fifteen days’, ‘two to three months’, or ‘twelve months’. Hence, the number of days on which the regulation was violated for each fisherman is not exactly known. We identified three subgroups, namely, those who never violated during the last 12 months, those who always violated, and those who carried out both trips on which they used the legal mesh and trips on which they used illegal mesh size. We label these groups non-violators, alternating violators, and persistent violators, with 0, 1–10 months, and 11 months or more of violation, respectively. The average number of total fishing days was 300 for each group, and basically all fishers in the sample did some fishing in each of at least 11 out of the 12 months previous to the interview. Some seasonality exists in terms of varying average catch per unit effort between the three time periods, but the average numbers of fishing days per month are always in the interval of 23–26 days for all three groups. Zero violation means that the respondent has not committed violations for the past 12 months; 1 month means that in the past 12 months he committed violations in only 1 month; and so on.
Interviews that were of 60 min were carried out individually and included questions on respondent attitudes and perceptions about the legitimacy of mesh size regulation, social pressures to comply, attitudes toward violation, and feelings of obligation to comply.Footnote 6 Questions related to legitimacy concerned the perceived effectiveness and fairness of mesh size regulations, the legitimacy of management institutions, and the involvement of fishers in management. These questions were statements for which the respondents ranked their level of agreement on a four-digit scale, where a higher score means stronger agreement. Socioeconomic characteristics of the fisher were recorded either directly, (e.g., age and experience as a skipper, household size) or, where appropriate, using an interval scale; e.g., household income was recorded using the latter to minimize the concern of confidentiality and accuracy. We also included questions related to the subjective probability of detection, arrest, and conviction. Respondents were asked to report their own compliance behaviors as well as their perceptions of the compliance behavior of other fishers at the same beach. Further, questions related to the level of fishers’ involvement in policy formulation and enforcement were asked. Self-reports may imply a risk of biased data, especially as respondents were asked about their own illegal activities, but the overall impression was that the fishers were cooperative and generous with their answers, including their own violations. Many of the fishers found it hard to assess the potential magnitude of penalties in the case of conviction, which led to the exclusion of that question, while all of them stated an opinion about whether applied penalties fit the offense or not.
4. Results
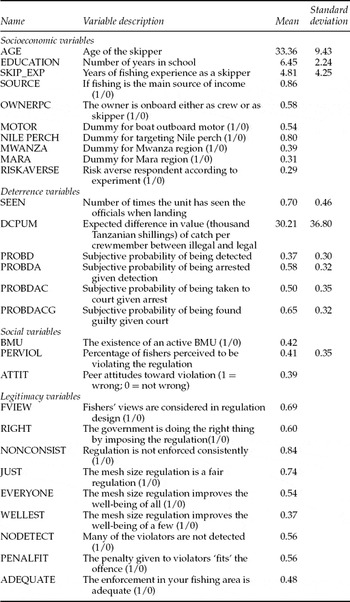
The descriptive statistics are reported in table 1. For the analysis we used Limdep. The sample consists of 459 fishers of whom 45 per cent are non-violators, 47 per cent alternating violators, and 8 per cent persistent violators. The overall violation rate is 29 per cent, which is substantially higher than the rate reported in previous studies (see Kuperan and Sutinen, Reference Kuperan and Sutinen1998), and the persistent violators are responsible for almost one third of the violations.Footnote 7
Descriptive statistics of variables included in the estimations

The deterrence variables include aspects such as the expected gain per unit effort from violating, how often the officials have been seen, a dummy for previous arrest, and the respondent's subjective judgment of the probability of detection, of arrest, of being taken to court, and of being found guilty. The probabilities are increasing, which is intuitive; those who are more likely to be convicted are more likely to be brought through the legal procedures. The probability of being taken to court is an exception and is lower than that of being arrested. This is the stage at which bribes are most likely to occur, and it may be that the respondents have adjusted for the use of bribes. If we disregard the effects of bribes, the average perceived overall probability of being detected and punished is 7 per cent, which is substantially larger than the ‘below 1 percent, and often at or near zero’ value found in previous studies (Kuperan and Sutinen, Reference Kuperan and Sutinen1998). The social and legitimacy variables were all measured by a four-digit scale. However, in the final analysis these answers were recoded as dummy variables with levels three and four being 1 and levels one and two being 0, where 1 indicates that the fisher agrees with the statement. The correlation between all of the used variables was estimated but did not exceed 0.54.
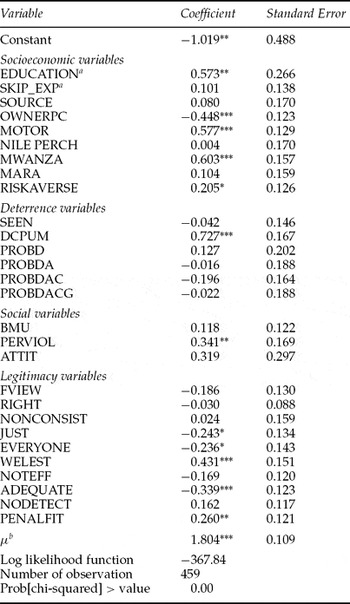
The results of the first-stage ordered probit model are presented in table 2. Here the whole sample is analyzed, and the dependent variables are 0, 1, and 2, representing non-violators, alternating violators, and persistent violators. Limdep normalizes the first threshold to 0, meaning that the reported μ is the second threshold (Greene, Reference Greene2002). The significant value of μ indicates that the two cut points are significant and that the three categories in the response are ordered (Liao, Reference Liao1994). In the model, the dependent variable is an ordered rank of violation frequency, where non-violation has a rank of zero, 1–10 months of violation a rank of 1, and 11 months or more during the last 12-month period a rank of 2.Footnote 8 Many of the variables are statistically significant, and significant variables, i.e., socioeconomic, deterrence, social, and legitimacy variables, can be found in all of the four variable subgroups.
Ordered probit probability of the violation category model

*, **, ***Significance at the 10 per cent, 5 per cent, and 1 per cent levels, respectively.
aVariable scaled by a factor 0.1.
bLimdep normalized the first threshold, μ 0, to zero, and the reported value is μ 1. The significant value indicates that the data are ordered.
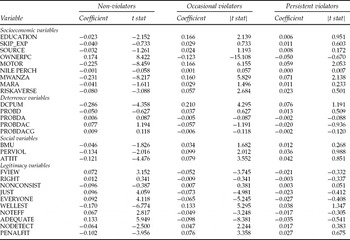
In table 3 we report the marginal effects for all the variables, which measure the increased (decreased) probability for the fisher to be in the violation category, given one more unit of the explanatory variable with the other variables held at their mean. Our focus is on the statistically significant variables. For the binary variables, the interpretation is the increase (decrease) in probability if the binary variable is equal to 1. For example, the marginal value for non-violation for education is −0.023, which indicates that the probability of a fisher being a non-violator will decrease by 2 per cent for every extra year of schooling he gets. The probability of being in the group of persistent violators is higher if the fisher possesses a motorboat and is from the Mwanza region. Otherwise, explanatory variables are not significant for this group. Whether a fisher always obeys the regulations is significantly indicated by a number of variables. More education, being from Mwanza, and possession of an outboard motor imply a reduced probability of always obeying the law, while having the owner onboard a vessel supports non-violation. Among the deterrence variables, DCPUM is significant, which indicates that if the expected gains between legal and illegal behavior are increasing, then more non-violators are likely to become alternating violators. To our surprise we found that the risk-averse fishers are likely to belong to the violators. Eggert and Lokina (Reference Eggert and Lokina2007) found that risk-averse fishers have limited assets, use boats without motors, and earn lower income than other fishers in Lake Victoria. However, their risk-averse preferences were elicited from choices between alternatives, which all entailed positive net revenues. Kahneman and Tversky (Reference Kahneman and Tversky1979) and Tversky and Kahneman (Reference Tversky and Kahneman1992) suggested a value function that is concave for gains, convex for losses, and steeper for losses than for gains. If our risk-averse fishers are living close to the subsistence level and struggle to make ends meet, their choice is potentially made in the loss region in the sense that a poor catch is below subsistence level. The implication would be that these poor risk-averse fishers are in fact risk-seeking and choose the riskier violating behavior that is – in case of success – more profitable.
Marginal effects of variables in the violations model

Several of the social and legitimacy variables are significant, indicating that these variables have an impact on the decision to be a non-violator or to break the rules. The significant variable PERVIOL indicates that the higher the perceived percentage of violating fishers, the lower the probability of the fisher remaining a non-violator. Similarly, if fishers think that mesh size regulation improves the well-being of a few well-established fishers (WELLEST), they are likely to be alternating violators. If the mesh size regulation is seen as a fair regulation (JUST) and the enforcement in their fishing area is adequate (ADEQUATE), fishers are likely to be non-violators. The PENALFIT variable has an unexpected significant positive sign for alternating violators, indicating that fishers who believe that the penalty fits the offense are more prone to break the rule. The study of Malaysian trawl fishers provides a similar result, where violators thought that the government was right in imposing a regulation and that the enforcement was adequate. Kuperan and Sutinen (Reference Kuperan and Sutinen1998) suggested that weak enforcement combined with high social and moral compliance increases the marginal value of violation, which explains why violators are in favor of the measures. The parallel with the Tanzanian fishers is that the violators enjoy better returns from violating when not all fishers violate because of a suitable penalty. Adding to this can be that non-violators think that the penalties are too low, while violators think they are low enough to make violation profitable. We have no follow-up questions on these issues, and as noted earlier, many fishers found it hard to assess penalties in the case of conviction.
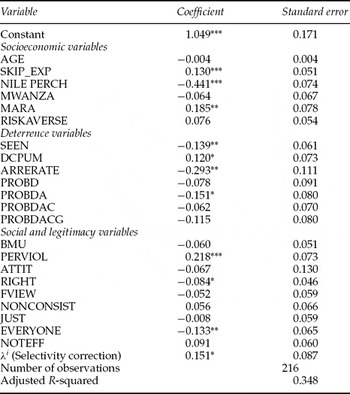
In table 4 we report the results of the corrected least square estimation of the violation rate for the alternating violators, where the dependent variable is the number of months the rules were violated during the last 12 months. There is evidence that participation is positively selected, since lambda (λ) is positive and statistically significant, which is now being adjusted for. From the socioeconomic variables we see that fishers from the Mara region or with longer skipper experience tend to violate more. It is notable that while target species had no influence on being a non-violator or a violator, it is a significant variable among alternating violators. Those who target Nile perch violate to a lesser extent, which is probably due to the fact that Nile perch fishers supply the fish processing factories, and these factories request a fish size corresponding to the legal mesh size of 5 inches or more. Thus, if a fisher targets Nile perch, the market requirements reduce the probability of this fisher violating the regulation by 0.44 units compared with the others.
Least squares estimates of violations model for alternating violators

*, **, ***Significance at the 10 per cent, 5 per cent, and 1 per cent levels, respectively.
Notes: λ is the inverse Mills ratio and also the hazard function for the distribution. The standard textbook examples usually refer to truncation from below or above, where λ = −ϕ/Φ and λ = ϕ/[1 − Φ] respectively (Greene, Reference Greene2000). When the distribution is truncated from above and below, the inverse Mills ratio is as stated in equation (5), λ = ϕ1 − ϕ2/[Φ2 − Φ1] (Sabates-Wheeler, Reference Sabates-Wheeler2002).
For the deterrence variables, the difference between illegal and legal mesh size values of catch per crewmember effort (DCPUM) is still significant in explaining the violation decision. The variable SEEN was insignificant for the whole sample, but alternating violators respond by reducing their violation rate as often as they see officials. According to the ARRERATEFootnote 9 variable, fishers who have experienced higher arrest rates tend to violate less. All four of the subjective probabilities now have the expected negative sign. However, only PROBDA is statistically significant at the 10 per cent level. The probability of being taken to court after being arrested (PROBDAC) is not at all significant, and according to the fishers it is at this stage you avoid punishment by offering bribes. All of the 459 fishers in the sample had experience of being arrested and 40 per cent of them had used bribes to avoid being taken to court. In fact, 23 per cent of those who had not violated the regulation during the last 12 months had used bribes when being arrested to avoid the problems of being taken to court, even though they were innocent. Almost all of the persistent violators, 93 per cent, avoided being taken to court when arrested by the use of bribes. Hence, for these fishers the perceived punishment F in equation (3) is rather substituted by a bribe, which presumably is lower than F. At the same time we note that the majority, 65 per cent, among the non-violators and alternating violators did not use bribes.
When it comes to social and legitimacy variables, their influence on the violation rate seems reduced compared with their importance for the decision of whether a fisher would be a non-violator or would violate the regulation. Those who do, in fact, violate are still influenced by the perceived violation rate among their colleagues; if they think many others violate, the probability to violate is high (PERVIOL). Similarly, they tend to comply if they think that the government is doing the right thing by imposing the regulation design (RIGHT) and if they believe that the regulation benefits all fishers (EVERYONE).
A fundamental question to address is whether the deterrence or the social and legitimacy variables can be excluded. If we look at the adjusted R 2 excluding deterrence and social and legitimacy variables, the full model is reduced from 0.35 to 0.28 and 0.23, respectively. We further explore this issue using the F-statistics comparing various regressions. The null hypothesis that all social and legitimacy variables are 0 can be rejected at the 1 per cent level of significance (4.090, critical level 2.47), and similarly the null hypothesis that all deterrence variables are 0 can be rejected at the 1 per cent level (6.532, 2.64). Hence, we conclude that both deterrence and social and legitimacy variables are vital in explaining the behavior of the alternating violators.
5. Policy implications and conclusions
This analysis of the Tanzanian Lake Victoria fishers’ compliance gives support to the traditional economics of crime model. The results also show that the extension of the basic deterrence model, which includes moral development, legitimacy, and considerations regarding the behavior of others in the fishery, leads to a richer model with substantially higher explanatory power. In a second-stage analysis, we focus on the middle group, i.e., the occasional violators, and find that the moral and legitimacy variables have less impact on their decision regarding violation rate compared with the influence of these variables on being a non-violator. Still, the normative variables are significant in explaining the violation rate for this middle group. Our interpretation is that once you have broken the rules, moral and legitimacy factors are less important in influencing the decision to violating.
This study is, as far as we know, the first on compliance among artisan fishers in a poor, developing country. Self-reported data may suffer from inaccuracy, and for Tanzanian fisheries it is hard to find data to cross-check validity. We found a perceived fraction of violators of 41 per cent, while Kuperan and Sutinen (Reference Kuperan and Sutinen1998) had 39 per cent; the corresponding figures based on their stated violation were 55 and 75 per cent, respectively. Hatcher and Gordon (Reference Hatcher and Gordon2005) did not report perceived violation but stated that violation was prevalent among 80 per cent out of the 70 fishermen used in their sample. Hence, the proportion of violating fishermen was lower in our sample, while they more accurately predicted fraction of violators. Another potential problem in a study like this is that of self-serving bias when measuring attitudes and opinions, by asking individuals and having them provide answers to motivate their actual behavior. The fishers in this study were generous with their answers, even the answers concerning their own violation rates. For the fishers concerned with their reputations or self-images, reducing the stated violation rate instead of trying to find arguments for violation in the legitimacy and moral variables seems more plausible. For those who are non-violators, the incentive to, for instance, state that fishers’ views are taken into account to defend that they are obeying the rules seems even weaker; in the case of strategic answers we would rather expect to find insignificant variables. Unfortunately, we could not find any data from the authorities on violation rates to cross-validate the reported violation rates, which could have been an indicator of misrepresentation in the data. In the Lake Victoria fisheries, as indicated also by previous studies on fishery compliance, there is a small group of persistent violators. These fishers seem to have found that constant violation is the most beneficial strategy irrespective of deterrence variables or legitimacy and social variables. Whether the fishers have undertaken any particular evasion investments is unknown, but in principal they always use the illegal mesh size and use bribes to reduce or escape from penalties. Successful fishery management requires that the loophole for systematic violations in terms of bribes be closed. However, this is more easily said than done. According to the TI Corruption Perceptions Index 2004 of Transparency International (2004), 60 countries scored less than 3 out of 10, indicating rampant corruption. One such country was Tanzania, with an estimated value of 2.8 and a confidence range of 2.4–3.2, securing the 90th place out of 146. The frequent use of bribes was also confirmed by our study; all of the respondents had experienced arrest, and 40 per cent had used bribes to avoid being taken to court. In fact, in the group of non-violating fishers, 23 per cent used bribes to avoid the bother of court proceedings and the risk of being convicted despite being innocent. Given the fact that all fishers had experienced arrest, the high perceived overall probability of being punished (7 per cent) and the existing corruption indicate that inspection officers’ personal gain from bribes may even reinforce the arresting frequency. How to handle corruption is beyond the scope of this study, but the general policy recommendation is to increase the individual firms’ ability to commit to non-bribery, which can be supported through disseminating information about corrupt practices and recognizing those who are doing the right thing by resisting corruption (Svensson, Reference Svensson2003). One critique of the deterrence model is that fishers comply with the regulation to a larger extent than predicted by the model. Such a critique does not apply to this fishery. The proportion of violators was lower in this study, but owing to high frequency of violation among violators, the overall violation rate of 29 per cent is higher than previously found in developed and newly industrialized countries. There are two potential explanations as we see it. First, Tanzanian fishers are poorer than their previously studied counterparts and cannot afford moral and legitimacy concerns to the same extent. Second, the ubiquitous level of corruption most probably has a negative impact on compliance. When even a fisher who obeys the rules is arrested and must use bribes to avoid being taken to court, we expect that this may increase ‘his willingness to commit an illegal act’. A future extension of this study would be to more explicitly model a social bribery game between fishers and inspection officers.Footnote 10
Compliance with the minimum mesh size does not solve the overcapitalization problem that follows from the open-access regime, but given that the minimum is large enough, female fish will be able to reproduce at least once, and the stock will not fall below a viable minimum level (Townsend, Reference Townsend1986). If all fishers start to use the small mesh size, there is an increasing risk that female fish will be caught even before reaching sexual maturity, leading to a complete stock collapse (Clark, Reference Clark1990). The local BMUs, which have been initiated to enhance community participation in surveillance and management, have according to the inspection officers been successful in putting an end to the use of poison and dynamite. Concerning compliance with the mesh size regulation that we studied, the results indicate that the BMUs do not have an impact on fishers’ decisions of being non-violators, i.e., always obeying the mesh size regulation. Development of the BMUs and the understanding of the importance of conserving the juvenile fish seem to be low-cost management options. Combined with increased deterrence activity, they may even contribute to more sustainable fishing practices in Lake Victoria.