NOMENCLATURE
 $A$
design parameter of Leaky integration filter
-
$h$
element of force transfer function matrix
-
${\rm{K}}$
gain of h
-
${\rm{L}}$
aerodynamic reference length
-
${\rm{M}}$
mach number
-
$p,z$
pole and zero of h, respectively
-
${q_\infty }$
free stream dynamic pressure
-
$s$
Laplace variable
-
${\textrm{V}}$
freestream airspeed
-
$k$
reduced frequency
-
$ {[ D ],[ E ] [ {{P_1}} ],[ {{P_2}} ],[ {{P_3}} ]}$
Minimum-state approximation coefficient matrices
-
$ {[ G ]}$
MIMO force controller matrix
-
$ {[ {{G_c}} ],[ {{G_m}} ]}$
spline matrix from concentrated force points to doublet center of pressure points and from measurement points to aerodynamic to doublet control points
-
$ {[ H ]}$
force transfer function matrix
-
$ {[ M ],[ K ]}$
mass and stiffness matrix
-
$ {[ Q ]}$
reduced AIC matrix
-
$ {[ R ]}$
aerodynamic lag matrix
-
$\{ f \}$
applied force
-
$\{ \,{{f_a}} \},\{ \,{{f_e}} \}$
applied force by airflow and external source, respectively
-
$\{ u \}$
voltage input vector
-
$\{ x \}$
structural displacement vector
-
$\{ {{x_h}} \},\{ {{x_l}} \}$
Structural displacement vector on doublet center of pressure points and control points, respectively
-
$\{ {{x_c}} \},\{ {{x_m}} \}$
structural displacement vector on concentrated force points and measurement points
-
$\{ {{z_s}} \}$
aerodynamic augmented state vector





Abbreviations
- AIC
Aerodynamic influence coefficient
- AR
Aspect ratio
- DDLA
Direct-drive-linear-actuator
- DHM
Doublet-hybrid method
- EFT
Emulated flutter test
- FE
Finite element
- FFT
Fast Fourier transform
- FRF
Frequency response function
- FTF
Force transfer function
- GVT
Ground vibration test
- HPF
High-pass filter
- IR
Infra-red
- LDS
Laser displacement sensor
- LIF
Leaky integration filter
- LPF
Low-pass filter
- LVDT
Linear variable differential transformers
- MAC
Modal assurance criteria
- MIMO
Multi-input-multi-output
- MSA
Minimum-state approximation
- ODS
Operating deflection shape
- SGF
Savitzky-Golay filter
1.0 INTRODUCTION
Flutter is a dynamic instability phenomenon that could happen on the flexible, elastic structure moving in the air(Reference Hodges1,2) . Being one of the most dangerous phenomenon that could cause a catastrophic failure, the aeroelastic flutter needs to be fully examined by analysis or experiment to ensure that this dynamic instability will never happen within the flight envelope of the vehicle.Traditionally, two main test techniques namely wind-tunnel(Reference Amato, Polsinelli, Cestino and Frulla3) and flight flutter test(Reference Burnett, Beranek, Holm-Hansen, Atkinson and Flick4–Reference Kayran6) have been utilized to experimentally identify the flutter boundary, even though many limitations and difficulties of those techniques exist.
To overcome limited test condition of traditional techniques, a new flutter test technique that utilizes ground vibration test (GVT) set-up has been recently proposed(Reference Zeng, Kingsbury, Ritz, Chen, Lee and Mignolet7). The key idea is based on the principle of aeroelasticity, which is the interaction between structural displacement and the unsteady aerodynamic force. The artificial aerodynamic force is calculated from the measured structural response data, and then generated using multiple number of controlled point-loading actuators. This allows a direct use of the GVT set-up that already exists for the other vibration test purpose. This concept was first proposed by ZONA technology in 2011(Reference Zeng, Kingsbury, Ritz, Chen, Lee and Mignolet7), and there have been two more follow-up research works by the other institute(Reference Wu, Ma and Yang8,Reference Wu, Zhang, Ma and Yang9) .
In the first research work by Zeng et al.(Reference Zeng, Kingsbury, Ritz, Chen, Lee and Mignolet7), they proposed the emulated flutter test concept and then performed a validation work on clamped aluminum plate structures, plain plate, and small-mass added plate to show the robustness of their technique. They used linear variable differential transformers (LVDT), contact type displacement sensors for the structural response sensing, and four medium size electro-mechanical shakers. They only reported the flutter boundary of the test structure, without mentioning flutter mode shapes or behaviors of structures on the point other than the flutter boundary. Wu et al. performed two follow-up research works on the emulated flutter test technique, by applying it to linear(Reference Wu, Ma and Yang8) and nonlinear(Reference Wu, Zhang, Ma and Yang9) flutter emulation tests. They made an important progress in actuator and sensor placement strategy and force control scheme. They used an aluminum plate and a root-fixed fin as linear and nonlinear structures, respectively. However, their validation was focused on flutter boundary only, as in Zeng’s work; there was no validation of their flutter mode shape, and dynamic behaviors were investigated only on the flutter point(Reference Wu, Ma and Yang8) or near the flutter point(Reference Wu, Zhang, Ma and Yang9).
The pioneers of the technique claimed that the major advantages of the technique is that it can overcome the limitations in the wind-tunnel; test section size and airspeed range(Reference Zeng, Kingsbury, Ritz, Chen, Lee and Mignolet7). At the same time, there can be a criticism that any emulated flutter test (EFT), which is essentially based on a certain aerodynamic modeling, cannot completely replace the actual test, since the uncertainty in aeroelastic test is often from the aerodynamic part. This criticism is persuasive when we consider the current state of the art of the real-time aerodynamic model. However, if the aerodynamic model used in EFT is getting more advanced and accurate, the discrepancy between aerodynamic model and the real aerodynamic forces can be reduced, too. Meanwhile, EFT can be useful; it can be cheaper, quicker and more reproducible test technique. At the same time, since it can employ a real structural hardware, uncertainties associated with structural modeling or down-scaling can be excluded. Thanks to these advantages of the EFT it is still meaningful to further improve the technique even though what it can do at its best is the reproduction of the flutter analysis result.
In this regard, the primary goal of this research is to develop a more compact and genuine GVT based flutter emulation technique, and to show the validity of the technique through cross comparison among several experimental results and analytical prediction: emulated flutter test using displacement, emulated flutter test using accelerometers, wind tunnel test, and analytical flutter prediction. Doublet hybrid method (DHM) was utilized for the emulation of the subsonic unsteady aerodynamic force on a 2-dimensional structure. Unlike previous flutter emulation studies, we also obtained flutter mode shapes, and the damping variations with the dynamics pressure increment. The test module based not only on displacement sensors, but also on accelerometers has been developed in this work.
2.0 THEORETICAL BACKGROUNDS
The general equation of motion of undamped structure is given as:
 \begin{align}\left[ M \right]\{ \ddot x(t)\} + \left[ K \right]\{ x(t)\} = \left\{\, {f(t)} \right\}\end{align}
where  $\left[ M \right],\left[ K \right]$
are mass and stiffness matrices, respectively,
 $\left\{ x \right\}$
is structural displacement vector, and
 $\left\{ f \right\}$
is the applied force.
There is mutual interactions among the inertia, elastic, and aerodynamic forces. When a structure deforms under aerodynamic load, the displacement changes the distribution of the airflow, which in turn changes the displacement again(Reference Hodges1). The aerodynamic force, right-hand-side of Equation (1), is expressed as(2):
 \begin{align}\left\{\, {f(t)} \right\} = \left\{\, {{f_a}\left( {\left\{ {x(t)} \right\}} \right)} \right\} + \left\{\, {{f_e}(t)} \right\}\end{align}
where  $\left\{\, {{f_a}} \right\}$
is aerodynamic force and
 $\left\{\, {{f_e}} \right\}$
is external force rather than the aerodynamic force.
2.1 Concept of ground flutter emulation
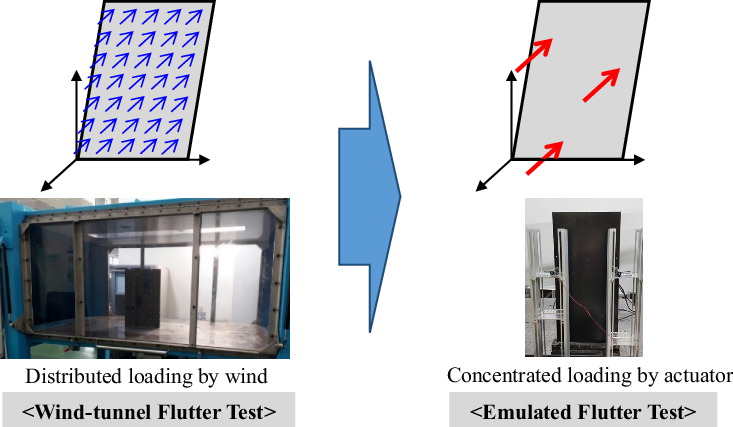
The basic idea of flutter emulation, as proposed in the previous work by Zeng et al.(Reference Zeng, Kingsbury, Ritz, Chen, Lee and Mignolet7), is to emulate an aerodynamic force by calculating several concentrated forces that are equivalent to the distributed aerodynamic force (Fig. 1). In other words, it is the replacement of a source loading from the air to point-loading actuators, with the help of mathematical aerodynamic model and spline matrix.
Concept of emulated flutter testing.
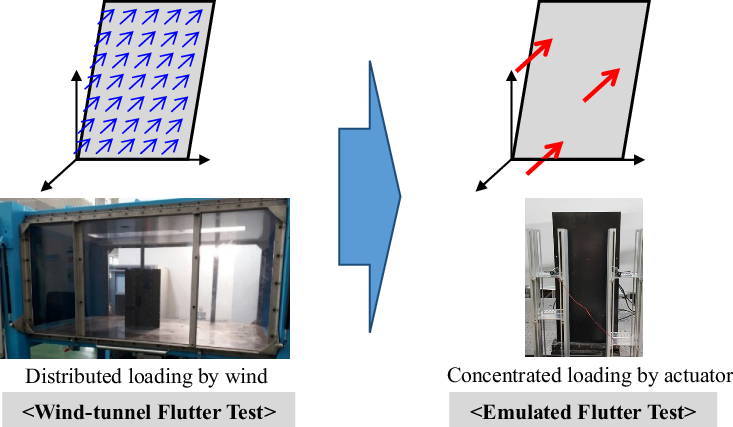
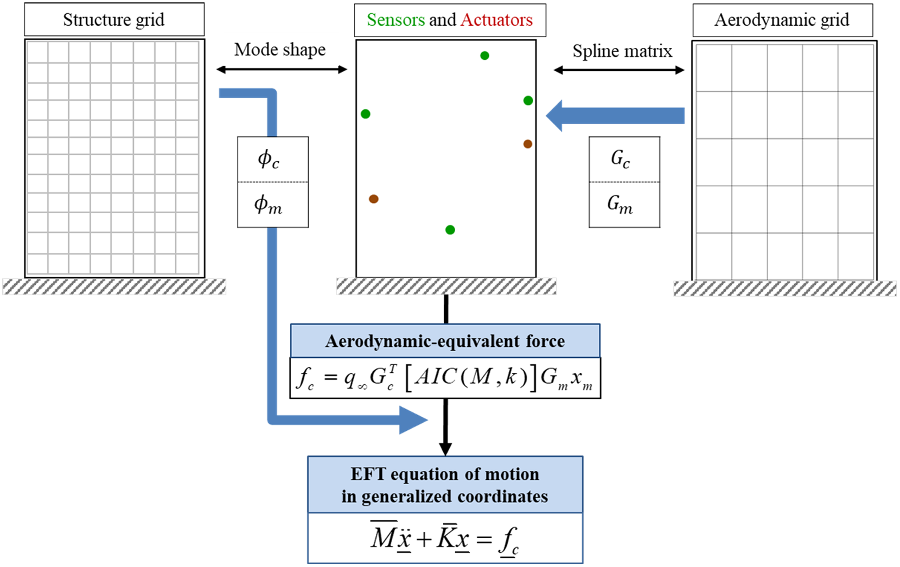
Thus, the process to obtain the emulated aerodynamic force involves calculating the distributed aerodynamic force corresponding to the structural response first, and then reducing it to the concentrated point forces. For this purpose, a spline matrix is used for the transformation between the two different grids, and the matrix is obtained using the infinite-plate surface spline method(Reference Harder and Desmarais10). The spline matrices transformed the displacement vector from the sensor and actuator points to the aerodynamic center of pressure point and control point of doublet as:
 \begin{align}\left\{ {{x_h}} \right\} = \left[ {{G_c}} \right]\left\{ {{x_c}} \right\}\end{align}
 \begin{align}\left\{ {{x_l}} \right\} = \left[ {{G_m}} \right]\left\{ {{x_m}} \right\}\end{align}
where,  $\left\{ {{x_h}} \right\}\!,\,\left\{ {{x_l}} \right\}$
are displacement vectors at the doublet center of pressure point and control point respectively,
 $\left\{ {{x_c}} \right\}\!,\,\left\{ {{x_m}} \right\}$
are displacement vectors at the concentrated force and measurement points respectively,
 $\left[ {{G_c}} \right]$
is a spline matrix from concentrated force points to doublet center of pressure points and
 $\left[ {{G_m}} \right]$
is a spline matrix from measurement points to doublet control points.
In this paper, the aerodynamically equivalent concentrated force is defined as the force that do the same work as the distributed aerodynamic force(11). Therefore, the virtual work principle is:
 \begin{align}{\left\{\Delta {{x_h}} \right\}^T} \cdot \left\{\, {{f_a}} \right\} = {\left\{\Delta {{x_c}} \right\}^T} \cdot \left\{ \,{{f_c}} \right\}\end{align}
where the symbol  $\Delta $
is to represent virtual quantity.
Substituting the transpose of Equation (3) into Equation (5) leads to:
 \begin{align}& {\left\{\Delta {{x_c}} \right\}^T}{\left[ {{G_c}} \right]^T} \cdot \left\{\, {{f_a}} \right\} = {\left\{ \Delta{{x_c}} \right\}^T} \cdot \left\{\, {{f_c}} \right\} \nonumber\\[4pt]& {\left\{\Delta {{x_c}} \right\}^T} \cdot \left( {\left\{\, {{f_c}} \right\} - {{\left[ {{G_c}} \right]}^T}\left\{\, {{f_a}} \right\}} \right) = 0 \end{align}
Therefore, the aerodynamically equivalent concentrated force is derived as:
 \begin{align}\left\{\, {{f_c}} \right\} = {\left[ {{G_c}} \right]^T}\left\{\, {{f_a}} \right\}\end{align}
To calculate the original, distributed unsteady aerodynamic force, structural displacement measurement data alongside with an aerodynamic model are required to perform the calculation. The aerodynamic model, used in this paper is the doublet-hybrid method (DHM)(Reference Eversman and Pitt12). DHM is applied to obtain the subsonic aerodynamic influence coefficient (AIC) matrix, which relates structural displacement on the aerodynamic grid to the subsonic unsteady aerodynamic force as:
 \begin{equation}\{\, {f_a}(t)\} = {q_\infty }\left[ {AIC({\rm{M}},k)} \right]\left\{ {{x_l}(t)} \right\}\end{equation}
where M is Mach number, k is a reduced frequency to non-dimensionalize the frequency  ${\rm{\omega }}$
(
 $k = \raise0.7ex\hbox{${L\omega }$} \!\mathord{\left/{\vphantom {{L\omega } V}}\right.\kern-\nulldelimiterspace \!\lower0.7ex\hbox{$V$}})$
and
 ${q_\infty }$
is freestream dynamic pressure.
Combining Equations (4), (7) and (8), the equation that relates structural response measured at the sensor points to the concentrated force points is obtained as:
 \begin{align}\left\{\, {{f_c}(t)} \right\} = {q_\infty }{\left[ {{G_c}} \right]^T} \cdot \left[ {AIC({\rm{M}},k)} \right] \cdot \left[ {{G_m}} \right]\left\{ {{x_m}(t)} \right\}\end{align}
where the reduced AIC matrix or Q matrix is defined as:
 \begin{align}\left[ {Q({\rm{M}},k)} \right] = {\left[ {{G_c}} \right]^T} \cdot \left[ {AIC({\rm{M}},k)} \right] \cdot \left[ {{G_m}} \right]\end{align}
The concept and procedure to derive the governing equation of the aerodynamically equivalent force described in this section, and the generalized equation of motion for the emulated flutter analysis is summarized in Fig. 2.
Procedure to obtain aerodynamically equivalent force.

For clear understanding in this paper, an aeroelastic flutter by distributed aerodynamic force is referred as the ‘original’ flutter, whereas a flutter due to the a few concentrated forces that emulate aerodynamic force is called as the ‘emulated’ flutter.
2.2 Formulation of governing equation
To fully formulate the governing equation in time domain, the Q matrix in Equation (10) obtained only at the discrete tabulated reduced frequency values should be extended to the continuous variables. Among the several ways to approximate the matrix in the continuous Laplace domain, Karpel’s minimum-state approximation (MSA) method(Reference Karpel and Hoadley13) is considered as the most efficient one. Applying the MSA method, together with m-augmented states, the aerodynamic force matrix is expressed in the Laplace domain as:
 \begin{align}[Q(s)] \cong \frac{{{L^2}}}{{{V^2}}}[{P_1}]{s^2} + \frac{L}{V}[{P_2}]s + [{P_3}] + \frac{L}{V}[D]{\left( {\frac{L}{V}s[I] - [R]} \right)^{ - 1}}[E]s\end{align}
where  $\left[ {{P_1}} \right],\left[ {{P_2}} \right],\left[ {{P_3}} \right],\left[ D \right]$
and
 $\left[ E \right]$
are coefficient matrices;
 $\left[ R \right]$
is the aerodynamic lag matrix; s is Laplace variable and V is freestream airspeed.
Substituting Equation (11) to the Laplace transform of Equation (9) to obtain:
 \begin{align}\{ {F_c}(s)\} = {q_\infty }\left( {\frac{{{L^2}}}{{{V^2}}}[{P_1}]{s^2} + \frac{L}{V}[{P_2}]s + [{P_3}] + \frac{L}{V}[D]{{\left( {\frac{L}{V}s[I] - [R]} \right)}^{ - 1}}[E]s} \right)\left\{ {{X_m}(s)} \right\}\end{align}
where  $\left\{ {{F_c}\left( s \right)} \right\}$
and
 $\left\{ {{X_m}\left( s \right)} \right\}$
are Laplace transform of
 $\left\{\, {{f_c}\left( t \right)} \right\}$
and
 $\left\{ {{x_m}\left( t \right)} \right\}$
, respectively.
Inverse Laplace transform of Equation (12) gives a time-domain equation of the aerodynamically equivalent concentrated forces. To do this, the augmented state variable  $\left\{ {{Z_s}} \right\}$
is introduced.
 \begin{align}\{ {Z_s}(s)\} = \frac{L}{V}{\left( {\frac{L}{V}s[I] - [R]} \right)^{ - 1}}[E]s\left\{ {{X_m}(s)} \right\}\end{align}
Substituting Equation (9) to Equation (8), and taking inverse-Laplace transform of both equations lead to a state-space equation for real-time aerodynamically equivalent force calculation as follows.
 \begin{equation}\left\{ \begin{array}{l}\{ {{\dot z}_s}(t)\} = \frac{V}{L}[R]\{ {z_s}(t)\} + \left[ \begin{array}{lll}0&{\left[ E \right]}&0\end{array} \right]\left\{ \begin{array}{l}{{{\ddot x}_m}(t)}\\[2pt] {{{\dot x}_m}(t)}\\[2pt] {{x_m}(t)}\end{array} \right\}\\[4pt] \{\, {f_c}(t)\} = {q_\infty }[D]\{ {z_s}(t)\} + {q_\infty }\left[ \begin{array}{ccc}{\frac{{{L^2}}}{{{V^2}}}[{P_1}]}&{\frac{L}{V}[{P_2}]}&{[{P_3}]}\end{array} \right]\left\{ \begin{array}{c}{{{\ddot x}_m}(t)}\\[2pt] {{{\dot x}_m}(t)}\\[2pt] {{x_m}(t)}\end{array} \right\}\end{array} \right. \end{equation}
By applying this calculated aerodynamically equivalent concentrated force to the test structure through the controlled actuators, an aeroelastic system closed-feedback loop would be fully formulated.
Referring to the governing Equation (14), either laser displacement sensor (LDS) or accelerometer can be used as a sensor for the EFT. For the LDS to be applied, the sensor signal is to be numerically differentiated, whereas for the accelerometer the sensor signal should be integrated. The details of the different kinds of issues encountered in each case, will be addressed in the later section of this paper.
3.0 TEST MODULE DEVELOPMENT
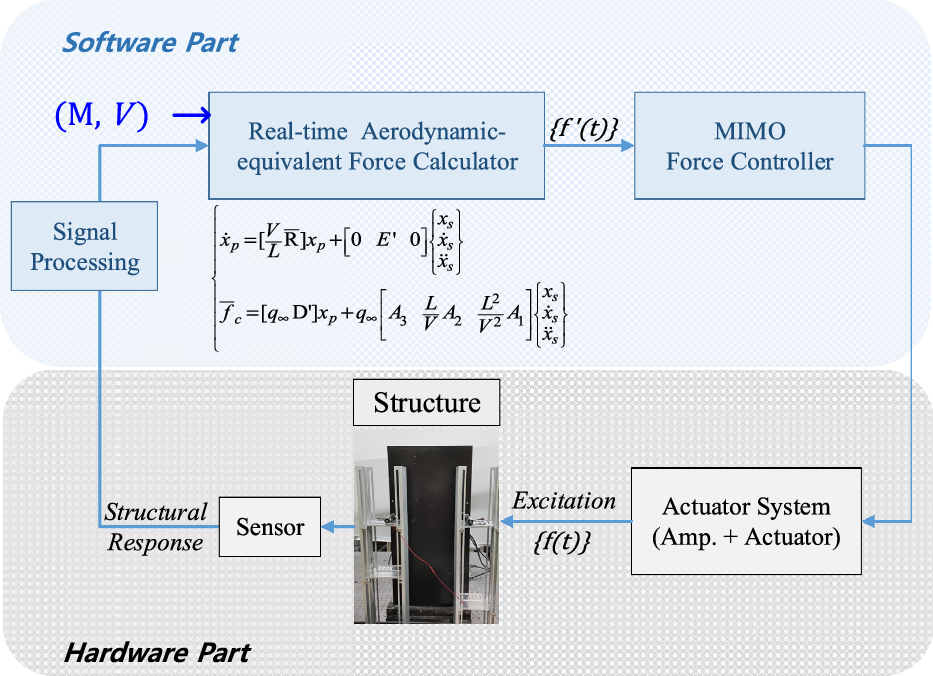
The primary goal of the experimental EFT module is to emulate the aerodynamic force. The module is composed of two parts; one is the software part that is in charge of calculation, and the other, a hardware part, is in charge of physical action. In this section, development of each part is presented.
As can be observed in Fig. 3, one important feature of the module is that it can imitate the flight condition by input the Mach number and the airspeed value by the user.
Configuration of EFT module.

3.1 Target structure
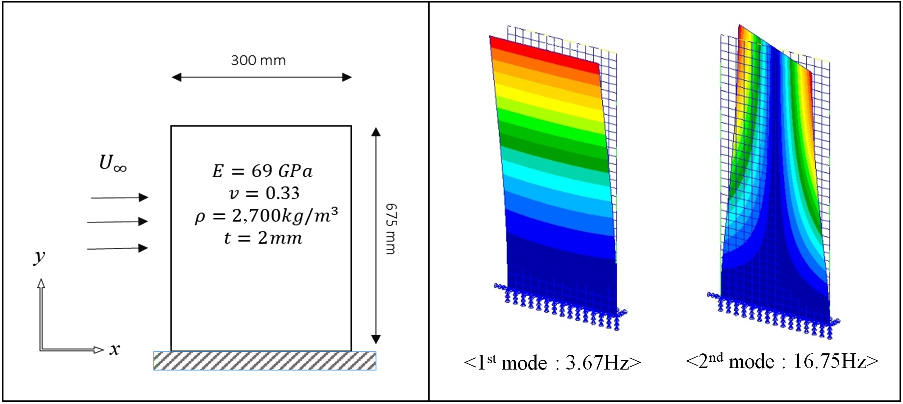
In this work, an aluminum plate with clamped-edge boundary condition was chosen as a target structure for the flutter emulation technique development. Specifications of the designed structure is shown in the left part of Fig. 4. Natural frequency and mode shape of the structure were obtained by the finite element (FE) modal analysis using Patran (MSC. Software, USA).
As expected, the structure has typical bending and torsion modes for the first two modes. Torsion mode is in exactly symmetrical shape with respect to the center-chord line.
3.2 Determination of sensor and actuator configuration
In designing the hardware part of the EFT module, the number and locations of the sensors and the actuators should be properly determined(Reference Kailash and Han14); it is also important to minimize the number of devices (sensors and actuators) while keeping the accuracy of the resulting emulated flutter boundary compares to the original flutter. For each given number of devices, their location were optimized in this study, and then an emulated flutter analysis in frequency domain using p-k method(Reference Hassig15) was performed to calculate the flutter boundary. Here, the location optimization strategy(Reference Wu, Ma and Yang8) was used to minimize the mode shape recovery error in Equation (15).
 \begin{align}\min (f) = \left\| {\left[ {{\phi _{aero}}} \right] - \left[ {{\phi _{device}}} \right]} \right\| \cdot \{ \eta \} \end{align}
where  $\left[ \phi \right]$
is mode shape matrix,
 $\left\{ \eta \right\}$
is vector of mode weighting factor and subscript device stands for either sensor or actuator, and aero stands for aerodynamic grid.
Target structure specification (left), first two structure modes (right).

Since the first two modes are critical in flutter, $\{ \eta \} $
is set to
 $\{ \eta \} = {\{ 1,1\} ^T}$
.
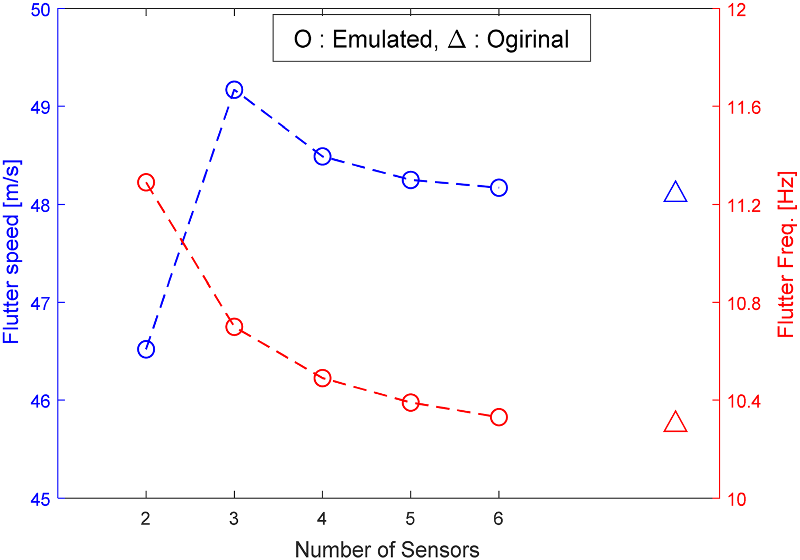
Referring to the first two mode shapes of the target structure, it was clear that at least two actuators are required, since two different kinds of mode shapes contributed to the flutter. Therefore, flutter boundary of the two-actuator-EFT-module was investigated while increasing the number of sensors. The plot in Fig. 5 shows the trend in flutter boundary accuracy as the number of sensors increase. For every case, the flutter boundary was identified by the K-method(2).
Flutter emulation accuracy with increasing number of sensors.

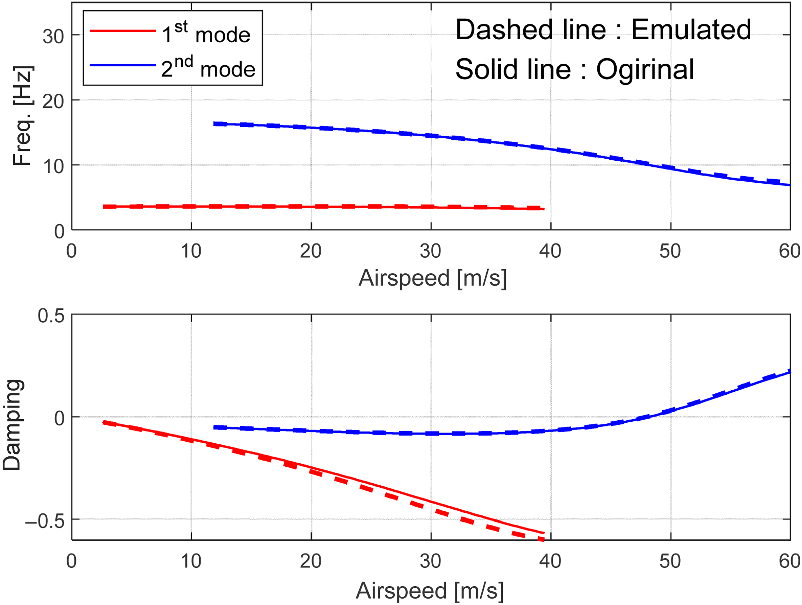
From the plot, if more than four sensors are utilized then the accuracy in flutter boundary is saturated enough towards the original case with an error of about 0.8% and 1.8% in flutter speed and frequency, respectively (Fig. 6). Therefore, the experimental module for the EFT is determined to have two actuators and four sensors. The determination of the locations will be presented in the later section of this paper.
Analysis result comparison: Original flutter and Emulated flutter by two-actuator and four-sensor.

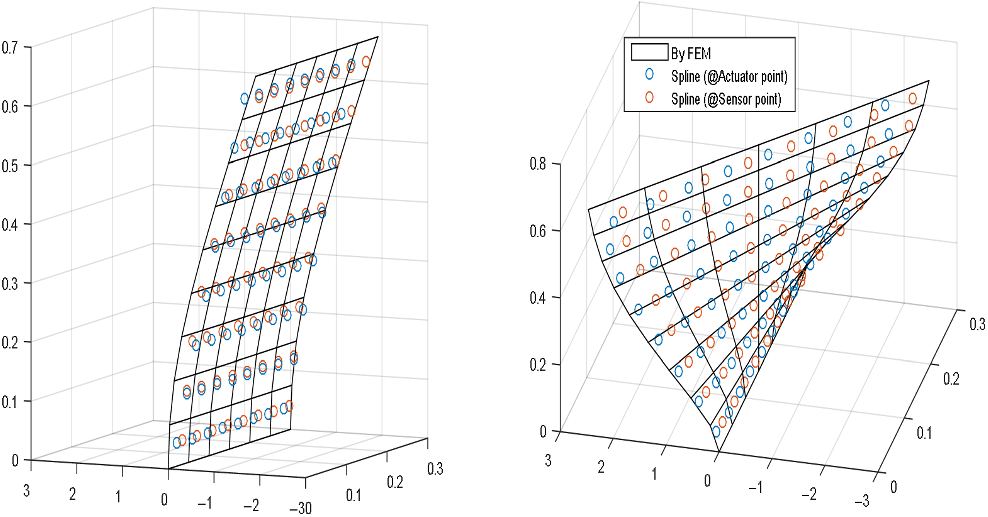
To support the validity of the designed configuration of devices, the recovered mode shapes based on the determined actuators ( $\left[ {{G_c} \cdot {\phi _{actuator}}} \right]$
) and sensors (
 $\left[ {{G_m} \cdot {\phi _{sensor}}} \right]$
) configurations are compared to the original FE mode shape on the aerodynamic grids (
 $\left[ {{\phi _{aero}}} \right]$
) in Fig. 7. In the figure, the black-edge grid plane represents original mode shape using FE analysis, whereas blue-edge circles and orange-edge circles are representing recovered mode shape by actuators and sensors, respectively.
Mode shape recovery comparison: 1st mode (left), 2nd mode (right).

3.3 Aerodynamically equivalent force calculator
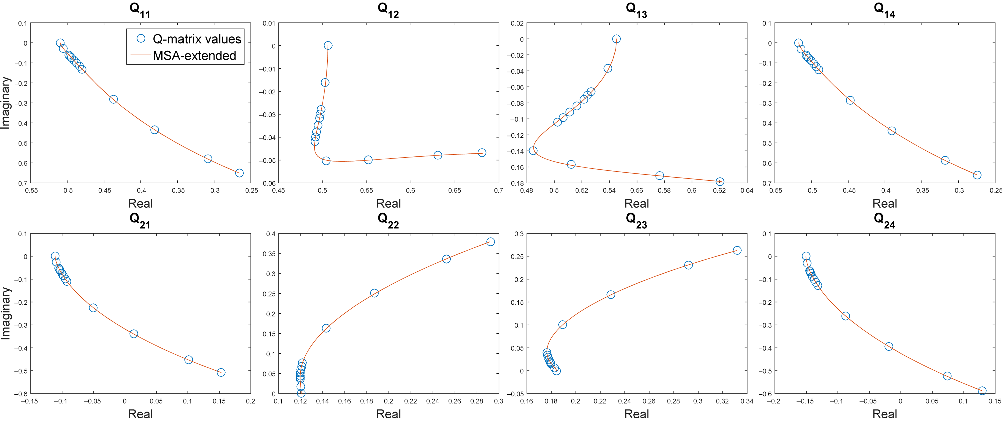
The Equation (14) is integrated in real time to obtain the emulated aerodynamic force; this module is called the aerodynamically equivalent force calculator. It receives structural response signal and manual airspeed input from the user, and using the fourth-order Runge-Kutta method(Reference Atkinson16), it calculates the emulated aerodynamic forces. To fully formulate Equation (14), the MSA matrices for extending the discrete-valued Q matrices (Equation (10)), that are obtained at the designed actuator and sensor locations, to continuous domain (Equation (9)) are required. Six augmented states were used for the extension. The curve-fitting result shown in Fig. 8 are validating the obtained MSA matrices. The output of this part is an input of MIMO force controller.
Validation curves of minimum-state-approximated Q matrix.

3.4 MIMO Force controller
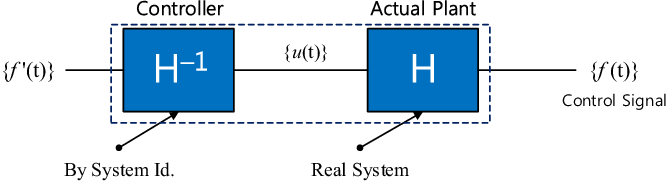
Multiple excitation forces by the actuators interact with each other to make the force control to a trickier MIMO control problem. Fortunately, since not only the structure but also the electro-dynamic type of actuator(Reference Lang and Snyder17) applied in this paper are linear, the whole system can be considered as a linear time invariant (LTI) system. For an LTI case, one of the easiest way to control the coupled MIMO system is to utilize the inverse of its transfer function. The basic idea is to eliminate the control plant by using the inverse of its mathematical model as shown in Fig. 9.
In this case, the actuator force transfer function (FTF) relates the actuator amplifier input voltage to the actuator force output. Taking two-actuator system as an example, the mathematical expression is given in a simple way as:
 \begin{equation}\underline f = \left\{ \begin{array}{l}{f_1}\\[2pt] {f_2}\end{array} \right\} = H\underline u = \left[ {\begin{array}{c@{\quad}c}{{H_{11}}}&{{H_{12}}}\\[2pt]{{H_{21}}}&{{H_{22}}}\end{array}} \right]\left\{ \begin{array}{l}{u_1}\\[2pt] {u_2}\end{array} \right\}\end{equation}
where  ${f_i}$
is force by i-th actuator,
 $\left[ {\rm{H}} \right]$
is FTF matrix,
 ${u_i}$
is voltage input to the i-th actuator.
Concept of inverse transfer function based control.

By inputting frequency-sweep voltage signal to each of the actuators, a two-by-two FTF matrix data can be obtained. From Equation (16), the inverse transfer function based controller  $\left[ {G(s)} \right]$
is obtained as below.
 \begin{align}\left[ {G(s)} \right] = {\left[ {H(s)} \right]^{ - 1}} = \frac{1}{{{H_{11}}(s){H_{22}}(s) - {H_{21}}(s){H_{12}}(s)}}\left[ {\begin{array}{c@{\quad}c}{{H_{22}}(s)}&{ - {H_{12}}(s)}\\[2pt] { - {H_{21}}(s)}&{{H_{11}}(s)}\end{array}} \right]\end{align}
Each element of FTF matrix is expressed in a Laplace domain with the rational fractional form as:
 \begin{align}h(s) = K \cdot \frac{{\prod\limits_j {(s - {z_j})(s - z_j^*)} }}{{\prod\limits_i {(s - {p_i})(s - p_i^*)} }}\end{align}
where  ${\rm{K}}$
is gain,
 $p$
and
 $z$
are representing pole and zero respectively, and superscript asterisk represents conjugate pair.
Using system identification method(Reference Ljung18), the mathematical model of the FTF was obtained through curve-fitting the measured frequency response function (FRF) data to Equation (18). To obtain the FRF, input voltage and output force signal in time domain were transformed to frequency domain by Fast Fourier Transform (FFT). The two-by-two FTF matrix identification result is shown in Fig. 10.
Actuator system FTF matrix identification result, in [5, 15]Hz range.

For simpler dynamics, the frequency range to be identified was set to [5, 15]Hz to help avoid the 1st and 2nd structural modes but the range still contains the flutter frequency. The identification result in Fig. 10 shows that the obtained FTF model accurately fits to the measured data, in both magnitude and phase. Therefore, the designed controller could guarantee accurate control performance in the specified frequency range.
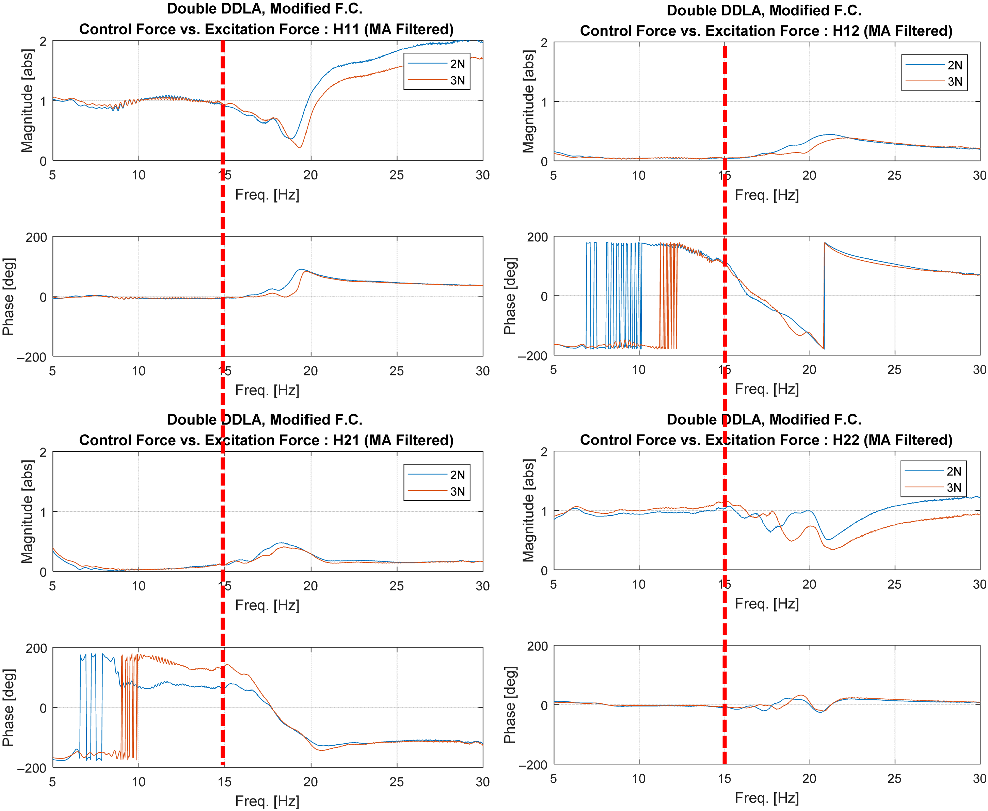
For the designed MIMO force controller from Equation (17), validation test in both frequency and time domain was performed. A frequency-sweep signal was input to the actuators as a command force signal. If the controller is working accurately, the two-by-two FRF matrix, obtained by command forces and excitation forces, should have unity-magnitude and zero-phase angle on the diagonal elements, and zero-magnitude on the off-diagonal elements, in the designed frequency range. As indicated in the Fig. 11, the designed force controller works in a very accurate sense within the specified frequency range, [5, 15]Hz.
Force controller validation test result in frequency domain.

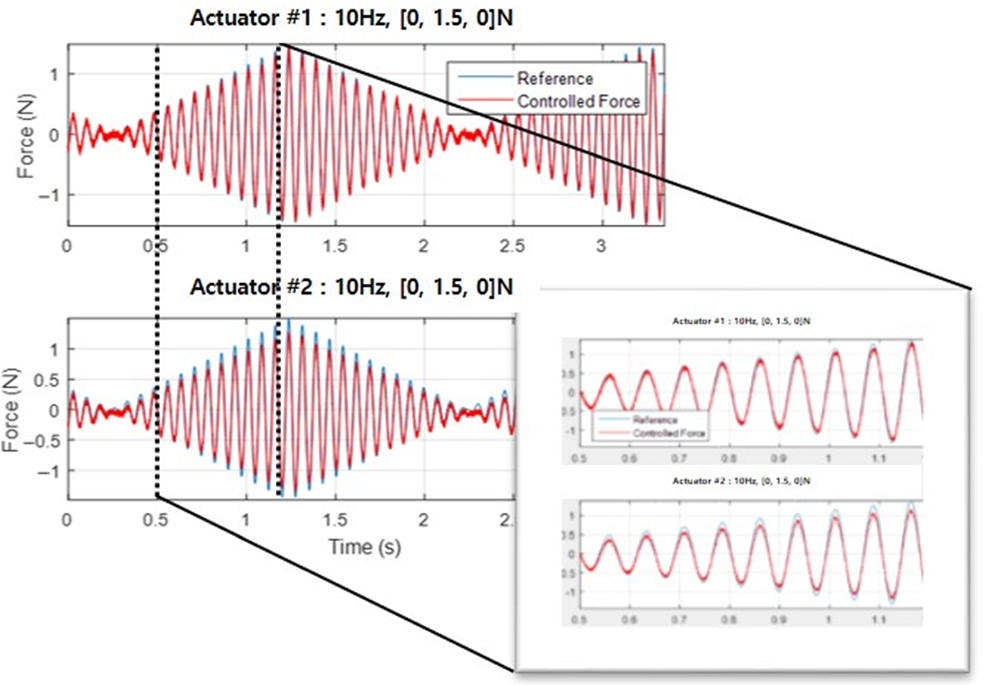
Further validation test has been made to make sure that the designed controller also works for the magnitude-varying signal, which mimics the flutter onset situation.
An identical command force signal of 10Hz, with magnitude increase from 0 to 1.5N, and then decrease to 0N again, was input to the both actuator. The resulting plot in Fig. 12 shows a good control performance of the force controller for such command.
3.5 Signal processing of structural response
The measurement of the signal by either LDS or accelerometer requires differentiation or integration since the aerodynamically equivalent force calculation requires structural response in displacement, velocity and acceleration. Therefore, the signal processing is an essential part in the EFT module development yet it is missing in all of the previous EFT studies.
First of all, both LDS and accelerometer signal are processed by low-pass filter (LPF) and a high-pass filter (HPF), to remove the dc offset and noise of the raw signal. Afterwards, the signals underwent numerical differentiation or integration, which is described in the following subsections.
3.5.1 Numerical differentiation
Numerical differentiation is applied to the EFT-LDS module. For the numerical time differentiation, Savitzky-Golay filter(SGF)(Reference Savitzky and Golay19) was chosen because of its low-pass filtering characteristics, together with its differentiation ability. The working principle of the filter is to curve-fit a defined number of data set to the polynomial equation first, and then get the analytical differentiation of it. The critical advantage of this filter upon the typical two-point time differentiation filter is that it does not exaggerate the signal noise. The design parameter of the filter is in the order of polynomial equation to fit, and sample window size (odd-numbered).
For each of the 1st and 2nd time derivative, SGF designed with design parameters are set to (1, 119) and (2, 121), respectively. The polynomial order and window size is kept as small as possible since it is reported that the cut-off frequency decreases as the order of approximated polynomial and window sample size decreases(Reference Schafer20).
Numerical differentiation and integration Filter design parameters

Force controller validation test on magnitude-varying force signal.

3.5.2 Numerical integration
Numerical integration is applied to the EFT-Accelerometer module. The most important and inherent problem of numerical integration is the signal drift. This is because of the low frequency (less than 1Hz) component magnification characteristics of the integration filter. In this paper, Leaky integration filter(LIF)(Reference Eliasmith and Anderson21) was chosen for numerical time integration in order to keep the drift as small as possible. It has a characteristic of finite output magnitude at 0Hz, in contrast to the typical two-point integration filter such as trapezoidal integrator. This feature is easily figured out by the transfer function of it in Laplace domain:
 \begin{align}LIF\left( s \right) = \frac{1}{{s + A}}\end{align}
where A is a LIF design parameter.
The bigger value of parameter A was more beneficial in the drift attenuation, but it induces larger phase delay, which would result in an inaccurate flutter emulation. Therefore, the value of A was kept small and additional HPF was introduced to attenuate drift.
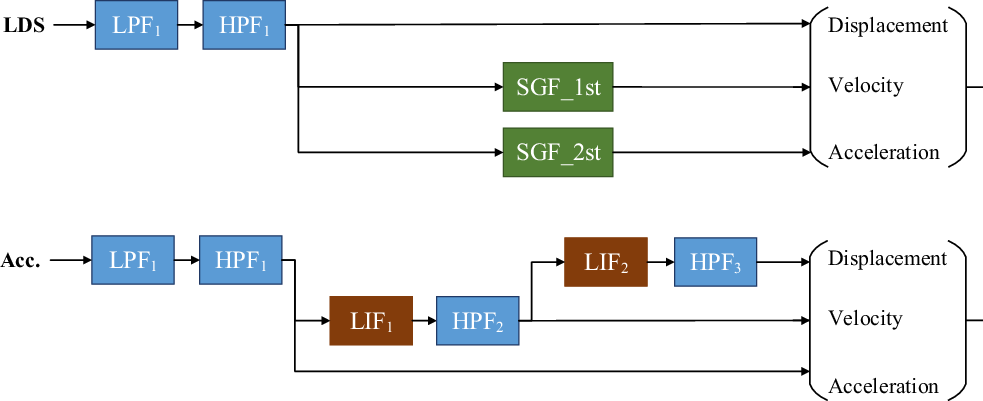
Overall filter configuration of differentiation and integration is given in block diagram in Fig. 13. They are designed with the parameters given in Table 1. All the LPF and HPF used are first-order filter with a single design parameter of the cut-off frequency.
Filter configuration for numerical differentiation (upper), for numerical integration (lower).

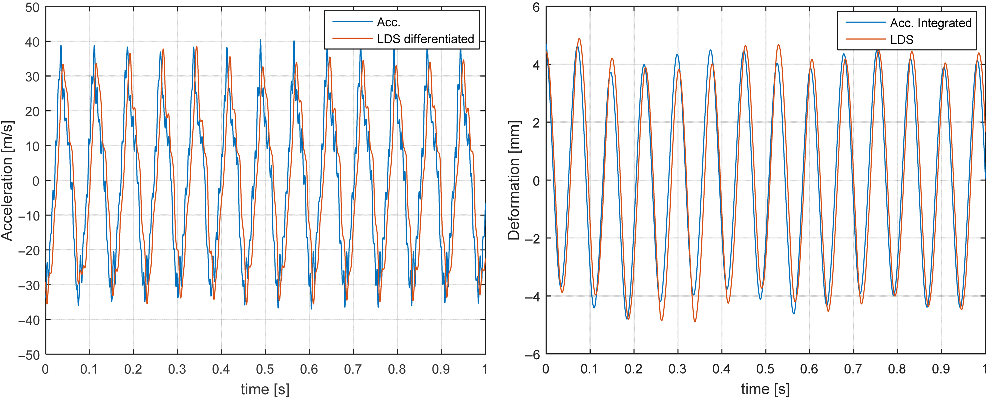
To check the designed filter performance, the displacement and acceleration at one point on the target structure was measured by LDS and accelerometer at the same time. Displacement and acceleration obtained by the filter and the direct measurement data were compared. In Fig. 14, it is shown that both differentiation and integration filters are work accurately in magnitude and phase, at about 10Hz.
Filter validation test result: Numerical differentiation (left) and integration (right).

4.0 TEST MODULE SET-UP
4.1 Applied actuator type
In this paper, a DDLA was applied as an actuator instead of typical electro-dynamic shakers in the previous studies. It is a practical choice since DDLA is cheaper, more compact, and has simpler dynamic characteristics than the electro-dynamic shaker.
Given that both actuators are operated in the same working principle, which is electro-magnetic force principle, the critical difference between DDLA and electro-dynamic shaker is that the DDLA does not have a mechanical connecting part between moving shaft and magnetic base. This would lead to a smaller excitation force limit, but a great advantage in that it has less degree of freedom and lesser interference between the actuators. This makes the design of MIMO force controller job much simpler.
4.2 Hardware configuration
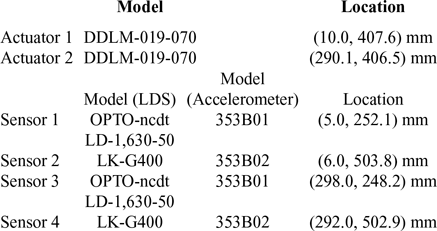
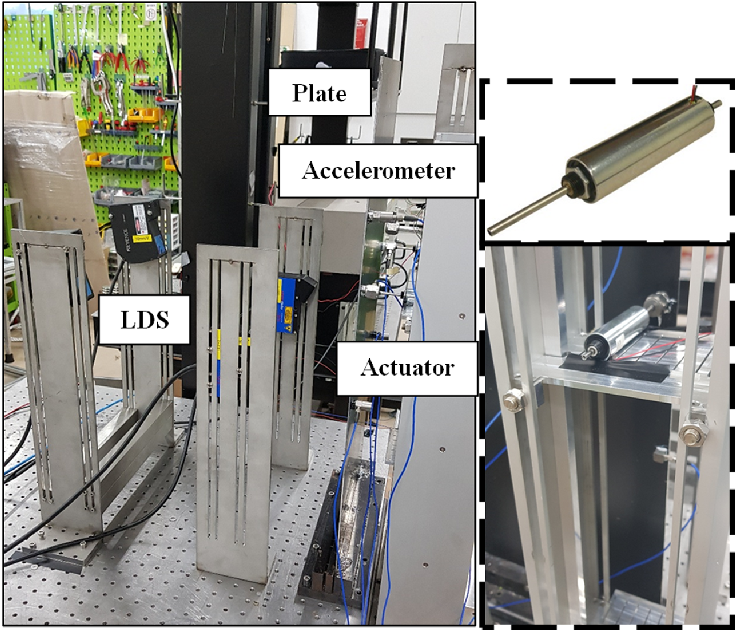
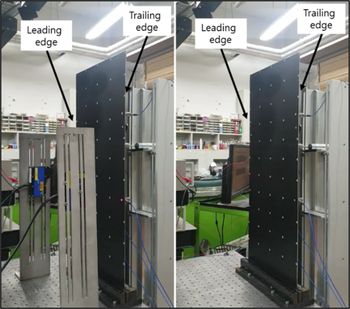
All the information of devices in the two types of EFT modules, such as the locations and the model of the applied actuator and sensors are given in Table 2. The LDS and accelerometers were installed to measure the responses at the same 2-dimensional locations, but on the opposite side of the plate (Fig. 15).
Summary of applied devices in the two EFT modules

Two EFT module set-up (left), DDLA (right).

The two identical DDLAs are from Moticont, USA, and among the four LDSs, two are from Keyence Corp. Japan and two other are from Micro-Epsilon, Germany. The accelerometers are all from PCB Piezotronics, USA.
For all the software modules developed, the aerodynamically equivalent force calculator, MIMO force controller and signal filters, were implemented in the DAQ board with 10kHz of sampling frequency. DAQ board used is MicroLabBox (DS1202, dSPACE), featured by 32-analog input channels with 16-bit resolution (equal to 0.305mV), 1 Msps speed, and 16-analog output channels with the same specifications as the input channel. Among the several data communication interfaces, Ethernet real-time I/O interface (low latency Gigabit) was been utilized. For the excitation force sensing, two units of single-axis force sensor model 208C02 by PCB Piezotronics, USA, were used.
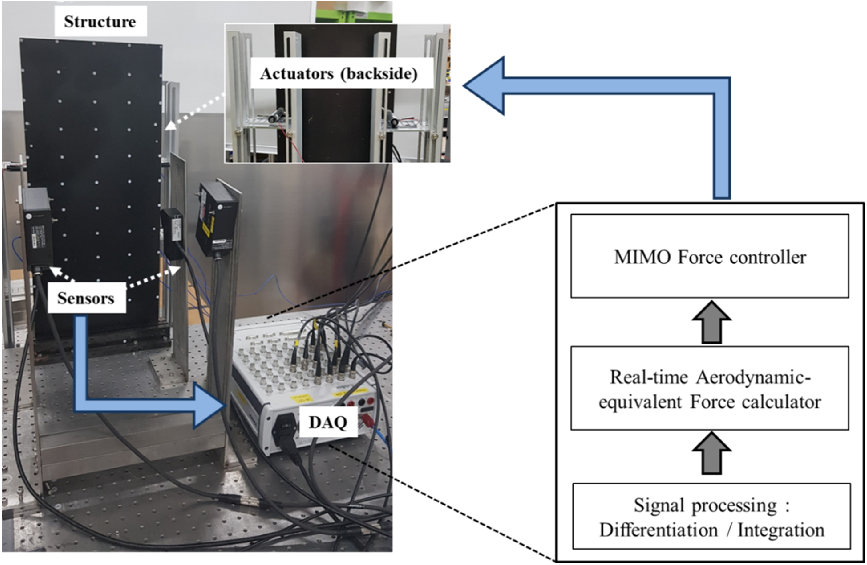
The EFT module was installed in the experiment room as shown in Figs 15 and 16. The overall data flow of the test module is shown in Fig. 17.
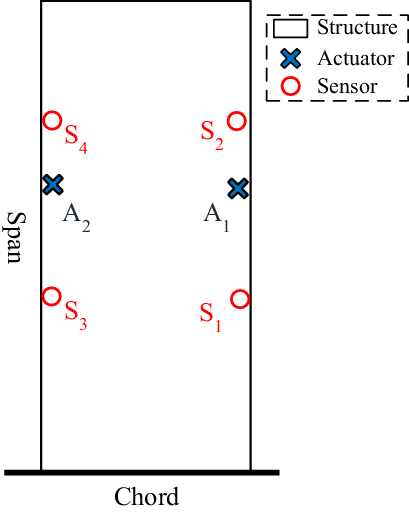
Actuator and sensor locations; A ~ actuator, S ~ sensor.

Data flow of EFT module.

5.0 EXPERIMENTAL WORKS
To validate the two EFT modules developed (Fig. 18), the flutter test results from each of the modules and wind-tunnel are compared. For both EFT and wind-tunnel flutter tests, the methodology and corresponding results are presented.
EFT test set-up by LDS(left), and Accelerometer (right).

5.1 Methodology
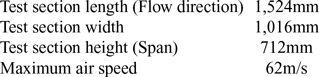
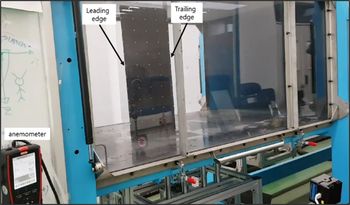
For the wind-tunnel flutter test, the subsonic wind-tunnel in KAIST, with specifications summarized in Table 3, was utilized. The target structure was installed in the middle of the wind-tunnel test section as shown in Fig. 19. As in typical wind-tunnel test, the experiment was performed by gradually increasing the airspeed of the wind-tunnel.
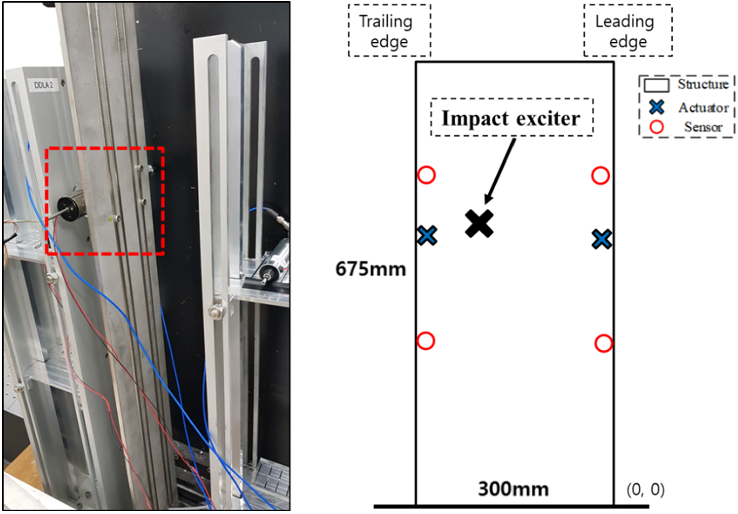
For the EFT, since the module is capable of varying the airspeed value, the flutter test was performed with increasing airspeed as in the wind-tunnel test. With the airspeed value fixed, an additional actuator for the impact excitation was utilized, as shown in Fig. 20, to introduce an initial disturbance to the aeroelastic system closed-loop. The dynamic stability of the system is judged by observing whether it can cancel out the disturbance or not.
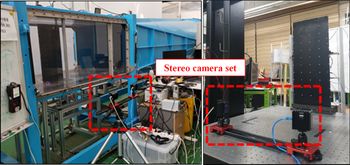
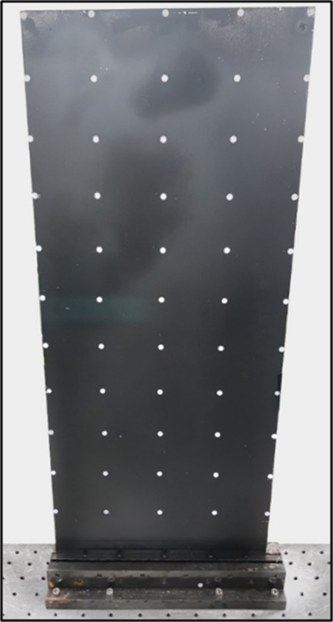
To capture the mode shape in both wind-tunnel flutter test and EFT, a stereo camera set (Prime 13W, 2 EA, from NaturalPoint, USA) was utilized(Reference Yun, Kim, Han, Kim and Kwon22), as shown in Fig. 21. Stereo image recorded by the two cameras were processed to generate 3-dimensional positions of the object. The stereo image frame rate, which is a displacement measurement sampling frequency, was 240Hz. The Infra-Red (IR) light reflective marker points are attached on the fifty-five predetermined locations on the plate to help reconstruct a deformation shape as shown in Fig. 22.
Wind-tunnel specifications

Flutter boundary by original and emulated flutter experiment

Wind-tunnel flutter test set-up.

Additional impact exciter (left), and its location (right).

Stereo camera set-up for deformation shape measurement; in wind-tunnel (left), EFT (right).

5.2 Flutter boundary
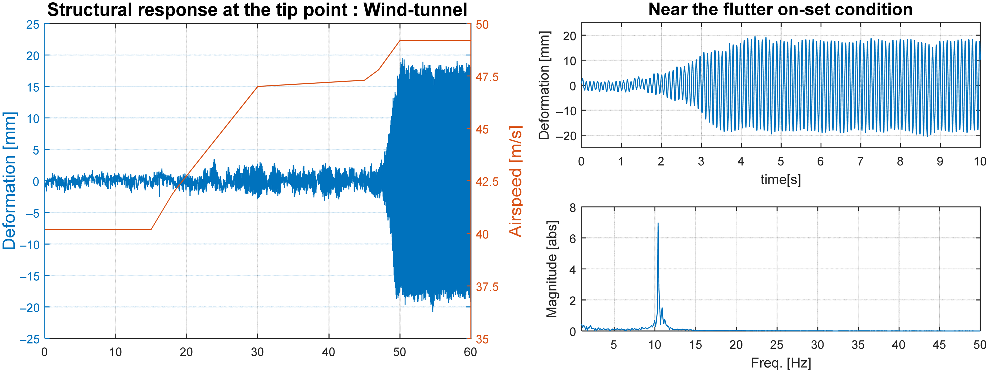
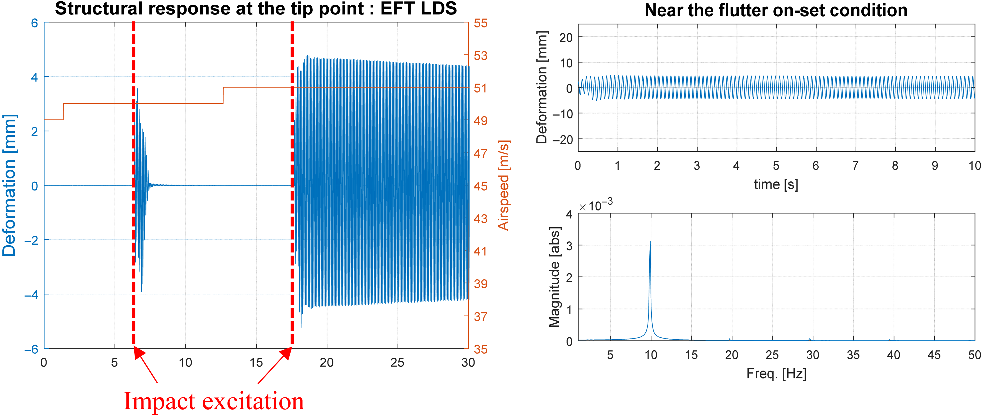
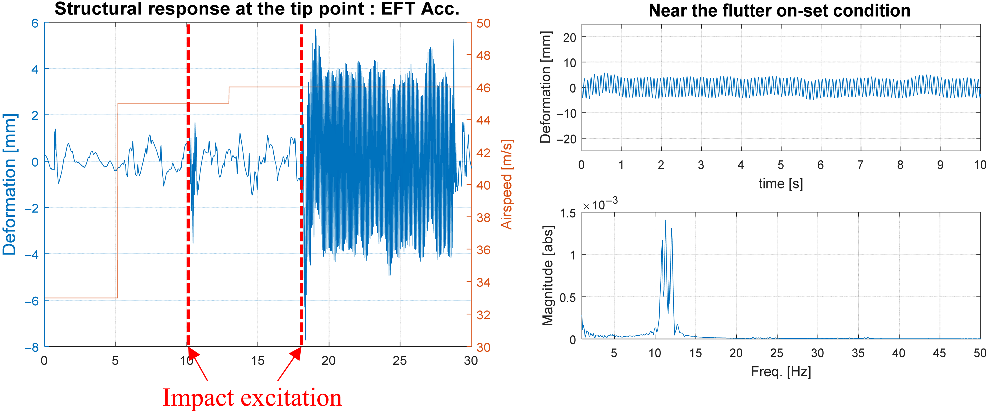
The flutter speed and frequency were obtained by processing displacement measurement data at the tip points, as shown in Figs 23, 24 and 25. Note that for the displacement data measurement, the wind-tunnel test utilized stereo camera, while the two EFT modules used LDS and accelerometer separately.
In the wind-tunnel flutter test, when the airspeed in the wind-tunnel increased from 47.8 to 49.2m/s, the structure generated an abrupt large amplitude of vibration which indicates the flutter.
In the EFT by LDS, the initial disturbance made by the impact exciter cannot cancel out when the airspeed is increased from 50 to 51m/s, whereas for the EFT by accelerometer, the same phenomenon happens between 45 and 46m/s.
To identify the flutter frequency, the displacement data after the flutter onset with a time span of 10s was transformed to frequency domain by FFT for the all of three flutter test cases. Flutter frequency was then identified with 0.1Hz resolution. Comparison of flutter boundary results from the experiments to the analysis result is shown in Table 4.
IR markers on the plate.

Flutter speed (left) and frequency (right) identification, wind-tunnel test.

Flutter speed (left) and frequency (right) identification, EFT by LDS.

Flutter speed (left) and frequency (right) identification, EFT by Accelerometer.

By inspecting the displacement data after the flutter onset, its magnitude at the wind-tunnel test was about four-times larger than the one at the two types of EFT. It is because of the voltage limitation set in operating the DDLA, which is to protect the coil circuit of it. The response was limited since the voltage magnitude reached to the limit at the flutter. Clearly, it did not create any issue in identifying the flutter boundary, at which an abrupt increase in response magnitude was initiated.
It is seen that the displacement signal of EFT by LDS was clear because it is a direct output of LPF and HPF. While, the displacement measured at the EFT by accelerometer still has a drift, since the drift attenuation was restrained to suppress the phase delay. If the drift were more attenuated, then the flutter frequency would have larger error because of phase delay.
5.3 Flutter mode shape
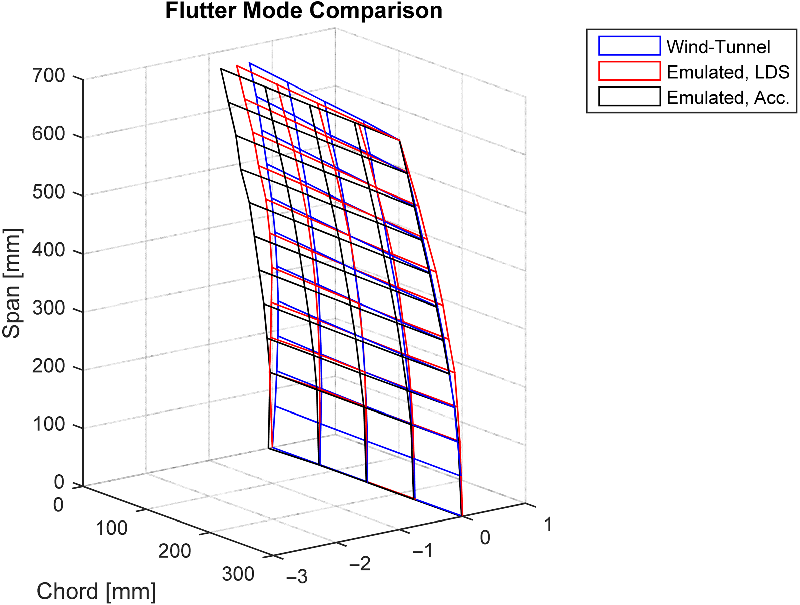
To capture the flutter mode shape by the emulated test module, a stereo camera set was applied again. As well as the flutter boundary, the flutter mode shape by the three methods were compared. In the wind-tunnel and emulated test case, flutter mode shape is defined as an operating deflection shape (ODS)(Reference Schwarz and Richardson23) at the maximum displacement instant. Then the flutter mode shapes were normalized to one for comparison.
As shown in Fig. 26, all the three flutter mode shapes are in good agreement. Table 5 presents the modal assurance criterion (MAC) value(Reference Allemang24) between each pair of mode shapes.
All the MAC values, especially between the two EFT and wind-tunnel mode shapes are close to one. The validation result of emulated flutter test described in this section shows a reliability of the technique.
5.4 Trend of damping
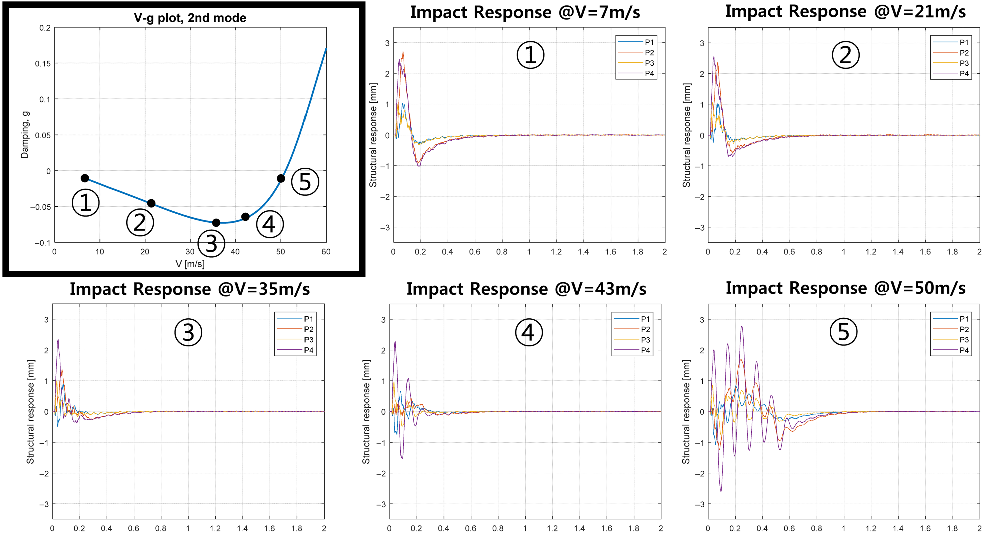
From the V-g plot, it was observed that with increasing airspeed, the aerodynamic damping by the critical mode (2nd mode) increased first, and then decreased to zero to induce a flutter. To check whether the same trend was also observed by the EFT module or not, LDS-EFT module was applied. By inputting five different airspeed values in an increasing order as marked in the Fig. 27 (at [7, 21, 35, 43, 50]m/s), the trend of the aerodynamic damping was monitored. After setting the airspeed value, the impact excitation was made. The structural response measured by the four LDSs are recorded for 2s as shown in Fig. 27. By observing how fast the impact disturbance decays out, the damping effect could be identified.
MAC value among flutter mode shapes

Flutter mode shape comparison, by wind-tunnel, EFT by LDS and accelerometer.

Emulated aeroelastic response with increasing airspeed values.

The aerodynamic damping trend from the measured response coincides exactly with the trend predicted in the V-g plot. The aerodynamic damping at the airspeed of 35m/s was the largest so that the disturbance was quickly eliminated. As the airspeed was getting closer to the flutter speed, it took longer time to decay out the disturbance. This result is very meaningful, and has never been presented before. It shows the validity of the aerodynamic force emulation, which supports the reliability of the technique.
6.0 Conclusions
In this paper, an experimental module for the ground flutter test was developed and the validity of the ground flutter test was validated through a series of experiments. The technique called EFT, is basically the replacement of the distributed aerodynamic loadings with a few concentrated point-loading actuators. Two kinds of EFT modules utilizing two different types of sensors, LDS and accelerometer, were developed for a thin aluminum plate target structure. Both modules consisted of two actuators and four sensors. The accuracy of the flutter emulation was examined through the comparison to the wind-tunnel flutter test. Compared to previous EFT studies, several major improvements are made in this work; not only flutter boundary, but also flutter mode shapes and the damping trends with the increment of air speed are obtained and compared. In addition, new types of devices such as DDLA and accelerometer are applied, which makes the present work more compact and general. The issues in numerical differentiation and integration of the structural response measurement signal was successfully handled. To resolve the noise magnification in numerical differentiation, the application of SGF was proposed, whereas combination of LIF and HPF was made to suppress signal drift in numerical integration.
Compared to the wind-tunnel test results, both EFT modules emulates flutter within 6.2% error in flutter speed and within 8.7% of error in flutter frequency. In addition, the MAC values calculated among the three flutter mode shapes showed very high correlation, larger than 0.87. In the emulated flutter test, the effect of the aerodynamic damping was observed to have similar trend as expected in the velocity-damping curve from the analysis. Despite of remaining limitation due to the current aerodynamic model, these validation results imply a meaningful progress of the EFT techniques.
Acknowledgements
This work was supported by High Speed Research Center (HVRC) program funded by the Defense Acquisition Program Administration (DAPA) and Agency for Defense Development (ADD).