Implications
We analyse the technical and economic feasibility of intensifying dairy production in regions dominated by cereal and cotton production. Important increases in milk production are possible with the land and financial resources currently available to farmers. However, the adoption of dairy will remain limited to few, better-off farmers who can afford the financial risk of investing in production of animal feed and for those who can buffer strong milk price fluctuations. This is an important message for policies designed to support diversification within and among smallholder farms.
Introduction
Many farming systems in the Sudan Guinean zones of West Africa have evolved into mixed farming dominated by the cultivation of cereals, legumes and cotton (De Ridder et al., Reference De Ridder, Breman, van Keulen and Stomph2004). Most farmers keep livestock (cattle, small ruminants and poultry). In particular, cattle are an integral part of the cotton producing farming system providing manure and draught power for cropping. Until around the turn of the century, farmers in these zones of West Africa considered cotton to be the ‘white gold’ for their livelihoods. In Mali, as in other countries in West Africa encompassing the Sudan Guinean zone, cotton rapidly became the most important cash crop (De Ridder et al., Reference De Ridder, Breman, van Keulen and Stomph2004). In Southern Mali, the expansion of cotton production was supported by a comprehensive agricultural development programme including establishment of institutions such as the CMDT (Compagnie Malienne pour le Développement des Textiles), a state-based company to develop the cotton and textile production and marketing. CMDT provided inputs, credit services for farmers, oxen for draught power and equipment for cultivation and guaranteed prices for cotton. These interventions led to an increase in the number of oxen for traction, and to investments in other cattle so that most farmers (70% to 80%) have increased the size of their herds (Sanogo et al., Reference Sanogo, de Ridder and van Keulen2010).
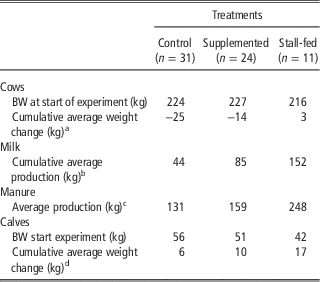
Farmers from villages nearby urban centres sell milk to processors including cooperatives. Although the milk market chain remains rudimentary, its development creates opportunities for farmers to diversify, making them less vulnerable to income fluctuations, particularly because milk can be produced year round assuring daily cash income (Rietveld, Reference Rietveld2009). Currently, milk yields of indigenous breeds in the study sites are poor, averaging <1 kg/day per cow over the lactation period. Particularly during the dry and hot season there is feed shortage for lactating cows due to lack of pastures and their poor quality (Penning de Vries and Djitèye, Reference Penning de Vries and Djitèye1982). Lalba and Dickey (Reference Lalba and Dickey1996) in Burkina Faso and Sanogo (Reference Sanogo, de Ridder and van Keulen2010) in Mali showed that with improved feeding and grazing management milk production and calf growth can be increased. An on-farm participatory feeding trial in the villages of N’Goukan and Try, near Koutiala in Southern Mali, showed that improved feeding and keeping lactating cattle confined during the dry season limits BW loss, increases milk and manure production of cows and increases calf growth (Bosma et al., Reference Bosma, Dembele and Kanté1997; Sanogo Reference Sanogo2010; Table 1). Another expected benefit of improved feeding during the dry season is an increase in lifetime productivity of the cows. It is not feasible to conduct feeding and grazing management experiments under farmer conditions as the lifetime cycles of cows are more than 12 years. Therefore, we combined short-term feeding experimental results with those of a dynamic model that simulates lifetime performance of cattle influenced by feeding and grazing management. The model LIVSIM (LIVestock SIMulator) was developed to represent livestock production in smallholder farming systems (Rufino et al., Reference Rufino, Herrero, van Wijk, van Hemerik, de Ridder and Giller2009). Subsequently, LIVSIM was applied in the dynamic, whole farm simulation model NUANCES-FARMSIM to identify entry-points for strategic management of smallholder farming systems (Van Wijk et al., Reference Van Wijk, Tittonell, Rufino, Herrero, Pacini, de Ridder and Giller2009) and to analyse feed and manure allocation strategies at village level (Rufino et al., Reference Rufino, Dury, Tittonell, van Wijk, Herrero, Zingore, Mapfumo and Giller2011).
Milk and manure production, starting BWs of cows and calves and BW changes in a farmer feeding experiment in the villages N’Goukan and Try, Mali, running from 1 March to 15 June in 2006 and 2007

Data are averaged over the 2 years (after Sanogo Reference Sanogo2010).
a s.e.m.=4.59; P<0.001.
b s.e.m.=10.95; P<0.001.
c s.e.m.=11.39; P<0.001.
d s.e.m.=2.14; P<0.001.
The objectives of this study were (i) to evaluate lifetime productivity of cows under varying feeding and grazing management using a modelling approach and (ii) to evaluate the economic performance of these feeding strategies at farm level. We used livestock performance indicators such as BW, milk production, reproduction rate, mortality of offspring, and manure production, and farm economics. We analysed the trade-offs associated with allocating land for forage production to feed lactating cows v. allocating land to cotton production. The rationale behind the choice of this trade-off analysis is that both cotton and milk can provide cash income for farmers. To produce more milk, high-quality feed is needed that can be produced on farm. When land is scarce and cereals are needed for self-sufficiency, an interchange between land used for cotton cultivation or for fodder production is a logical option.
Material and methods
Study area
The on-farm feeding experiments were conducted in the villages of Try (12°16'N and 5°23'W) and N’Goukan (12°21'N and 5°19'W), situated in the cotton region of Koutiala. During the rainy season (June to October), rainfall averages 800 mm. Daily average temperature varies between 22°C (cold season from November to March) and 35°C (hot season from March to June). Soils are poor, of sandy or sand–loamy texture and often gravelly. The natural vegetation is a tree savannah with an understory of annual and perennial forbs and grasses. Major crops cultivated are sorghum, millet, maize, cowpea, groundnut and cotton.
Méré cattle is the non-stabilised, dominant cross-breed between Zébu Peulh (Fulani, Bos indicus), and Baoulé cattle (Bos taurus) (Felius, Reference Felius1995; Yapi Gnaoré et al., Reference Yapi Gnaoré, Oya and Ouattara1996; Porter and Mason, Reference Porter and Mason2002). Cattle are grazed by herdsmen on communal rangelands (year round) and on crop residues left in the fields after harvest (from November to June). Animals are kept overnight in corrals near the homestead during the growing season or near the cropped fields during the dry season.
The model
LIVSIM is a dynamic model based on the principles of production ecology (Van de Ven et al., Reference Van de Ven, de Ridder, van Keulen and van Ittersum2003). LIVSIM simulates the performance of individual animals in time according to growth-defining factors (genetic characteristics), and growth-limiting factors (feed quantity and quality). The model was designed to evaluate the effect of farmer’s resource allocation of feedstuffs on animal productivity. Conception, sex of the calves and mortality are discrete events treated stochastically. Mortality due to under-nutrition, abortion, age and weight are described deterministically, and simulated using growth and weight loss routines.
Intake is driven by feed quality and bodyweight. Reproductive performance is evaluated using days to first conception, days open (days between calving and next conception), calving interval and length of the productive life (age at disposal minus age at first calving). Productivity is assessed by number of offspring, milk production, weight gain and manure production. The integration time-step can be set at any number of days. The basic structure is based on the concepts of the model developed by Konandreas and Anderson (Reference Konandreas and Anderson1982). LIVSIM differs from that model in (i) the nutritive requirement calculations, which are based on Agricultural and Food Research Council (1993), (ii) feed intake, which is based on the model of Conrad (Reference Conrad1966), (iii) excreta production is estimated and (iv) management strategies for feeding and reproduction are included. A full description of the model used for this paper can be found on http://models.pps.wur.nl/content/livsim-mere-cattle-mali. Model parameterisation and inputs used for this analysis are explained in detail in the Supplementary Material S1.
Model testing
The model was tested using data from farmer participatory experiments (Sanogo, Reference Sanogo2010; Table 1), which belonged to the farm types as shown in Supplementary Table S1. We compared experimental BW development of cows and calves and milk and manure production with simulated values. Feeding strategies as applied in these experiments were used as input to the model: (i) control treatment consisting of current farmer practice of grazing on common grassland and residue grazing of cropland, (ii) supplemented treatment similar to the control with additional supplements during the dry and hot season, (iii) cows are stall-fed receiving the supplemented diet during the dry and hot season. The model was run for 3.5 months of the dry and hot season equal to the length of the experimental period. Given this relatively short period, the time-step of the model was set at 7 days. Feed availability per tropical livestock unit (TLU, equivalent to an animal of 250 kg) expressed in kg dry matter during the experimentation period March to June is presented in Supplementary Table S2. Estimation of fodder availability from pastures and crop residues on cropland is taken from Sanogo (Reference Sanogo2011) (Supplementary Table S3). Quality of the different feed stuffs is presented in Supplementary Table S4.
Lifetime productivity analysis
The lifetime cycle covers a period of 12 years and the time-step of the model was set at 1 month. In this analysis, we used the three feeding strategies used in the farm experiments for model testing. To achieve a benchmark to indicate the ceiling of potential milk production, we added the treatment ‘Stall-fed year round’, in which animals receive a luxurious diet to achieve the potential production of the breed. Year round feed availability and quality on a monthly basis was estimated (Supplementary Tables S3 and S4). Feed availability only differs between treatments during the period of supplementation with the exception of the treatment ‘Stall-fed year round’ where feed is always abundant.
Weight at birth was set at 18, 22, 26 and 30 kg for the ‘Control’, ‘Supplemented’, ‘Stall-fed during dry season’ and ‘Stall-fed year round’ treatments. It was assumed that calves are weaned at 18 months of age (Wagenaar et al., Reference Wagenaar, Diallo and Sayers1986); for the first 3 months, all milk is allocated to the calf and from 4 to 18 months the fraction of milk consumed by the calf can be set by the user.
The remaining milk is for home consumption or can be sold to the market. Depending on the milk production, which is linked to the feeding strategy, fractions given to the calf were set at 0.825, 0.78, 0.7 and 0.47 for the treatments ‘Control’, ‘Supplemented’, ‘Stall-fed during the dry season’ and ‘Stall-fed year round’.
By applying the evaluation method of Rufino et al. (Reference Rufino, Herrero, van Wijk, van Hemerik, de Ridder and Giller2009), we required 1000 simulation runs to be able to capture significant differences between treatments (results not presented).
Farm-level analysis
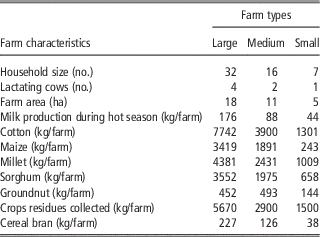
We limited our analysis to the village of Try. Land scarcity is more severe in N’Goukan but land use patterns and agricultural systems are similar in both villages. A profitability analysis was conducted to compare milk and cotton production for farms that have herds with, on average, at least one reproductive cow. These farms are mixed crop-livestock farm types large to small as indicated in Table 2. Farm type very small was excluded from the analysis because these farmers (around 10% of the farmers, Sanogo et al., Reference Sanogo, de Ridder and van Keulen2010) do not own cattle. Further characteristics of the three farm types are shown in Supplementary Table S1.
Characteristics of the farm types from Try and N’Goukan considered in the profitability evaluation at farm level when cultivation of cotton was replaced by cowpea hay production to supplement cows (after Sanogo, Reference Sanogo2011)

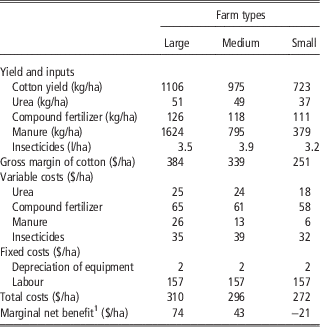
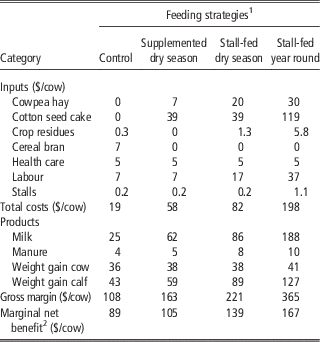
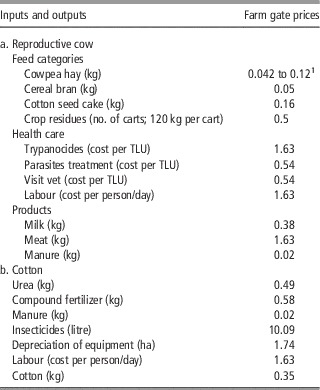
We assumed that, on average, at least four, two and one cow(s) are lactating year round, respectively, in farm types large, medium and small. These cows were fed according to the four feeding strategies. Model outputs were averaged over the lifespan of the cows set to a maximum of 12 years. In the current situation, expansion of the cultivated land area to produce cowpea hay needed in the different feeding strategies is not an option. Therefore, we assumed that an area of land currently used to produce cotton can be replaced by cowpea production. The area to be replaced is calculated to be equal to the area of cowpea that produces enough hay for the lactating cows for the different feeding strategies. The marginal net benefits of cotton production per hectare (Table 3) and of keeping one lactating cow (Table 4) on an yearly basis were calculated using local prices of the inputs and outputs at the farm gate as collected by the authors in the villages in 2006/2007 (Table 5a and b). Costs of inputs ($/cow) for feed in Table 4 were calculated using the prices of inputs per kg as given in Table 5 and multiplied by the quantities fed in the different feeding strategies (Supplementary Table S3). Crop residues as indicated in Tables 2 and 4 are the straw from cereals collected from the fields and stored. Prices of other inputs per year are given per TLU. Costs for health care (Table 4) were calculated by assuming these to be twice the costs of medicines used and veterinary visits (Table 5). Labour costs are based on the cost per day multiplied by the number of days needed in the different feeding regimes, that is, 4.3, 4.3, 10.5 and 22.6 for the ‘Control’, ‘Supplemented dry season’, ‘Stall-fed dry season’ and ‘Stall-fed year round’, respectively.
Gross margins and marginal net benefit for cotton production for each farm type

Prices are farm gate prices as collected by the authors in 2006/2007 in the villages of Try and N’Goukan.
1 Marginal net benefit is defined as the difference between the gross margin of a hectare of cotton minus the variable and fixed costs.
Inputs, total costs, gross margin and marginal net benefit for keeping one reproductive cow using different feeding and grazing regimes

Data from Try and N’Goukan.
1 Feed quantity is provided in Supplementary Table S3.
2 Marginal net benefits are defined as the difference between the gross margin of a hectare of cotton minus the variable and fixed costs.
Farm gate prices in US$ per unit input and output for one reproductive cow (a) and one hectare cotton (b) as collected by the authors in 2006/2007 in Try and N’Goukan

TLU=tropical livestock unit.
1 To calculate marginal net benefit the lowest value is used. Highest price is in dry season when offer on market is low, but if farmers produce and stock on farm the lowest value is realistic.
The gross margin of a cow unit is calculated by multiplying the meat, milk and manure prices (Table 5) by the average production of meat, milk and manure over the lifetime cycles of 1000 runs as simulated with the model. To obtain an average yearly production, we considered a time period of 12 years for weight gain of cows (end of lifetime weight divided by 12), and for manure (total lifetime production of manure over life time divided by 12). For milk production, we considered a variable production period determined by end of life of cows (12 years) minus age of first calving. Fraction of milk produced that is sold was set at 0.175, 0.22, 0.3 and 0.43 for the ‘Control’, ‘Supplemented dry season’, ‘Stall-fed dry season’ and ‘Stall-fed year round’, respectively. These fractions were derived from the on-farm trials. For weight gain of calves, we assumed that one female calf is needed to replace the cow and one bull calf is needed to replace oxen for traction. Surplus calves (number of calves produced during the life time minus two) are given a monetary value using the weight gain of calves in a year multiplied with the price of meat per kg. Weight of the surplus calves are those at 1 year of age as taken from the simulation runs; 55, 64, 78 and 112 kg for ‘Control’, ‘Supplemented dry season’, ‘Stall-fed dry season’ and ‘Stall-fed year round’, respectively.
The marginal net benefit is defined as the gross margin minus the total variable costs. Gross margins of a lactating cow may be somewhat overestimated since surplus calves produced are given a monetary value. At the other hand, costs related to the use of a pair of oxen are not included in the calculation of the gross margin of a hectare of cotton making the gross margin of a hectare of cotton also somewhat overestimated.
We scaled the results obtained for a lactating cow and per hectare of cotton to farm level using the characteristics of the farm types. We calculated partial annual revenue of the farm defined as the income at farm level of selling milk and cotton. The partial annual revenue of the farm varies depending on the feeding strategy. Supplementing cows with cowpea hay requires land that would otherwise be cropped with cotton.
A sensitivity analysis was carried out to evaluate the effect on the partial annual revenue of changes in price of milk and cotton. Fluctuations in prices of cotton and milk were set to ±15% of the values prevailing during the farmer participatory experiment.
Results
Model testing
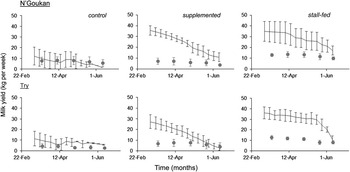
Simulated bodyweight followed the observed values on average quite well (Figure 1). There was a poor fit in the case of milk production; observed values were in all cases less than the simulated values (Figure 2). The observed values did not include milk consumed by the calves. The fraction of milk consumed by the calves was not measured but can be estimated as follows: measured growth rates of the calves averaged 6, 10 and 17 kg over 105 days in the treatments Control, Supplemented and Stall-fed, respectively (Table 1). The average weight increases per week were 0.40, 0.67 and 1.13 kg for these treatments. For three cattle breeds from West Africa, an average conversion rate of 0.124 kg BW for each kilogram of milk consumed was measured (Monts, Reference Monts1960). The average milk consumption per week by the calves can be calculated using this conversion rate. Adding this amount to that measured resulted in values that are close to the simulated weekly values (Figure 2): for the Control between 5.9 and 11.6, Supplemented between 9.3 and 13.3 and Stall-fed between 17.7 and 23.0 kg of milk per week.
Simulated (lines) and observed (dots) values for BWs of lactating cows with different feeding regimes during the dry and hot season in the villages N’Goukan and Try, with standard errors indicated.

Simulated (lines) and observed (dots) values for milk production of lactating cows with different feeding regimes during the dry and hot season in the villages N’Goukan and Try, with standard errors indicated. The observed milk production does not include the milk consumed by the calves, explaining the difference between simulated and observed milk production.

The distribution of simulated calving throughout the year with values reported in the literature differed only slightly from observations. Some more aspects of model testing are presented in the Supplementary Material S1. These modelling results support the robustness of the model for use in a lifetime analysis.
Lifetime productivity analysis
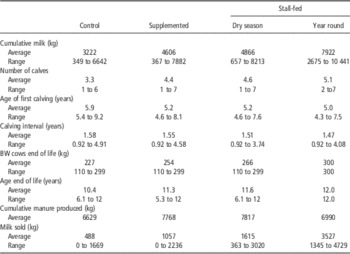
The effects of feeding regimes and management on lifetime productivity of cows using average, median and range of values of 1000 runs as calculated by the model are presented in Table 6. Increasing feed quantity and quality fed to the lactating cows in the harsh periods of the year resulted in an increase in cumulative milk production, number of calves, BW and age reached at the end of the simulation, and cumulative milk sold. Age of first calving and calving interval were reduced with improved feeding. Best performance was obtained with abundant feed of good quality and keeping the cows stall-fed year round, though less manure was produced. Potential for increased manure production due to higher intake was offset by higher digestibility, giving a higher ratio between feed used for performance of the animal and feed lost through faeces. This is shown in the last treatment where the least manure was produced, although intake of feed was largest, giving best performance of the cows.
Lifetime productivity expressed in BW of cows at the end of the lifetime cycle, cumulative milk production, number of calves and manure produced, milk sold and reproduction parameters (age at first calving and calving intervals) in relation to feeding strategies

Farm-level analysis
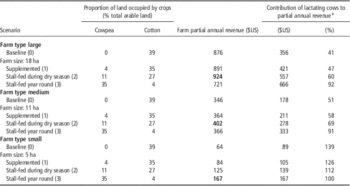
Given the prices that prevailed during the period of the participatory farmer experiments, the partial annual revenue analysis shows that improving feeding of lactation cows increased revenues by 2%, 5% and 30% for farm types large, medium and small, respectively (Table 7). Keeping the cows stall-fed during the dry season increased the benefits by 5%, 16% and 95% for farm types large, medium and small, respectively. For farm types large and medium, the best annual revenue was obtained when lactating cows were supplemented and stall-fed during the dry season. However, partial annual revenue decreased if lactating animals were stall-fed year round. This treatment was considered the highest reference for milk production but it is currently not a viable option. Thus, given the current prices as set in this analysis, these farmers could consider producing quality fodder for milk production by substituting part of the area currently cultivated with cotton. For farm type small, cotton production was not profitable (see also Table 3), particularly because of the costs of family labour. Farmers in this farm type probably ascribe a low monetary value to their labour, which explains why they continue to cultivate cotton. For these poorer farmers, producing cowpea for milk production instead of cotton was only beneficial if the full cost of labour was not taken into account. Increases in revenue ranged between 30% and 160% depending on the feeding strategy.
Contribution of milk and cotton production to the farm partial annual revenue using average farm gate price of 0.38 $US/kg for milk and 0.35 $US/kg for cotton

Partial annual revenue of the farm only includes revenues earned from milk and cotton. Data in bold are the largest values in a row per farm type. Analysis conducted only for the village of Try.
* Cotton is the complement of milk production.
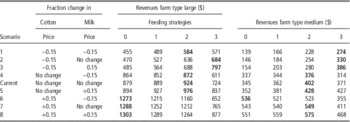
Sensitivity analysis using price changes of ±15%, common in the region during the last decades, revealed that if the cotton price increases by 15% and milk price stays the same or decreases (Scenario 6 and 7 in Table 8), investing in milk production is not profitable. Even if the milk price increases by 15%, milk production had no advantage over cotton production (Scenario 8). A change of 15% in milk price at current cotton prices led to the selection of stall feeding during the dry season as feeding strategy (Scenario 4 and 5 in Table 8). Stall-feeding of cattle during the dry season seems to be the most robust feeding strategy for both farm types large and medium if cotton price decreases and the price of milk increases or stays the same (Scenario 2 and 3 in Table 8). If the cotton price falls by 15%, stall feeding during the dry season or year round appear to be the most robust strategies.
Sensitivity of the partial annual revenue to price changes (±15%) per unit product of milk and cotton for farm type large and medium

Partial annual revenue is the revenue of only the cotton and milk produced at farm level. Analysis was conducted for the four feeding strategies of lactating cows for the village of Try. Data in bold are the largest values in a row per farm type.
Discussion
The first objective of this study was to analyse the effect of improving feeding strategies on the lifetime performance of reproductive cows using a simulation model. Our analysis showed that the relationship between body condition and subsequent effect on reproduction was strongly influenced by the pattern of feed availability and quality throughout the year. The model was sensitive to changes in feeding strategy. Relatively marginal changes in feeding of lactating cows during the hot and dry season (Supplemented and Stall-fed during the dry season) did not have a large effect on the frequency distribution of calving throughout the year. Larger differences in feeding during the entire year were apparently needed to change calving patterns. By contrast, there was a strong influence on mortality of offspring at an older age if calves were poorly fed up to weaning age (Supplementary Material S1). This result highlights the need for analysis of lifetime productivity to evaluate feeding strategies. Analysis of a feeding intervention solely based on the participatory experiments over 2 or 3 years cannot reveal the consequences of not meeting feeding requirements of calves in later life. With increasing confidence in the model outputs gained from the calibrated intake function for the local breed, other strategies in feeding and grazing over the lifetime cycle of animals could be investigated. Further, strategies in the milk fraction allocated to the calf can be explored, a management choice that has a large effect on the performance of offspring not only as calves but also as subsequent reproductive cows.
Calibrating the model for other West African breeds would allow other options for improved feeding to be explored as has been done in East and southern Africa (Rufino et al., Reference Rufino, Herrero, van Wijk, van Hemerik, de Ridder and Giller2009; Van Wijk et al., Reference Van Wijk, Tittonell, Rufino, Herrero, Pacini, de Ridder and Giller2009; Rufino et al., Reference Rufino, Dury, Tittonell, van Wijk, Herrero, Zingore, Mapfumo and Giller2011).
As a second objective, we evaluated the consequences of alternative feeding strategies of lactating cows at the farm level in a trade-off analysis between milk and cotton production. Although there are many other possible management options that could be tested, we limited our evaluation to reallocation of part of the farm land to produce cowpea fodder as feed for lactating cows, that is, we examined the trade-off between milk production for the market and cotton production, both providing cash income for farmers. Given the prices that prevailed during the farmer participatory experiment, keeping lactating cows stall-fed and producing additional feed of high quality increased the partial annual revenue by 16% to 18% for farm types large and medium (Table 7). A cross-price elasticity analysis showed that changing feeding and grazing regimes to produce forage for milk production was beneficial for farmers when prices of cotton did not increase in relation to milk prices (Table 8). If cotton prices increase more relative to milk prices, farmers will benefit more from investing in cotton. Changes in prices of inputs modifying the gross margins of cotton or milk production will have a similar effect. A potential shift to milk production is most beneficial for the larger, better-off farms (farm type large). Only 16% of the farmers belong to farm type large, whereas 66% of the farmers belong to farm type medium (Sanogo et al., Reference Sanogo, de Ridder and van Keulen2010). Given farmers’ resources and distance to the market for milk production and marketing, we expect that only a few of the farmers in the cotton zone of Southern Mali will shift to milk production. Intensive milk production systems, such as stall feeding, require a major change in allocation of labour and farming priorities. Thus, a precondition will be that favourable prices for milk in comparison with cotton remain stable over a longer period since a shift in strategy is risky and it takes a long period to develop the new farming system to provide the full benefits from milk production.
Variation in farming systems is large. Thus, the current analysis may not be directly applicable. In Mali, for example, the role of milk production in the rice-based system in the Office du Niger (Doumbia et al., Reference Doumbia, van Paassen, Oosting and van der Zijpp2012) and the peri-urban milk production systems of Sikasso (Coulibaly, Reference Coulibaly2008) merit separate analyses. Furthermore, diversity among farms is large within each system (Giller et al., Reference Giller, Tittonell, Rufino, van Wijk, Zingore, Mapfumo, Adjei-Nsiah, Herrero, Chikowo, Corbeels, Rowe, Baijukya, Mwijage, Smith, Yeboah, van der Burg, Sanogo, Misiko, de Ridder, Karanja, Kaizzi, K’ungu, Mwale, Nwaga, Pacini and Vanlauwe2011) implying that not one solution fits all. The Malian government launched in 2008 a project Prodevalait to provide 41 regions with milk collection centres and with support for fodder production (Doumbia et al., Reference Doumbia, van Paassen, Oosting and van der Zijpp2012). Provided that our model is calibrated for other breeds, a lifetime performance analysis of milk producing cows could assist in making choices for feeding regimes in all regions.
Conclusions
Options for milk production can be explored using our combined approach of (i) using the simulation model to explore the effect of feeding regimes on milk production and (ii) the analysis at farm level to evaluate the effect of the explored feeding regimes on the whole farm economies of farmers. The combination of farmer participatory experiments and simulation modelling of lactating cows confirmed that milk production of the Méré breed in cotton regions of Mali could be expanded if the feeding and grazing strategies are improved.
Whether milk could take over the role of cotton as the white gold for smallholder farmers, is related to the cross-price elasticity of cotton and milk, as well as the risk associated with milk production. More farmers are likely to partly replace cotton to fodder production for milk production if the price of cotton is depressed and that of milk is relatively high. Given the extended period needed for farmers to invest in changing their farming strategy, price ratios between milk and cotton would have to remain stable for an extended period. Further, farmers are only likely to seize the opportunity of intensifying milk production if the infrastructural landscape for marketing milk is better developed. As many farms are remote from urban centres, we expect that milk production is an opportunity to improve the livelihood for a limited number of wealthier farmers. Yet milk production is unlikely to displace cotton as the white gold of the West African savannahs.
Acknowledgements
The authors acknowledge the valuable contributions from MSc students Jerome Dury, Yann Vétois and Miriam Breure during their thesis work. The research was funded by the European Union (AfricaNUANCES project – Contract no. INCO-CT-2004-003729).
Supplementary material
To view supplementary material for this article, please visit http://dx.doi.org/10.1017/S1751731115000178