1. Introduction
Active and passive flow control techniques promise reduced skin friction drag and vast energetic and monetary savings in practical applications (see, for example, Kim Reference Kim2011). However, as pointed out by Bechert et al. (Reference Bechert, Bruse, Hage, Van Der Hoeven and Hoppe1997), the development of effective drag reduction techniques is challenging and current engineering solutions fall short of delivering even a fraction of the projected savings. A key challenge is predicting the flow response to control in advance, which remains elusive and limits the effectiveness of controllers. Current control techniques are typically informed by the physics of canonical flows and target coherent flow structures as a proxy for suppressing turbulent fluctuations. However, there is no guarantee that this approach will be successful and there is growing evidence that these controllers can modify the dynamics of a low-Reynolds-number flow in at least three ways: (i) attenuation or (ii) amplification of the near-wall cycle, and (iii) generation of spanwise rollers (see, for example, Choi, Moin & Kim Reference Choi, Moin and Kim1994; Jiménez et al. Reference Jiménez, Uhlmann, Pinelli and Kawahara2001; Breugem, Boersma & Uittenbogaard Reference Breugem, Boersma and Uittenbogaard2006; García-Mayoral & Jiménez Reference García-Mayoral and Jiménez2011; Kim & Choi Reference Kim and Choi2014; Gómez-de Segura & García-Mayoral Reference Gómez-de Segura and García-Mayoral2019; Chavarin & Luhar Reference Chavarin and Luhar2020; Toedtli, Yu & McKeon Reference Toedtli, Yu and McKeon2020). Of the three possible modifications, only the first one leads to drag reduction, which underscores the difficulty of designing effective controllers. The present work studies the three aforementioned flow modifications in a low-Reynolds-number turbulent channel flow with active wall transpiration. Using data from direct numerical simulations (DNS), we show how specific phase relations between wall pressure and transpiration at distinct spatial scales correlate with each flow response.
1.1. Active flow control: opposition control
Active feedback flow control, specifically techniques based on the opposition control scheme of Choi et al. (Reference Choi, Moin and Kim1994), are one way to generate the flow phenomena described in the previous section. Opposition control measures the wall-normal velocity
 ${v}^{\star }$
(the superscript
 $\star$
labels a dimensional quantity) at a distance
 ${y}^{\star }_d$
from the wall (located at
 ${y}^{\star }_w$
) and generates a wall transpiration of the form
 \begin{equation} {v}^{\star }({y}^{\star }_w) = - A_d \, {v}^{\star }({y}^{\star }_d). \end{equation}
We hereafter refer to
 ${v}^{\star }({y}^{\star }_d)$
as the sensor measurement,
 ${v}^{\star }({y}^{\star }_w)$
as the actuator response (or transpiration) and (1.1) as classical opposition control. The classical opposition control scheme is a proportional controller with two parameters, the real-valued controller gain
 $A_d$
and the sensor location
 ${y}^{\star }_d$
(Kim & Choi Reference Kim and Choi2017). There is broad consensus that optimal drag reduction is achieved when the gain is set to
 $A_d = 1$
and the sensor measurement is taken at
 $y_d^+ \approx 15$
, which roughly corresponds to the centre of the quasi-streamwise vortices (Choi & Moin Reference Choi and Moin1994; Hammond, Bewley & Moin Reference Hammond, Bewley and Moin1998; Chung & Talha Reference Chung and Talha2011; Luhar et al. Reference Luhar, Sharma and McKeon2014b
). A superscript
 $+$
as in the above expression indicates normalisation by the friction velocity
 ${u}^{\star }_{\tau } = ({\tau }^{\star }_w / {\rho }^{\star })^{(1/2)}$
and viscous length
 ${l}^{\star }_v = {\nu }^{\star } / {u}^{\star }_{\tau }$
, where
 ${\tau }^{\star }_w$
is the wall shear stress,
 ${\rho }^{\star }$
the fluid density and
 ${\nu }^{\star }$
the kinematic viscosity. The control scheme can deliver up to 25 % drag reduction in low-Reynolds-number flows, where the near-wall cycle is the dominant coherent flow motion (Choi et al. Reference Choi, Moin and Kim1994), but its effectiveness decreases with Reynolds number as large-scale motions become relatively more energetic (Hutchins & Marusic Reference Hutchins and Marusic2007a
; Deng, Huang & Xu Reference Deng, Huang and Xu2016).
Numerous generalisations of classical opposition control have since been proposed in the literature. The relevant generalisation for this study is obtained by Fourier transforming (1.1) along suitable shift-invariant directions (Luhar et al. Reference Luhar, Sharma and McKeon2014b ; Toedtli et al. Reference Toedtli, Luhar and McKeon2019a ). The control law then establishes a relation between the Fourier coefficient of the sensor measurement and the transpiration
 \begin{equation} {{\hat {v}}^{\star }_{\boldsymbol{\kappa }}(y_w) = - \hat {A}_d \, {\hat {v}}^{\star }_{\boldsymbol{\kappa }}(y_d)}, \end{equation}
where
 $\boldsymbol{\kappa }$
is the wavenumber vector that contains the transformed coordinates and the superscript hat labels complex-valued quantities. Equation (1.2) will be referred to as varying-phase opposition control, to make the distinction to (1.1) clear. A formulation in the Fourier domain introduces
 $\angle \hat {A}_d$
as an additional controller parameter, whose physical interpretation will be discussed in § 2.3. Varying-phase opposition control with
 $\angle \hat {A}_d = 0$
recovers (1.1), while
 $\angle \hat {A}_d \neq 0$
can increase the maximum attainable drag reduction or lead to a significant drag increase (Toedtli et al. Reference Toedtli, Luhar and McKeon2019a
). For positive values of
 $\angle \hat {A}_d$
, the drag increase coincides with the appearance of spanwise rollers (Toedtli et al. Reference Toedtli, Yu and McKeon2020). The flow responses therefore likely encompass the three phenomena described initially, but the physical link between their occurrence and
 $\angle \hat {A}_d$
remains unclear.
Before moving on to passive control methods, we give a short overview of other relevant opposition control generalisations. The effectiveness of classical opposition control at low Reynolds number can be improved in multiple ways, for example, by using upstream sensor information (Lee Reference Lee2015) or by adding an integral term to the control law (Kim & Choi Reference Kim and Choi2017). These approaches are related to (1.2), because spatial shifts in physical domain and integration in time domain correspond to scale- and frequency-dependent phase shifts in the Fourier domain. A different line of work suggests that reinforcement learning can recover the optimal value of
 $A_d$
in (1.1) for a given
 $y_d$
(Sonoda et al. Reference Sonoda, Liu, Itoh and Hasegawa2023). Novel control laws based on nonlinear network architectures further suggest that more effective controllers can be devised if the transpiration depends on the streamwise and, in some cases, the wall-normal velocity at
 $y_d$
(Guastoni et al. Reference Guastoni, Rabault, Schlatter, Azizpour and Vinuesa2023; Sonoda et al. Reference Sonoda, Liu, Itoh and Hasegawa2023; Zhou, Zhang & Zhu Reference Zhou, Zhang and Zhu2025). Opposition control has also been extended to the logarithmic layer, whose coherent structures would be more practical targets at higher Reynolds numbers. However, the early attempts have not lead to a statistically significant drag reduction and indicate that extending opposition control to other flow regions is non-trivial (Abbassi et al. Reference Abbassi, Baars, Hutchins and Marusic2017; Guseva & Jiménez Reference Guseva and Jiménez2022). On the other hand, extensions to different flow regimes indicate that opposition control may be fairly robust with regards to additional physical effects. For example, opposition control can successfully reduce the drag in boundary layers with adverse pressure gradients (Wang, Atzori & Vinuesa Reference Wang, Atzori and Vinuesa2024), or in compressible turbulent channel flows in the subsonic and supersonic regime (Yao & Hussain Reference Yao and Hussain2021). It is important to note that all variants of opposition control, including the varying-phase formulation used in this study, are idealised control schemes. While they are well suited for investigating fundamental flow physics in numerical simulations, their practical implementation remains a significant challenge that falls outside the scope of this study.
1.2. Passive flow control: tailored surfaces
A number of passive flow control techniques, which we subsume under the term tailored surfaces and that include riblets, porous and permeable surfaces and compliant walls, can also induce the three flow responses described initially. For example, riblets operating in the so-called viscous regime reduce the drag, with drag decreasing as the peak-to-peak spacing increases up to an optimal geometry-dependent spacing (see, e.g. Choi, Moin & Kim Reference Choi, Moin and Kim1993; Bechert et al. Reference Bechert, Bruse, Hage, Van Der Hoeven and Hoppe1997). This drag reduction is at least in part due to a suppression of the near-wall cycle (Chavarin & Luhar Reference Chavarin and Luhar2020) and is proportional to the difference in perceived origin of the streamwise and spanwise velocity, at least for small flow perturbations (Bechert & Bartenwerfer Reference Bechert and Bartenwerfer1989; Luchini, Manzo & Pozzi Reference Luchini, Manzo and Pozzi1991; Ibrahim et al. Reference Ibrahim, Gómez-de-Segura, Chung and García-Mayoral2021). The drag reduction becomes less effective for riblet spacings past the optimum and eventually turns into a drag increase. The breakdown of the viscous regime and following drag increase are mainly due to the generation of spanwise rollers, which carry substantial Reynolds stresses (García-Mayoral & Jiménez Reference García-Mayoral and Jiménez2011). The near-wall cycle becomes amplified past the viscous breakdown as well and contributes to the drag increase, but to a lesser extent than the spanwise rollers (Chavarin & Luhar Reference Chavarin and Luhar2020). Permeable walls behave similarly to riblets and exhibit a linear regime for small permeabilities, where the drag reduction is approximately proportional to the difference between the streamwise and spanwise permeability. The linear regime breaks down for sufficiently large wall-normal permeabilities and this breakdown again coincides with the appearance of spanwise rollers that eventually lead to a drag increase (Breugem et al. Reference Breugem, Boersma and Uittenbogaard2006; Rosti, Brandt & Pinelli Reference Rosti, Brandt and Pinelli2018; Gómez-de Segura & García-Mayoral Reference Gómez-de Segura and García-Mayoral2019). Spanwise rollers have further been reported for flow over porous walls, where only a non-zero wall-normal permeability is permitted (Jiménez et al. Reference Jiménez, Uhlmann, Pinelli and Kawahara2001). A commonality among riblets, porous and permeable walls is that the onset of the spanwise rollers can be predicted from the eigenspectrum and is often ascribed to a Kelvin–Helmholtz-like instability of the velocity profile (see, e.g. Jiménez et al. Reference Jiménez, Uhlmann, Pinelli and Kawahara2001; García-Mayoral & Jiménez Reference García-Mayoral and Jiménez2011; Gómez-de Segura & García-Mayoral Reference Gómez-de Segura and García-Mayoral2019). Spanwise rollers have also been observed over soft compliant walls (Kim & Choi Reference Kim and Choi2014), but this case is somewhat different from the others in that the drag increase and formation of spanwise structures are due to a resonance of the compliant wall under forcing of the flow. In this specific case, the rollers are therefore the result of the coupled flow and material response.
Despite the similarities in flow phenomena, it remains unclear how different tailored surfaces can be related and a unifying framework to analyse them is missing in the literature. In addition, the link between the properties of a specific surface and the flow response is unknown in many cases. Common to all tailored surfaces is a relaxed no-throughflow condition, which induces a wall-normal velocity in proximity of the bounding surface. Some configurations, like porous walls, explicitly replace the no-throughflow condition by a non-zero wall-normal velocity (in the permeable case, all velocity components can become non-zero at the fluid--porosity interface; see, e.g. Breugem et al. Reference Breugem, Boersma and Uittenbogaard2006; Gómez-de Segura & García-Mayoral Reference Gómez-de Segura and García-Mayoral2019). Others, such as riblets, retain an impermeable wall but introduce a complex geometry. In this case, the notion of a relaxed no-throughflow condition does not apply at the wall itself, but perhaps to a suitably chosen plain inside the flow domain that permits a non-zero wall-normal velocity in and out of the riblet groves. In this interpretation, wall transpiration may provide an essential building block to represent the flow response to tailored surfaces. It remains unclear, however, if transpiration can be used as a diagnostic to understand what causes drag reduction or increase in existing tailored surface designs.
We note that this interpretation of the transpiration as an important component of the tailored surface’s dynamic effect is related to a homogenisation of its small-scale features (see, e.g. Bottaro Reference Bottaro2019 for a review on homogenisation). This study is not attempting to formally find a homogenised representation of tailored surfaces, but it will make the case that transpiration is an important element of such representations. Formal approaches to represent permeable and rough walls as velocity boundary conditions can, for example, be found in Gómez-de Segura & García-Mayoral (Reference Gómez-de Segura and García-Mayoral2019); Habibi Khorasani et al. (Reference Habibi Khorasani, Lācis, Pasche, Rosti and Bagheri2022).
1.3. Velocity--pressure phase relations
The phase relation or, equivalently, relative spatial arrangement between wall pressure and transpiration will be a main focus of this study. The possible importance of this phase relation was first appreciated by Xu, Rempfer & Lumley (Reference Xu, Rempfer and Lumley2003), who studied pressure-driven compliant walls and observed no statistically significant reduction in skin friction. The authors conjectured that the lack of drag reduction might be due to an unfavourable phase relation between the wall pressure and the wall-normal velocity induced by the wall deformation. For example, a sweep event likely correlates with a high wall pressure, which causes the compliant surface to sink in and induce a negative wall-normal velocity in its proximity. Wall-normal velocity and pressure at the surface therefore have opposite signs and are out-of-phase. Effective active flow control strategies, such as classical opposition control, likely lead to a different phase relation: the controller would counter the sweep event with a positive wall transpiration, which leads to a wall-normal velocity and pressure that have the same sign and are in-phase. To support their hypothesis, the same authors presented a preliminary numerical simulation where the compliant wall was forced by the negative of the pressure. In this configuration, the compliant wall bulges out under a high pressure region and induces an in-phase relation between wall-normal velocity and pressure. Analogous to active flow control experiments, Xu et al. (Reference Xu, Rempfer and Lumley2003) observed drag reduction for this configuration.
A different line of work has studied a range of tailored surfaces, including compliant walls, perforated surfaces and generalised impedance boundary conditions, through the lens of the resolvent operator (Luhar, Sharma & McKeon Reference Luhar, Sharma and McKeon2015; Jafari et al. Reference Jafari, McKeon and Arjomandi2023, Reference Jafari, McKeon, Cazzolato and Arjomandi2024). Each configuration confirms that an in-phase relation between wall-normal velocity and pressure is required to suppress coherent structures and lends further support for the hypothesis of Xu et al. (Reference Xu, Rempfer and Lumley2003). However, the resolvent operator describes the linear dynamics relative to a turbulent mean flow and, therefore, only represents a subset of the nonlinear flow dynamics. In particular, the resolvent can only capture a subset (the fast pressure in the terminology of § 2.5) of the wall pressure field (see Luhar et al. Reference Luhar, Sharma and McKeon2014a for details) and it has not been clarified yet if and how the missing parts of the wall pressure may change the phase relation. In addition, it is unknown if the three flow phenomena described initially can be parameterised in terms of velocity--pressure phase relations.
1.4. Outline and contributions
This study contributes towards the open questions identified in the previous paragraphs and aims to clarify fundamental flow physics in the presence of transpiration. We perform DNS of a low-Reynolds-number turbulent channel flow with varying-phase opposition control and analyse datasets for various
 $\angle \hat {A}_d$
. Section 2 introduces the problem formulation, outlines the details of the wall transpiration and describes the numerical methods used in this study. Section 3 analyses the drag reduction and wall transpiration. The structure of the wall transpiration changes with
 $\angle \hat {A}_d$
and motivates the definition of two scale families, streak and roller scales, which drive the drag change and flow response. The structure of the wall pressure for various controlled flows is presented in § 4, along with an analysis of the relative importance of the pressure components. Section 5 considers the phase difference between the wall pressure and transpiration. Transpiration at the streak scales will be shown to be in-phase with the wall pressure when the scales are suppressed and the drag is reduced, while transpiration at the roller scales is out-of-phase when spanwise rollers are generated and the drag increases. Section 6 summarises the results and relates them to the tailored surfaces. Transpiration with streak scales will be shown to be dynamically similar to tailored surfaces that interact with the near-wall cycle, while transpiration with roller scales and positive phase shifts corresponds to the generation of spanwise rollers and drag increase. Implications for higher-Reynolds-number flows are also discussed at the end of § 6.
2. Methodology
This section describes the flow configuration and introduces the numerical methods. Section 2.1 summarises the governing equations and § 2.2 defines the Fourier decomposition and notion of phase, which will be at the centre of this study. The details of the idealised wall transpiration are introduced in § 2.3 and the DNS and pressure Poisson solver are summarised in §§ 2.4 and 2.5, respectively.
2.1. Flow configuration
We analyse an incompressible turbulent channel flow with periodic boundary conditions in the streamwise (
 ${x}^{\star }$
) and spanwise direction (
 ${z}^{\star }$
) and walls located at
 ${y}^{\star }_w = \pm {h}^{\star }$
. The walls impose a no-slip condition on the tangential velocity components (
 ${u}^{\star }({y}^{\star }_w)\! = \!{w}^{\star }({y}^{\star }_w)\! = \!0$
), as in the canonical configuration. In contrast, the walls permit a transpiration in the wall-normal direction (
 ${v}^{\star }({y}^{\star }_w) \neq 0$
) with zero net mass flux. This flow configuration can be mathematically described by the incompressible Navier–Stokes equations, which in non-dimensional index notation are
 \begin{equation} \begin{aligned} \frac {\partial u_j}{\partial x_j} &= 0, \\ \frac {\partial u_i}{\partial t} + u_j \frac {\partial u_i}{\partial x_j} &= -G_x \delta _{i1} - \frac {\partial p}{\partial x_i} + \frac {1}{{\textit{Re}}_b} \frac {\partial ^2 u_i}{\partial x_j \, \partial x_j} .\end{aligned} \end{equation}
Here
 $t$
stands for time,
 $u_i = \{u, v, w\}$
are the velocity components in the directions
 $x_i = \{x, y, z\}$
and
 $p$
denotes pressure fluctuations about the time-dependent mean pressure gradient
 $G_x(t)$
. All quantities are non-dimensionalised with respect to the channel half-height
 ${h}^{\star }$
and twice the bulk velocity
 ${U}^{\star }_b$
. This choice of reference scales introduces the bulk Reynolds number
 ${\textit{Re}}_b = 2 {U}^{\star }_b {h}^{\star } / {\nu }^{\star }$
as the governing problem parameter in (2.1). The channel is driven by a constant mass flux, so that the bulk Reynolds number is held constant at
 ${\textit{Re}}_b = 5600$
. In contrast, the friction Reynolds number
 ${\textit{Re}}_{\tau } = {u}^{\star }_{\tau } {h}^{\star } / {\nu }^{\star }$
changes as a function of the wall transpiration. For a canonical channel without transpiration, the current
 ${\textit{Re}}_b$
corresponds to
 $({\textit{Re}}_\tau )_0 = 180$
. The subscript
 $0$
will be used throughout to label a canonical channel configuration, which serves as reference for comparison. In contrast, flows with wall transpiration will be denoted by a subscript
 $c$
. We note that, throughout the paper, normalisation to inner units is based on the viscous scales of the uncontrolled flow.
2.2. Fourier decomposition and phase
Given the periodicity in
 $x$
and
 $z$
, a flow quantity
 $q$
can be expressed as a superposition of Fourier modes
 \begin{equation} q(x,y,z,t) = \sum _l \sum _m \hat {q}(l, m, y, t) \; e^{i \left (l \frac {2\pi }{L_x}x + m \frac {2\pi }{L_z}z \right )}, \end{equation}
where
 $\hat {q}$
are the complex-valued Fourier coefficients, which depend on the wall-normal coordinate and time;
 $L_x$
and
 $L_z$
denote the streamwise and spanwise periodicity of the channel domain, respectively, and
 $l, m$
are integer indices. Each Fourier mode is characterised by its streamwise (
 $k_x = l \, 2 \pi / L_x$
) and spanwise wavenumber (
 $k_z = m \, 2\pi / L_z$
), which together form the wavenumber vector
 $\boldsymbol{\kappa } = (k_x, k_z)^{\intercal }$
with magnitude
 $\kappa = \lVert \boldsymbol{\kappa } \rVert$
. Individual Fourier modes will be referred to as
 $\hat {q}(l, m, y, t)$
or
 $\hat {q}_{\boldsymbol{\kappa }}(y, t)$
.
Most of the analysis in subsequent sections will focus on the complex-valued Fourier coefficients
 $\hat {q}_{\boldsymbol{\kappa }}(y,t)$
, which have an amplitude
 $\lvert \hat {q}_{\boldsymbol{\kappa }}(y,t) \rvert$
and phase
 $\angle \hat {q}_{\boldsymbol{\kappa }}(y,t)$
. In particular, we will represent the wall transpiration as a superposition of Fourier modes with coefficients
 $\hat {v}_{\boldsymbol{\kappa }}(y_w, t)$
. Our aim is to understand how changes of the transpiration phase
 $\angle \hat {v}_{\boldsymbol{\kappa }}(y_w, t)$
at specific length scales
 $\boldsymbol{\kappa }$
alter the wall pressure, the phase relation between
 $\hat {p}_{\boldsymbol{\kappa }}$
and
 $\hat {v}_{\boldsymbol{\kappa }}$
and the flow response.
2.3. Wall transpiration
The idealised wall transpiration is set by the varying-phase opposition control scheme (1.2). There is some ambiguity in the control law as to which shift-invariant coordinates are transformed to the Fourier domain. For the present study, we Fourier transform the streamwise and spanwise direction but retain the time dependency, as outlined in § 2.2. This is different from previous resolvent analyses, which also transformed the temporal coordinate (see, e.g. Luhar et al. Reference Luhar, Sharma and McKeon2014b ). The appropriate form of the varying-phase opposition control law in non-dimensional form is then given by
 \begin{equation} \hat {v}_{\boldsymbol{\kappa }}(y_w, t) = - \hat {A}_d \, \hat {v}_{\boldsymbol{\kappa }}(y_d, t) .\end{equation}
The complex-valued controller gain
 $\hat {A}_d$
is constrained by Hermitian symmetry, but can otherwise be an arbitrary function of
 $\boldsymbol{\kappa }$
. Its phase
 $\angle \hat {A}_d$
alters the phase of the wall transpiration relative to the sensor signal
 \begin{equation} \angle \hat {v}_{\boldsymbol{\kappa }}(y_w, t) = \angle \hat {A}_{d} + \angle \hat {v}_{\boldsymbol{\kappa }}(y_d, t) + \pi \end{equation}
and will be referred to as phase shift hereafter. Note that the additional
 $\pi$
phase in (2.4) is due to the minus sign in (2.3).
In the physical domain, the phase shift corresponds to a scale-dependent spatial shift of magnitude
 $\angle \hat {A}_d / \kappa$
along the direction
 $\boldsymbol{\kappa } / \kappa$
. The most general form of
 $\hat {A}_d$
therefore introduces a scale-dependent streamwise and spanwise shift between the sensor measurement and actuator response. Previous opposition control studies have shown that even small spanwise misalignments between the sensor and actuator can lead to a drag increase (Chung & Sung Reference Chung and Sung2003). To preclude deteriorating effects from spanwise shifts, we seek a specific definition of
 $\hat {A}_d$
that introduces streamwise shifts only. A suitable definition is
 \begin{equation} \hat {A}_d = \begin{cases} 0 & \text{if } k_x = k_z = 0, \\ 1 & \text{if } k_x=0, k_z \neq 0, \\ e^{i \angle \hat {A}_d} & \text{if } k_x \gt 0, k_z=0, \\ \dfrac {\min (\lvert \hat {v}_{\boldsymbol{\kappa }}(t, y_d) \rvert , \lvert \hat {v}_{\tilde {\boldsymbol{\kappa }}}(t, y_d) \rvert )}{\lvert \hat {v}_{\boldsymbol{\kappa }}(t, y_d)\rvert } e^{i \angle \hat {A}_d} & \text{if } k_x \gt 0, k_z \neq 0,\end{cases} \end{equation}
where
 $\tilde {\boldsymbol{\kappa }} = (k_x, -k_z)^{\intercal }$
and controller gains for negative
 $k_{x}$
are omitted since they are determined by Hermitian symmetry.
The correspondence between phase shift and streamwise shift is clear for
 $k_{z} = 0$
, but perhaps less evident for modes with streamwise and spanwise dependence (last line in (2.5)). To illustrate the correspondence for these modes, consider the sensor signal at a specific
 $\boldsymbol{\kappa }$
, which can be written as
 $\hat {v}_{\boldsymbol{\kappa }}(y_{d},t) = A_{1} e^{i \phi _{1}}$
, and the sensor signal at
 $\tilde {\boldsymbol{\kappa }}$
, which is denoted by
 $\hat {v}_{\tilde {\boldsymbol{\kappa }}}(y_{d},t) = A_{2} e^{i \phi _{2}}$
. The amplitudes (
 $A_1$
and
 $A_2$
) and phases (
 $\phi _1$
and
 $\phi _2$
) may be different instantaneously, and for the following discussion, we assume that
 $A_2 \gt A_1$
without loss of generality. Applying the control law (2.3) with
 $\hat {A}_d$
according to (2.5), and evaluating (2.2) at
 $\boldsymbol{\kappa }$
,
 $\tilde {\boldsymbol{\kappa }}$
, and their complex conjugates gives the physical flow structure of the wall transpiration at length scale
 $\boldsymbol{\lambda } = (\lambda _x, \lambda _z)^{\intercal } = (2 \pi / k_x, 2 \pi / k_z)^{\intercal }$
:
 \begin{equation} v_{\boldsymbol{\lambda }}(x,y_{w},z,t) = - 4 A_{1} \cos \left ( k_{x} \left (x + \frac {\angle \hat {A}_{d}} {k_{x}} \right ) + \frac {\phi _{1} + \phi _{2}}{2} \right ) \, \cos \left ( k_{z} z + \frac {\phi _{1} - \phi _{2}}{2} \right )\! .\end{equation}
The factor multiplying the phase shift in the last line of (2.5) is central to the derivation of (2.6) in two regards: first, it selects the smaller of
 $A_1$
and
 $A_2$
to generate the wall transpiration, and second, it enforces the same transpiration amplitude at
 $\boldsymbol{\kappa }$
and
 $\tilde {\boldsymbol{\kappa }}$
. The equal amplitude suppresses oblique structures, for which the phase shift would correspond to a streamwise and spanwise shift along the direction
 $\boldsymbol{\kappa } / \kappa$
in the wall-parallel plane. Interested readers may refer to Toedtli et al. (Reference Toedtli, Luhar and McKeon2019a
), Toedtli (Reference Toedtli2021) for further details on the choice of the controller gain. From here on, it is implied that
 $\hat {A}_d$
of varying-phase opposition control is defined according to (2.5).
Interpretation of the phase shift as a streamwise shift in physical domain. The black curve represents an example sensor measurement, while the red curve shows the actuator response for two example phase shifts.

Equation (2.6) demonstrates that each Fourier coefficient generates a building block of the wall transpiration, whose streamwise location can be altered through
 $\angle \hat {A}_d$
. Figure 1 illustrates the relative position of sensor measurement (black curve) and actuator response (red curve) for two different phase shifts. Classical opposition control and varying-phase opposition control with
 $\angle \hat {A}_{d} = 0$
generate an actuator response that is exactly out-of-phase with the sensor measurement, as shown in figure 1(a). In contrast, the sensor signal and actuator response not only differ by a sign, but are offset in the streamwise direction if
 $\angle \hat {A}_d \neq 0$
. Negative phase shifts correspond to a lead of the actuation relative to the sensor measurement, while positive phase shifts imply a lag of the actuation. Figure 1(b) illustrates the relative arrangement for
 $\angle \hat {A}_d = -\pi / 2$
, which corresponds to a quarter wavelength lead of the actuation over the sensor measurement. It is important to emphasise again that the interpretation of
 $\angle \hat {A}_d$
according to (2.6) and figure 1 is only valid if
 $\hat {A}_d$
is defined according to (2.5).
Under this restriction, the physical meaning of
 $\angle \hat {A}_d$
suggests an alternative interpretation of varying-phase opposition control, which we adopt for this study: the control scheme can be interpreted as a way to prescribe a wall transpiration based on templates that occur naturally in the flow, namely
 $\hat {v}_{\boldsymbol{\kappa }}(y_{d})$
, and to change the relative streamwise phase between transpiration and background flow by altering
 $\angle \hat {A}_d$
. In this spirit, we use the varying-phase opposition control scheme to generate an idealised wall transpiration and study its coupling to the wall pressure and assess its effectiveness as a diagnostic for drag change.
As mentioned in the introduction, the varying-phase opposition control scheme is related to the work of Lee (Reference Lee2015) and Guseva & Jiménez (Reference Guseva and Jiménez2022), who studied classical opposition control with streamwise shifts between sensor measurement and actuator response. Despite conceptual similarities, these controllers are different from the current one in two important ways: first, they apply a constant phase shift in physical space, which corresponds to a scale-dependent phase shift in Fourier domain; and second, unlike the present controller, they do not suppress oblique waves in the actuation input.
2.4. Direct numerical simulation
The flow response to varying-phase opposition control is studied by means of DNS. The DNS solves the incompressible Navier–Stokes equations (2.1) in velocity--vorticity form (also known as poloidal--toroidal decomposition) following the method of Kim, Moin & Moser (Reference Kim, Moin and Moser1987). The streamwise and spanwise coordinates are discretised by a Fourier pseudospectral method, while the wall-normal direction uses a compact finite difference scheme on a stretched sinusoidal mesh (see Flores & Jiménez Reference Flores and Jiménez2006 for details). The stretching of the wall-normal grid is non-uniform in
 $y$
and controlled by a single parameter, analogous to the approach described in Lee & Moser (Reference Lee and Moser2015). A Runge–Kutta scheme with implicit viscous terms integrates the state variables in time. The controller is implemented by replacing the no-throughflow condition by the varying-phase opposition control scheme (2.3) at each time step.
The channel is driven by a constant mass flow rate, which implies that
 ${\textit{Re}}_b = 5600$
is fixed. The size of the computational domain in the streamwise and spanwise direction is
 $L_x = 4 \pi$
and
 $L_z = 2 \pi$
, respectively, and
 $N_x = N_z = 256$
Fourier modes are used in these directions. This corresponds to a resolution of
 $\Delta x^+ \approx 8.8$
and
 $\Delta z^+ \approx 4.4$
in terms of Fourier modes before dealiasing.
 $N_y = 172$
grid points are used in the wall-normal direction, which gives a resolution of
 $\Delta y^+_{\textit{min}} \approx 0.37$
at the wall and
 $\Delta y^+_{\textit{max}} \approx 3.09$
at the channel centre. All control runs are started from the same initial condition, and statistics are collected over at least
 $10$
eddy turnover times (
 ${h}^{\star } / {u}^{\star }_\tau )$
once a statistically steady state is reached. Figure 2(a) shows a validation of the DNS solver against data of Lee & Moser (Reference Lee and Moser2015) for a canonical turbulent channel flow at
 $({\textit{Re}}_{\tau })_0 = 180$
. The wall-normal velocity statistics are averaged over symmetric planes in the bottom and top half of the channel, and the results are shown for the lower channel half (
 $-1 \leqslant y \leqslant 0$
) only. The two curves collapse at all wall-normal locations and demonstrate that the solver settings are adequate.
Validation of the present DNS and pressure Poisson equation solver (solid lines) against the data of Lee & Moser (Reference Lee and Moser2015) (open circles) for a canonical channel flow at
 $({\textit{Re}}_{\tau })_0 = 180$
.

2.5. Pressure Poisson equation
The pressure field in a channel flow is a superposition of the mean pressure gradient (
 $G_{x}(t)$
) and turbulent pressure fluctuations (
 $p(x,y,z,t)$
). Only the pressure fluctuations are relevant for the subsequent analysis and the term pressure will always refer to
 $p$
only. The pressure fluctuations cancel out when the Navier–Stokes equations are written in the velocity--vorticity form that underlies the DNS. We therefore recover the pressure fluctuations in a post-processing step by solving a Poisson equation of the form
 \begin{equation} \frac {\partial ^2 p}{\partial x_i \, \partial x_i} = - \frac {\partial u_j}{\partial x_k} \frac {\partial u_k}{\partial x_j}. \end{equation}
The pressure fluctuations are assumed to be periodic in
 $x$
and
 $z$
and the Neumann problem for the pressure field is solved based on the arguments presented by Gresho & Sani (Reference Gresho and Sani1987). The boundary conditions in
 $y$
are obtained from evaluating the wall-normal momentum equation at
 $y_{w}$
, which results in
 \begin{equation} \frac {\partial p}{\partial y}(y_w) = \frac {1}{{\textit{Re}}_b} \frac {\partial ^2 v}{\partial x_j \, \partial x_j}(y_w) - \frac {\partial v}{\partial t}(y_w) \equiv \begin{cases} P_b & \text{if } y_w = -1, \\ P_t & \text{if } y_w = +1 ,\end{cases} \end{equation}
for a no-slip wall with transpiration. In (2.8),
 $P_b$
and
 $P_t$
are shorthand for the boundary conditions at the bottom and top wall, respectively. Further note that the transpiration adds inertial and viscous terms that are not preset in canonical flows.
The Poisson equation (2.7) is linear in
 $p$
and the superposition principle applies. The pressure can be split into three components by considering the homogeneous solution in isolation and separating the inhomogeneous solution into a part with linear and nonlinear source terms (the notion of linearity is in terms of the velocity fluctuations
 ${u}^{\prime }_i$
about a spatio-temporal mean
 $\overline {u}$
). The contributions are usually referred to as fast (
 $p_{f}$
, linear source term), slow (
 $p_{s}$
, nonlinear source term) and Stokes pressure (
 $p_{St}$
, homogeneous term), respectively, and are defined as (see, e.g. Kim Reference Kim1989)
 \begin{equation} \begin{aligned} \frac {\partial ^2 p_f}{\partial x_i \, \partial x_i} &= - 2 \frac {{\textrm{d}} \overline {u}}{{\textrm{d}} y} \frac {\partial {v}^{\prime }}{\partial x}, && \frac {\partial p_f}{\partial y}(y_w) = 0, \\ \frac {\partial ^2 p_s}{\partial x_i \, \partial x_i} &= - \frac {\partial {u}^{\prime }_j}{\partial x_k} \frac {\partial {u}^{\prime }_k}{\partial x_j}, && \frac {\partial p_s}{\partial y}(y_w) = 0 ,\\ \frac {\partial ^2 p_{St}}{\partial x_i \, \partial x_i} &= 0, && \frac {\partial p_{St}}{\partial y} (y_w) = \frac {1}{{\textit{Re}}_b} \frac {\partial ^2 v}{\partial x_j \, \partial x_j}(y_w) - \frac {\partial v}{\partial t}(y_w) .\end{aligned} \end{equation}
Note that
 $\overline {v} = \overline {w} = 0$
, so that
 $v^{\prime } = v$
and
 $w^{\prime } = w$
above. Furthermore,
 $p = p_{f} + p_{s} + p_{St}$
, and we will sometimes refer to
 $p$
as the total pressure in order to distinguish it from its components. The decomposition of (2.9) is by no means the only possible one, but it will turn out to be useful in the subsequent analysis.
The pressure Poisson equation is solved using Fourier transforms in
 $x$
and
 $z$
, which reduces each equation in (2.9) to ordinary differential equations in
 $y$
with known analytical solutions. The Stokes pressure (homogeneous solution) at
 $\kappa \neq 0$
is given by
 \begin{equation} \hat {p}_{\boldsymbol{\kappa }, St}(y) = \frac {1}{\kappa \sinh (2 \kappa )} \big(\hat {P}_t \cosh [ \kappa (y+1) ] - \hat {P}_b \cosh [ \kappa (y-1) ] \big), \end{equation}
where
 $\hat {P}_{b}$
and
 $\hat {P}_{t}$
are the Fourier transforms of (2.8). The solution for the inhomogeneous fast and slow pressure equations at
 $\kappa \neq 0$
can be written in terms of a Green’s function, i.e.
 \begin{equation} \hat {p}_{\boldsymbol{\kappa }, \{f/s \}}(y) = \int _{-1}^{1} G(y, a) \hat {f}_{\{ f/s \}}(a) \, {\textrm{d}}a ,\end{equation}
where
 $\hat {f}$
is the Fourier transform of the respective inhomogeneous source term in (2.9) and
 $G(y,a)$
is the Green’s function kernel (see, e.g. Kim Reference Kim1989 for further details):
 \begin{equation} G(y, a) = \begin{cases} - \displaystyle\frac {\cosh [ \kappa (a - 1) ] \cosh [\kappa (y + 1) ]}{\kappa \sinh ( 2 \kappa )} & \text{for } y \lt a,\\[9pt] - \displaystyle\frac {\cosh [\kappa (a + 1)] \cosh [\kappa (y - 1)]}{\kappa \sinh ( 2 \kappa )} & \text{for } y \gt a .\end{cases} \end{equation}
A few aspects of the limiting behaviour are worthwhile noting. The difference
 $\hat {P}_t - \hat {P}_b$
, and, therefore, also
 $\partial _t (\hat {v}_{\boldsymbol{\kappa }}(y=-1) - \hat {v}_{\boldsymbol{\kappa }}(y=1))$
, must scale like
 ${\mathcal{O}}(\kappa ^2)$
or smaller for the Stokes pressure to be bounded as
 $\kappa \rightarrow 0$
. The Stokes and fast pressure vanish in the limit
 $\kappa = 0$
, and the wall-parallel mean of the slow pressure can be obtained by integrating (2.9) twice in the wall-normal direction, yielding
 \begin{equation} \hat {p}_{\boldsymbol{0},s} (y) = P_c - \langle v^{\prime } v^{\prime } \rangle _{xz}(y), \end{equation}
where
 $P_c$
is an undefined constant and
 $\left \langle \boldsymbol{\cdot }\right \rangle _{xz}$
denotes the wall-parallel average. The same result is obtained if the wall-normal momentum equation is averaged in the streamwise and spanwise direction and integrated in
 $y$
(see, e.g. Tennekes & Lumley Reference Tennekes and Lumley1972).
We further note that the numerator and denominator in (2.10) and (2.12) can lead to floating point overflow for sufficiently large
 $\kappa$
, but this issue can be remedied by rewriting the expressions in terms of exponentials. The Stokes pressure can then be calculated directly from the analytical solution (2.10), while the fast and slow pressure are obtained by numerically integrating (2.11) using the trapezoidal rule on the DNS wall-normal grid. Figure 2(b) shows a validation of the pressure solver against the data of Lee & Moser (Reference Lee and Moser2015) for a canonical turbulent channel flow at
 $({\textit{Re}}_{\tau })_0 = 180$
. The two curves collapse at all wall-normal locations, which confirms the adequacy of the solver and settings.
3. Drag reduction and transpiration structure
We first consider the structure of the wall transpiration and its effect on the flow. Section 3.1 describes the global drag change for varying-phase opposition control with various
 $\angle \hat {A}_d$
and sensors located at
 $y_d^+ = 15$
. The transpiration structures of three example controlled flows are discussed in § 3.2 and reveal the imprint of two families of spatial scales. Section 3.3 shows that each scale family is suppressed or amplified by the control, depending on
 $\angle \hat {A}_d$
. Finally, § 3.4 together with Appendix A show that each scale mainly responds to changes in its own transpiration boundary condition, which implies that the overall flow response can be understood as a superposition of the two scale families. We note that portions of §§ 3.1, 3.2 and 3.4 have appeared in previous publications by the same authors (Toedtli et al. Reference Toedtli, Luhar and McKeon2019a
, Reference Toedtli, Yu and McKeon2020; Toedtli Reference Toedtli2021). These earlier results are revisited and reorganised here to establish the foundation for the novel findings presented in the remainder of this and the following sections.
3.1. Global drag change
The global drag change
 $\Delta D$
is defined as the change in friction coefficient
 $c_{f}$
under control
 \begin{equation} \Delta D = 1 - \underbrace {\frac {(c_{f})_{c}}{(c_{f})_{0}}}_{\equiv \xi }; \quad c_{f} = \frac {{\tau }^{\star }_w}{\frac {1}{2} {\rho }^{\star } ({U}^{\star }_b)^2} .\end{equation}
Positive values of
 $\Delta D$
indicate drag reduction, while negative values represent drag increase. In order to characterise the drag change, it is sufficient to keep track of the friction coefficient ratio
 $\xi$
, which is interpreted as
 \begin{equation} \xi \in \begin{cases} [0, 1) & \text{drag reduction (smaller is better)} ,\\ (1, \infty ) & \text{drag increase (larger is worse)}, \end{cases} \end{equation}
and the drag is unchanged if
 $\xi = 1$
. We use
 $\Delta D$
and
 $\xi$
interchangeably throughout this paper, with an emphasis on
 $\xi$
for qualitative visualisations and
 $\Delta D$
for quantitative statements. It is important to point out that
 $\Delta D$
does not account for the work done by the actuation. Equation (3.1) does therefore not quantify energetic savings, but rather categorises the flow response into two broad classes, namely a drag-reducing (
 $\xi \lt 1)$
and a drag-increasing (
 $\xi \gt 1$
) one.
Drag reduction of varying-phase opposition control with sensors located at
 $y_d^+ = 15$
. Filled symbols inside the green-shaded area indicate drag reduction (
 $\xi \lt 1$
), while open symbols in the red region indicate unchanged or increasing drag (
 $\xi \geqslant 1$
). The area inside the black square in figure 3(a) is magnified in figure 3(b).

Varying-phase opposition control with
 $\angle \hat {A}_d$
according to (2.5) has two parameters, the sensor location (
 $y_d$
) and phase shift (
 $\angle \hat {A}_d$
). The present study focuses on the role of the phase shift. We therefore fix
 $y_d^+ = 15$
, which corresponds to a sensor location with a strong flow response (see Toedtli et al. Reference Toedtli, Luhar and McKeon2019a
for details) and vary the phase shift over its entire range
 $\angle \hat {A}_d \in [-\pi , +\pi ]$
. The associated drag change in terms of
 $\xi$
is shown by the orange circles in figure 3(a) (entire parameter range) and figure 3(b) (detailed view of the black square in figure 3
a). Filled symbols in the green-shaded area indicate drag reduction (
 $\xi \lt 1$
), while open symbols in the red-shaded region denote unchanged or increasing drag (
 $\xi \geqslant 1$
). The data clearly show that the drag change strongly depends on the phase shift of the wall transpiration. Small negative phase shifts lead to drag reduction, while positive or large negative phase shifts result in drag increase. In particular, the drag increase at
 $\angle \hat {A}_d = \pm \pi$
(which corresponds to positive control feedback) was so pronounced that the simulations diverged at the current resolution and, therefore, no data point is plotted at this phase shift.
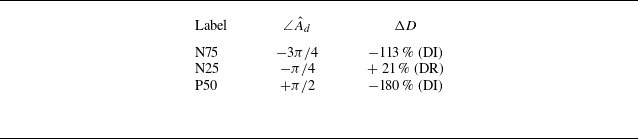
In the following sections, we analyse the three example controllers listed in table 1 in detail and use their labels (e.g. N25) to refer to a specific configuration. Controller N25 leads to 21 % drag reduction, which is the largest drag reduction over the
 $\{y_d, \angle \hat {A}_d\}$
parameter range considered by Toedtli et al. (Reference Toedtli, Luhar and McKeon2019a
). The remaining two example configurations lead to a drag increase of 113 % (N75) and 180 % (P50), respectively. Two drag-increasing example controllers are chosen to investigate if the physical mechanisms that drive the flow response are different for positive and negative
 $\angle \hat {A}_d$
.
Parameters for example controllers. Positive values of
 $\Delta D$
indicate drag reduction (DR), while negative values represent drag increase (DI). In all cases, the sensors are located at
 $y_d^+ = 15$
.

(a,c,e) Instantaneous spatial structure of the transpiration
 $v^+(y_w)$
at the wall. (b,d,f) Time-averaged actuation spectrum
 $\varPhi _{vv}^+(y_w)$
. The green contour lines denote
 $\varPhi _{{vv}}^+ / \max (\varPhi _{{vv}}^+) = (0.15, 0.3, 0.45)$
and the blue and red squares indicate the example spatial scales
 $\boldsymbol{\kappa }_s$
and
 $\boldsymbol{\kappa }_r$
, respectively.

3.2. Wall transpiration structure and scale families
Figures 4(a,c,e) show representative instantaneous snapshots of the wall transpiration for each example controller. These qualitative flow visualisations highlight two important aspects. First, the magnitude of the transpiration varies significantly with
 $\angle \hat {A}_d$
. For example, the control input of the drag-reducing configuration N25 is an order of magnitude smaller compared with the drag-increasing controllers N75 and P50 (note the logarithmic colour scale). A larger wall transpiration is therefore not necessarily beneficial in terms of drag reduction. The second observation is the different spatial structure of the transpiration for positive and negative phase shifts. The control input of controllers N25 and N75 consists of streamwise-elongated streaky structures and we observe larger, more coherent structures in the N25 case. In contrast, the transpiration of controller P50 exhibits little coherence in the streamwise direction and coherent patches instead occur at an angle to the mean flow or even oriented along the span.
The power spectra in figure 4(b,d,f) provide a statistical characterisation of the transpiration structure and confirm the observations from the instantaneous flow fields. The most energetic scales in the spectrum of N25 (figure 4
d) are streamwise-elongated (
 $k_x$
small and
 $k_x \lt k_z$
) and the peak occurs at
 $\boldsymbol{\kappa }_s = (k_x = 0.5, k_z = 11)^{\intercal }$
(or, equivalently,
 $\boldsymbol{\lambda }_s^+ = (\lambda _x^+ \approx 2260, \lambda _z^+ \approx 100)^{\intercal }$
), which is indicated by the blue square. Scales centred around
 $\boldsymbol{\kappa }_s$
are also the most active in configuration N75 (figure 4
b), but the energetic region extends to larger
 $k_x$
and
 $k_z$
, which confirms that this transpiration is more multi-scale than N25. The streamwise-elongated scales that dominate the actuator input at negative phase shifts define a first scale family, termed streak scales, with scale
 $\boldsymbol{\kappa }_s$
as a representative example. A scale family is loosely defined as a collection of spatial scales that lie close in spectral space and respond similarly to
 $\angle \hat {A}_d$
. The streak scales coincide with the near-wall cycle at the present
 ${\textit{Re}}_{\tau }$
, but their scaling with Reynolds number remains an open question.
In contrast, the most active scales in the spectrum of P50 (figure 4
f) are short in the streamwise direction and wide in the span. The peak occurs at
 $\boldsymbol{\kappa }_r = (k_x = 6.5, k_z = 0)^{\intercal }$
(or
 $\boldsymbol{\lambda }_r^+ = (\lambda _x^+ \approx 170, \lambda _z^+ \rightarrow \infty )^{\intercal }$
), which is marked by the red square. The short and wide scales that dominate the actuator input at positive phase shifts define a second scale family, termed roller scales, and
 $\boldsymbol{\kappa }_r$
is a representative example of this scale family. Conditional averaging shows that the short and wide scales correspond to spanwise rollers, which extend from the wall to
 $y^+ \approx 40$
. The eigenspectrum of the unforced Navier–Stokes equations can predict the onset and spatial structure of the spanwise rollers and suggests that they convect at
 ${c}^{\star } \approx 0.4 ( {U}^{\star }_c )_0 \approx 7.6 ( {u}^{\star }_{\tau } )_0$
(Toedtli et al. Reference Toedtli, Yu and McKeon2020). The spatial scale and convection speed of the rollers are comparable to those observed over riblets (
 $\lambda _x^+ \approx 150$
,
 $c^+ \approx 6-8$
; García-Mayoral & Jiménez Reference García-Mayoral and Jiménez2011; Endrikat et al. Reference Endrikat, Modesti, García-Mayoral, Hutchins and Chung2021), but smaller than those in the porous wall case (
 $\lambda _x^+ \approx 900$
,
 $c^+ \approx 5-8$
; Jiménez et al. Reference Jiménez, Uhlmann, Pinelli and Kawahara2001). The streak scales observed in cases N25 and N75 are not very pronounced in configuration P50, which underscores that the transpiration structure at positive and negative phase shifts is markedly different.
Additional visualisations and a more in-depth discussion of the controlled flow structure and scale families can be found in Toedtli et al. (Reference Toedtli, Yu and McKeon2019b ), Toedtli (Reference Toedtli2021). A key takeaway from these references is that the flow structures of the three example controllers differ not only near the wall, but throughout the entire channel.
3.3. Scale-by-scale drag change
The friction coefficient
 $c_f$
can be expressed as the sum of a laminar (
 $c_{f,l}$
) and a turbulent contribution (
 $c_{f,t}$
) (see (Fukagata, Iwamoto & Kasagi Reference Fukagata, Iwamoto and Kasagi2002) for details). The turbulent contribution results from a weighted wall-normal integral of the Reynolds stresses and can be further decomposed into scale-by-scale contributions
 $c_{f,t\boldsymbol{\kappa }}$
:
 \begin{equation} c_f = \underbrace {\frac {12}{{\textit{Re}}_b}}_{=c_{f,l}} + \underbrace {12 \int _{-1}^{1} y (\overline {{u}^{\prime } {v}^{\prime }}) \, {\textrm{d}} y}_{=c_{f,t}} = \frac {12}{{\textit{Re}}_b} + \sum _{k_x} \sum _{k_z} \underbrace {12 \int _{-1}^1 y \, {\textrm{Re}} \{ \hat {u}_{\boldsymbol{\kappa }} \hat {v}^{\ast }_{\boldsymbol{\kappa }} \} \, {\textrm{d}}y}_{=c_{f,t \boldsymbol{\kappa }}} ,\end{equation}
where
 ${\textrm{Re}}$
denotes the real part of a complex-valued quantity. This decomposition is valid as long as the assumptions outlined in Fukagata et al. (Reference Fukagata, Iwamoto and Kasagi2002) are met and the velocities are non-dimensionalised by twice the bulk velocity. The sign of
 $c_{f, t \boldsymbol{\kappa }}$
results from the phase relation between
 $\hat {u}_{\boldsymbol{\kappa }}$
and
 $\hat {v}_{\boldsymbol{\kappa }}$
across
 $y$
. In a canonical turbulent channel flow,
 $\hat {u}_{\boldsymbol{\kappa }}$
and
 $\hat {v}_{\boldsymbol{\kappa }}$
are out-of-phase on average for
 $y\leqslant 0$
(and vice versa for
 $y\gt 0$
), so that the scale-by-scale turbulent drag contribution is positive. Control alters
 $\hat {u}_{\boldsymbol{\kappa }}$
and
 $\hat {v}_{\boldsymbol{\kappa }}$
and possibly their relative arrangement, so that
 $c_{f, t \boldsymbol{\kappa }}$
of a controlled flow can in principle have either sign. A negative sign would imply that control fundamentally alters the phase relation between
 $\hat {u}_{\boldsymbol{\kappa }}$
and
 $\hat {v}_{\boldsymbol{\kappa }}$
so that the Reynolds stresses become an accelerating force.
Equation (3.3) can be used to decompose the drag change into scale-by-scale contributions
 $\Delta D_{\boldsymbol{\kappa }}$
, i.e.
 \begin{equation} \Delta D = \sum _{k_x} \sum _{k_z} \Delta D_{\boldsymbol{\kappa }};\! \quad \!\Delta D_{\boldsymbol{\kappa }} = \frac {( c_{f, t\boldsymbol{\kappa }})_0 - ( c_{f, t\boldsymbol{\kappa }})_c}{( c_f )_0} ,\end{equation}
where the laminar contribution
 $c_{f, l}$
of the uncontrolled and controlled flow cancel because the bulk Reynolds number is held constant. The scale-by-scale drag change provides an objective metric for scale suppression and amplification under control: a scale is said to be suppressed if
 $\Delta D_{\boldsymbol{\kappa }} \gt 0$
(i.e. the turbulent drag contribution decreases) and amplified if
 $\Delta D_{\boldsymbol{\kappa }} \lt 0$
(turbulent drag contribution increases). The top row of figure 5 shows the scale-by-scale drag change for the three example controllers, along with the spectral content of the actuation (solid green contours) and the uncontrolled turbulent drag (dashed black contour). The spectral regions of drag change and actuator input show significant overlap, which may suggest a correlation between the two. In configurations N25 and N75 the drag change is primarily driven by the streak scales, which carry significant turbulent drag in the uncontrolled flow. These streak scales are suppressed by controller N25 and amplified by N75. Note that the spectral signature of the actuation is similar in both cases, which highlights that the phase shift (streamwise position relative to the background flow) has a profound impact on the control response. In contrast, controller P50 amplifies both streak and roller scales.
Scale-by-scale drag change integrated over the entire channel height (top row), inner region (defined as
 $|y^+ - y_w^+| \leqslant 40$
, centre row), and outer region (
 $|y^+ - y_w^+| \gt 40$
, bottom row). The solid green contour lines denote
 $\varPhi _{{vv}}^+ / \max (\varPhi _{{vv}}^+) = (0.15, 0.3, 0.45)$
and are carried over from figure 4, while the black dashed contour outlines
 $(c_{f,t\boldsymbol{\kappa }})_0 / \max ((c_{f,t\boldsymbol{\kappa }})_0) = 0.15$
.

The scale-by-scale drag change spectra also provide insight into the challenges of achieving drag reduction. We found that
 $(c_{f, t \boldsymbol{\kappa }})_c \geqslant 0$
in configuration N25, which indicates that the present transpiration reduces or at best annihilates the scale-by-scale drag contribution and limits the achievable drag reduction. On the other hand,
 $(c_{f, t \boldsymbol{\kappa }})_c$
can be a multiple of
 $(c_{f, t \boldsymbol{\kappa }})_0$
in drag-increased flows and there is no apparent limit on how much control can amplify a scale. For example, the roller scales, which do not carry significant turbulent drag in a canonical flow, can be amplified by more than an order of magnitude. In addition, the effect of control is often non-uniform in spectral space (see, e.g. figure 5
a) and a highly amplified scale can cancel the effect of many weakly suppressed scales. For all these reasons, it is much more difficult to reduce drag than to increase it.
Thus far, the integral in the scale-by-scale turbulent drag reduction has been evaluated over the entire channel height. To highlight the near-wall effect of control, we split the integral into two parts: an inner part, which includes the region
 $|y^+ - y_w^+| \leqslant 40$
, and an outer part, which comprises the rest of the channel. This specific threshold is motivated by the earlier observation that spanwise rollers extend up to
 $y^+ \approx 40$
. The drag change spectra for the inner and outer region are shown in the centre and bottom row of figure 5. Across all controllers, the inner region accounts for approximately 53 % of the total drag change, while the outer region contributes 47 %. In the inner region, the drag change is most pronounced in spectral regions of large actuator input. For negative phase shifts, the inner-region drag change is similar to the global drag change. However, configuration P50 reveals distinct near-wall characteristics: the signature of the spanwise rollers is more pronounced, and control suppresses large streamwise scales at
 $k_x \approx 0.5$
. In contrast, the drag change in the outer region correlates less with actuator input and is confined to large streamwise and spanwise scales, which likely have wall-normal support throughout the channel. Interestingly, the drag change in the inner and outer region can oppose each other at specific scales. This is most apparent in configuration N25, where opposing trends weaken the net drag change at the example scale
 $ \boldsymbol{\kappa} _s$
, and in configuration P50, where large streamwise scales are suppressed in the inner region, but amplified in the outer.
3.4. Connection between transpiration phase shift and scale response
The drag change spectra of figure 5 suggest a correlation between actuator input and scale suppression or amplification. However, the drag change at scale
 $\boldsymbol{\kappa }$
cannot be directly attributed to the transpiration at the same scale, due to the nonlinear governing equations. Such a connection can only be established if possible nonlinear control effects are minimised. This can be achieved by restricting control to a single wavenumber, or to a small set of wavenumbers that are not triadically consistent. We refer to these controllers as scale-restricted controllers, and have analysed the flow response to two scale-restricted controllers: the first controller generates a transpiration at a small number of triadically inconsistent streak scales and the second one generates a transpiration with a single roller scale. The details of the scale-restricted controllers are summarised in Appendix A.
In the case of scale-restricted controllers, which minimise nonlinear control effects, the drag change at a controlled scale can be directly attributed to the transpiration at that scale. The controlled scales also drive the global drag change of the scale-restricted controllers, which is shown by the blue triangles (streak scales) and red squares (roller scale) in figure 3. Depending on the phase shift, scale-restricted varying-phase opposition control suppresses (
 $\lvert \angle \hat {A}_d \rvert \lesssim \pi / 4$
) or amplifies the streak scales (
 $\lvert \angle \hat {A}_d \rvert \gtrsim \pi / 2$
), which results in global drag reduction and increase, respectively. Note that the controller with
 $\angle \hat {A}_d = \pm \pi$
also diverged in this case. In contrast, scale-restricted varying-phase opposition control leaves the roller scale unaffected at negative phase shifts but significantly amplifies it at
 $\angle \hat {A}_d \in [+\pi / 4, +3 \pi / 4]$
, which leads to drag increase. These scale-restricted control experiments confirm that scale suppression and amplification are to a significant part tied to the transpiration and
 $\angle \hat {A}_d$
at that scale.
A comparison between the drag change of the scale-restricted and the full controller further suggests that the flow response to varying-phase opposition control can be understood from a superposition of the two scale families. The roller scales are inactive for
 $\angle \hat {A}_d \in [-\pi , +\pi / 4)$
and the flow response is fully determined by the streak scales, which reduce (small phase shifts) or increase (large positive or negative
 $\angle \hat {A}_d$
) the drag. Both scale families contribute to the drag increase at
 $\angle \hat {A}_d \in [+\pi / 4, 3 \pi / 4]$
, but the roller scales dominate due to the stronger flow response (compare the drag increase due to the two scale-restricted controllers in figure 3). The dominance of the roller scales for positive phase shifts is further consistent with the actuation spectra of figure 4. It is important to emphasise that the scale-restricted controllers act only on a subset of each scale family. The remaining members of the scale family contribute to the drag change of the full control scheme as well, and consequently, the drag change produced is larger compared with the scale-restricted controllers.
4. Wall pressure in the presence of transpiration
We next consider the properties of the wall pressure in the presence of transpiration. Section 4.1 explores the instantaneous and time-averaged structure of the wall pressure field and compares it to the transpiration structure. The pressure field is then decomposed into its fast, slow and Stokes components and the relative magnitude of the three components is studied in § 4.2. Following the approach from the previous section, the discussion focuses on the three example controllers in table 1.
(a,c,e) Instantaneous spatial structure of
 $p^+(y_w)$
. (b,d,f) Time-averaged wall pressure fluctuation spectrum
 $\varPhi _{pp}^+$
. The lines outline the levels
 $\varPhi _{qq}^+ / \max (\varPhi _{qq}^+) = (0.15, 0.3, 0.45)$
of
 $v$
(solid green lines, replotted from figure 4) and
 $p$
(dashed pink lines).

4.1. Wall pressure structure
The spatial structure of the wall pressure for the three example controllers is depicted in figures 6(a), 6(c) and 6(e). The time instant and location are identical to the earlier visualisations of the transpiration (figures 4 a, 4 c and 4 e). Similar to the earlier discussion of the transpiration, we observe differences in both magnitude and structure across the three example wall pressure fields. The wall pressure of the drag-reducing controller N25 (figure 6 c) features large-scale patches of positive and negative fluctuations, while that of the drag-increasing controllers figures 6(a) and 6(e) is more fragmented. The wall pressure of the drag-increasing controllers is also an order of magnitude larger compared with the drag-reducing case.
Figures 6(b), 6(d) and 6(f) shows the time-averaged power spectra of the wall pressure, with distinct levels outlined by the dashed pink lines. In addition, the green contour lines represent the spectral content of the actuator input (see figure 4) and the blue and red squares indicate the representative streak (
 $\boldsymbol{\kappa }_s$
) and roller scales (
 $\boldsymbol{\kappa }_r$
), respectively. The overall structure of the three wall pressure spectra is similar, with the most energetic region located at small streamwise and spanwise wavenumbers. The magnitude of the scale-by-scale contribution and the extent of the energetic scales depends strongly on
 $\angle \hat {A}_d$
, with drag-increasing configurations leading to more energetic wall pressure fluctuations (note the logarithmic colour scale) over a wider range of scales. This is, on average, the spectral analogue of the more intense and fragmented instantaneous wall pressure structures observed in figures 6(a) and 6(e).
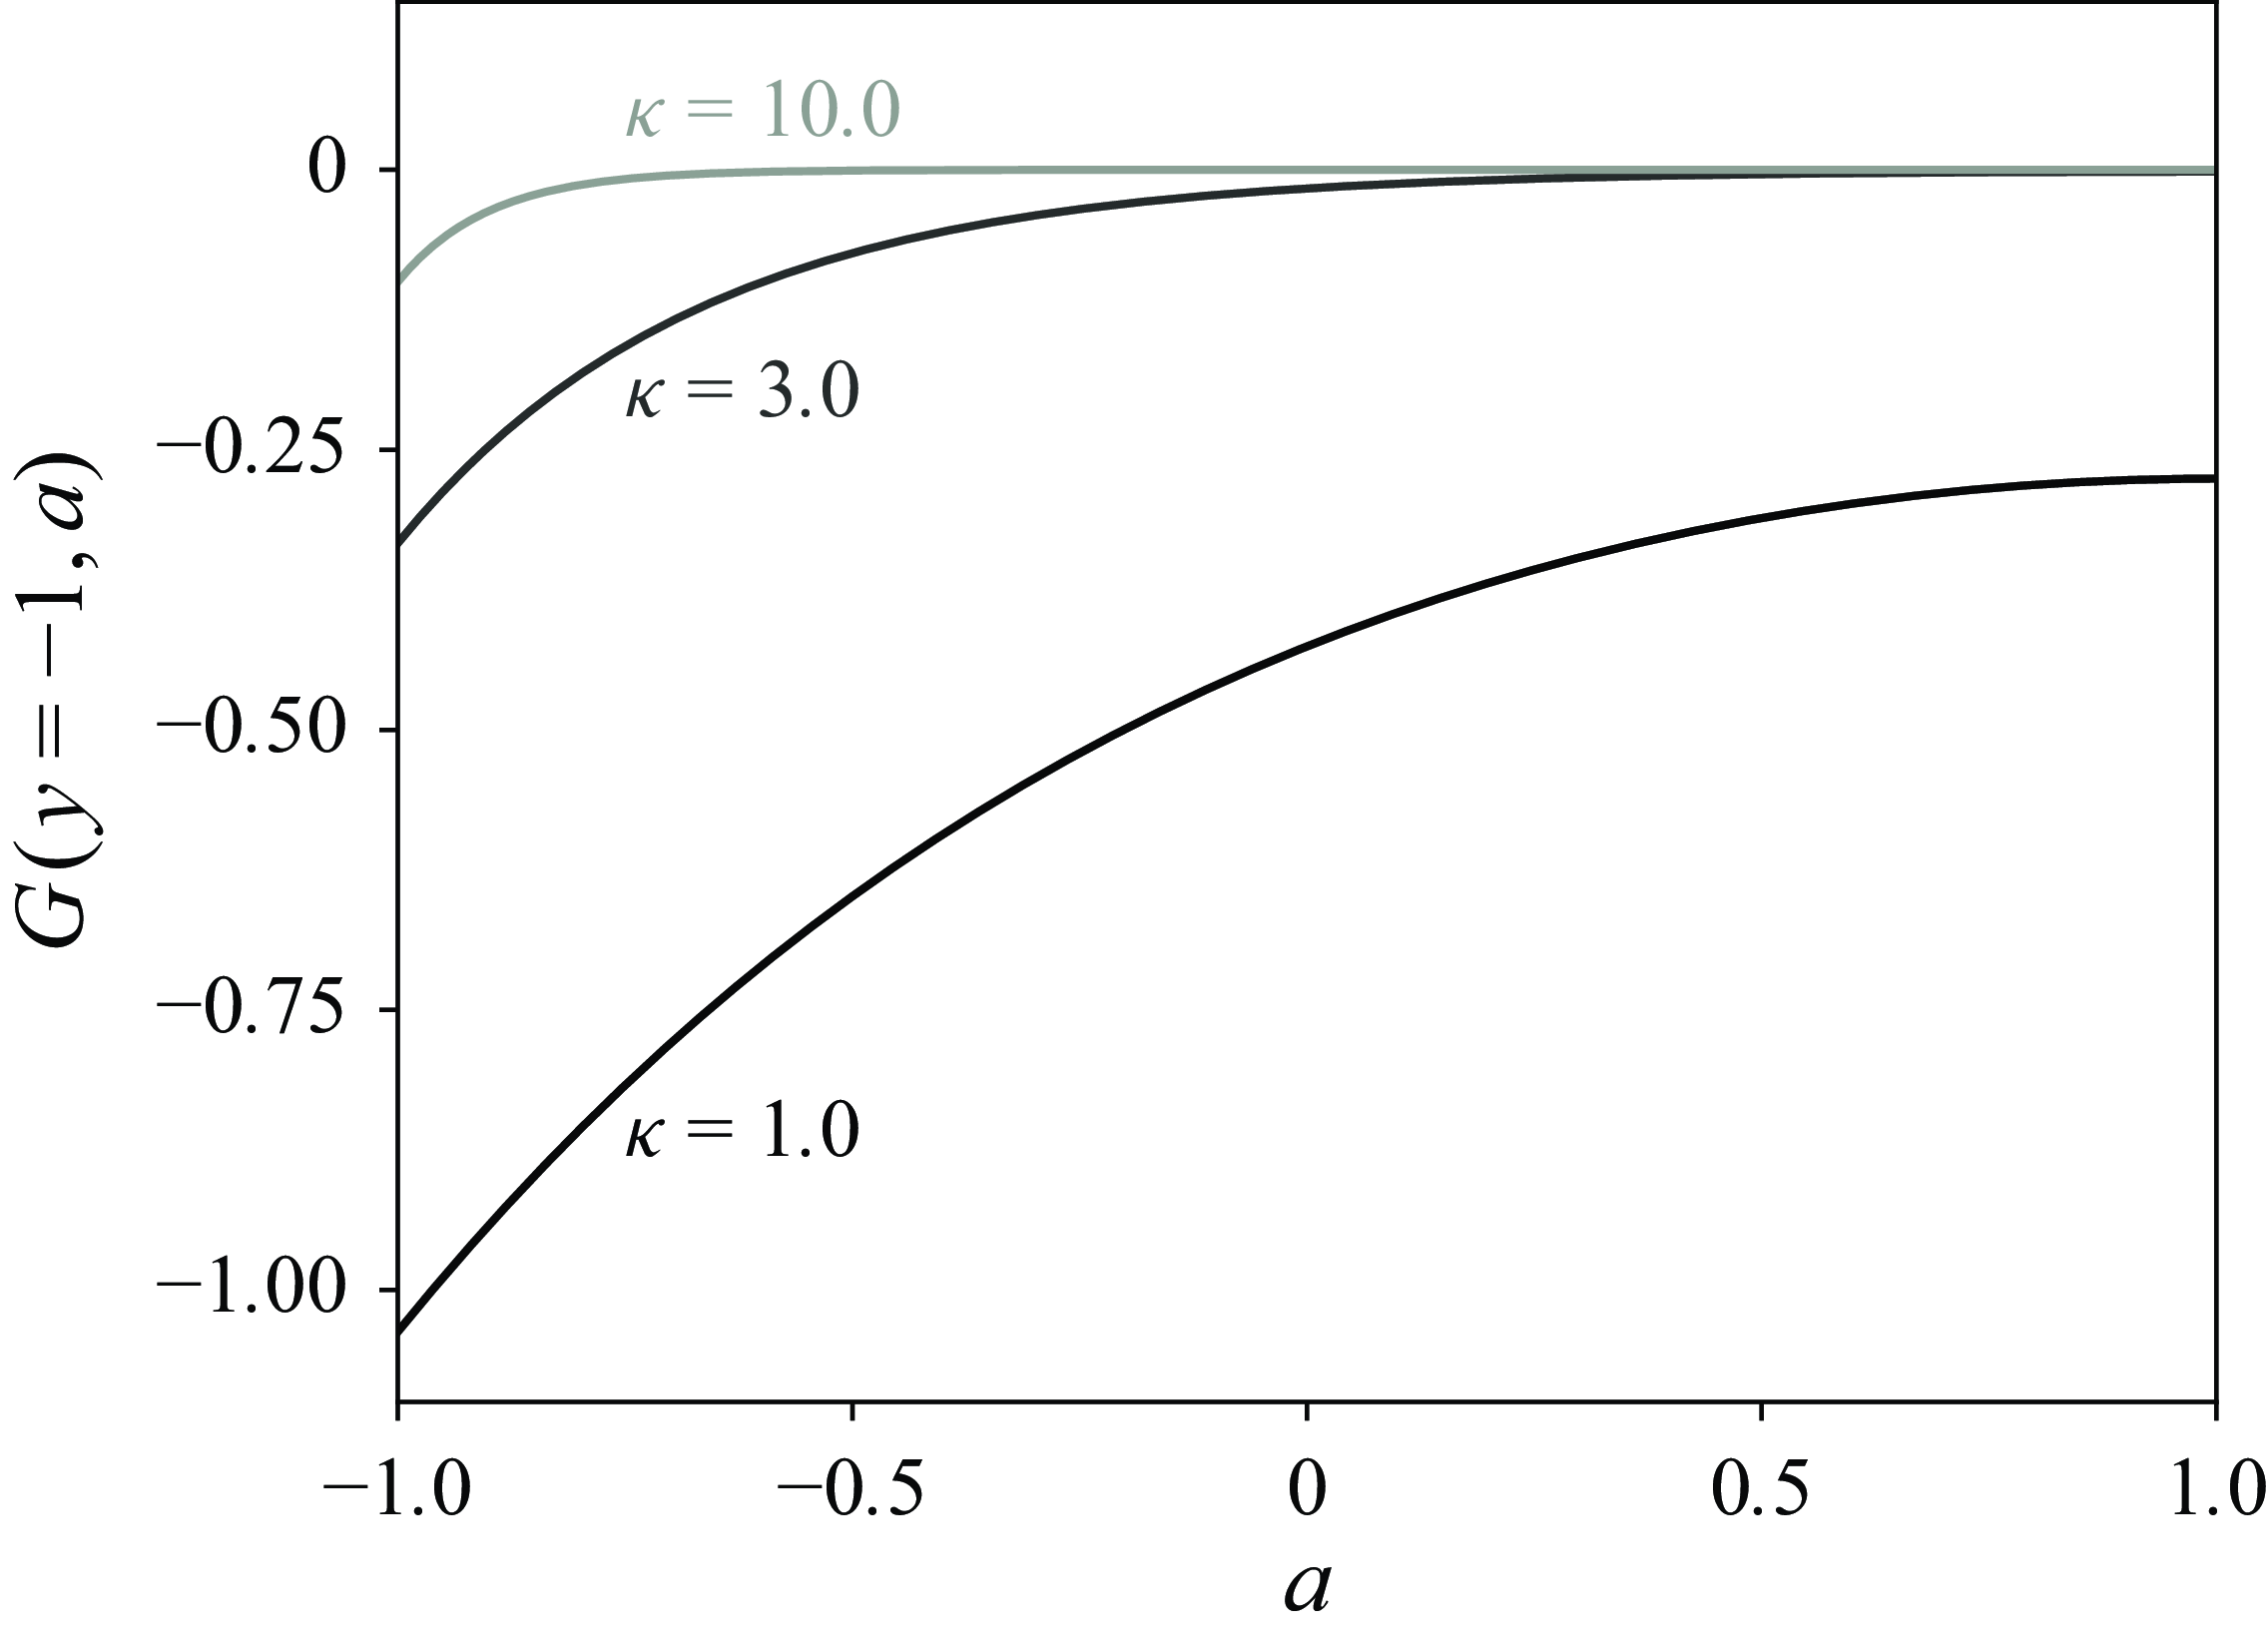
The Greens function solution, (2.10) and (2.11), provides some insight into the structure of the wall pressure spectra and their relation to the transpiration. The Green’s function kernel
 $G(y,a)$
is real-valued and only depends on the magnitude of the wavenumber vector,
 $\kappa$
. Different combinations of
 $k_x$
and
 $k_z$
with the same
 $\kappa$
thus have an identical
 $G(y,a)$
and example kernels for the wall pressure at various
 $\kappa$
are shown in figure 7. For increasing
 $\kappa$
, the wall-normal support of the Green’s function decreases and the maximum amplitude decreases like
 $1/\kappa$
. It is important to reiterate the observation of Kim (Reference Kim1989) that the Green’s function kernels for small
 $\kappa$
decrease slowly with
 $y$
and can be non-zero throughout the channel (see, e.g. the profile
 $\kappa = 1$
in figure 7). The slow decay implies a large domain of dependence in
 $y$
and can even introduce a mutual influence of the two walls. Similar observations apply to the Stokes pressure as well, but the details are omitted for the sake of brevity.
Example Green’s function kernels for the wall pressure (
 $y = -1$
) at various values of
 $\kappa$
. The Green’s function is plotted versus the integration variable
 $a$
.

The wall pressure spectra peak at low
 $k_{x}$
and
 $k_{z}$
, where the Green’s function kernels have the largest
 $y$
support. Regions far from the wall can thus potentially contribute to these maxima. Interestingly, the wall pressure spectra are a function of
 $k_x$
and
 $k_z$
, which is different from the
 $\kappa$
dependence of the Green’s function kernel. This dependence on
 $(k_x, k_z)$
must arise from the source terms (slow and fast pressure) and from the boundary conditions (Stokes pressure). One aspect that certainly contributes to the observed asymmetry is the fast pressure, whose source term contains an
 $x$
derivative that amplifies smaller streamwise scales (large
 $k_x$
) and damps larger ones (small
 $k_x$
). The edge case is
 $k_{x} = 0$
, where the fast pressure disappears all together. Consistent with this argument, the wall pressure spectra become less energetic as
 $k_x \rightarrow 0$
.
Likely for the same reason, actuation with streak scales does not generate a strong pressure response at low
 $k_x$
(figures 6
b and 6
d). In contrast, actuation with roller scales goes hand-in-hand with an increase in pressure signature at small
 $k_z$
, where the fast pressure source term is not damped. It is also interesting to note that the drag-increasing controllers increase the wall pressure in spectral regions beyond the actuator input. This hints at the importance of nonlinear interactions, either through the slow pressure or energy transfer across velocity scales.
4.2. Relative importance of the pressure components
Total variance (a,b,c) and example scale contribution (d,e,f) to the fast (dotted orange line), slow (dashed blue line) and Stokes pressure (dash-dotted purple line). The grey lines in figure 8(a) outline the reference profiles for a canonical turbulent channel flow at
 $({\textit{Re}}_{\tau })_0 = 180$
.

The discussion thus far has considered the total wall pressure field. Subsequent analyses will consider the pressure components (fast, slow and Stokes pressure) individually. Interpretation of these more finely partitioned data requires quantification of the relative importance of the pressure components, as shown in figure 8. The coloured lines in figure 8(a–c) show the total pressure component variance of the controlled flows, while the grey lines in figure 8(a) outline the reference profiles for a canonical turbulent channel flow without transpiration. The sum of the component variances at
 $y_w$
represents a subset of the terms in the Parseval identity and is thus related to the wall pressure spectra of figure 6. The relative magnitude of the pressure component fluctuations underscore again the earlier observations that drag-increasing controllers lead to larger pressure fluctuations at the wall compared with the drag-reducing configuration.
It is also apparent that wall transpiration changes the relative importance of the pressure components compared with a canonical turbulent channel flow. In the absence of transpiration, the slow pressure is larger than the fast one, except very near the wall, and the Stokes pressure is the smallest of the three components. The Stokes pressure further scales as
 $1/{\textit{Re}}_b$
and is therefore assumed negligible at high Reynolds numbers (see (2.10) and discussion in Kim (Reference Kim1989) for details). In contrast, the magnitude of the Stokes pressure becomes comparable to the other components close to the wall when the no-throughflow condition is relaxed, regardless of whether the drag is reduced or increased. This increase in magnitude occurs because the transpiration adds a leading-order inertial term (see (2.10)). The Stokes pressure in transpiration-based controlled flows can thus be leading order, possibly even at high Reynolds numbers. Moreover, the relative magnitude of the slow and fast pressure can change with transpiration. For example, the relative magnitude of the fast pressure decreases when the drag is reduced (figure 8
b) and increases when the drag is increased, especially near the wall. This is likely a consequence of control reducing or amplifying the wall-normal velocity (see spectra in figure 4), which enters the source term of the fast pressure.
The spatially averaged variances discussed thus far represent a sum over all spatial scales, but the relative importance of the pressure components can in principle vary from scale to scale. This aspect is explored in figure 8(d–f), which show the variance contributions of the relevant example scale (streak scale
 $\boldsymbol{\kappa }_s$
for negative
 $\angle \hat {A}_d$
and roller scale
 $\boldsymbol{\kappa }_r$
for positive
 $\angle \hat {A}_d$
) for each controller. A comparison between the top and bottom row demonstrates that the relative magnitude is indeed scale-dependent. For example, the fast pressure contributes most to the wall pressure when summed over all scales of configuration N75, but it is the smallest component at scale
 $\boldsymbol{\kappa }_s$
.
The scale-by-scale analysis further shows that the dominant pressure components change with
 $\angle \hat {A}_d$
and
 $\boldsymbol{\kappa }$
. For negative
 $\angle \hat {A}_d$
, the slow and Stokes pressure at
 $\boldsymbol{\kappa }_s$
are almost an order of magnitude larger at the wall compared with the fast pressure. It can therefore be expected that they determine the overall wall pressure signature at this scale. On the other hand, for positive
 $\angle \hat {A}_d$
, the fast and Stokes pressure are dominant at the scale
 $\boldsymbol{\kappa }_r$
. Figures 8(d) and 8(f) further show that the different relative importance occurs even when the transpiration magnitude is comparable. This suggests that the different drag increase mechanisms, amplification of the near-wall cycle for
 $\boldsymbol{\kappa }_s$
and generation of spanwise rollers for
 $\boldsymbol{\kappa }_r$
, lead to fundamentally different source terms for the pressure components and, therefore, to different relative magnitudes. Some aspects of this will be further explored in § 5.2.
5. Relative phase between wall pressure and transpiration
We next discuss the relative spatial arrangement between wall transpiration and pressure. Figure 9 shows the instantaneous pointwise product of the wall transpiration (figure 4
a,c,e) and pressure (figure 6
a,c,e) for configurations N25 (left) and P50 (right). Unlike the transpiration, which induces no net mass flux and, therefore, has a zero wall-parallel mean, the product
 $vp$
can have a non-zero
 $xz$
mean due to the modulation by the pressure. For example, the dominance of red patches in figure 9(a) suggests that
 $vp$
is on average positive for controller N25 (the figure only shows a subset of the
 $xz$
domain, but the observation is true for the entire wall). This indicates that
 $v$
and
 $p$
have locally the same sign at the wall, a configuration that will be referred to as in-phase subsequently. In contrast, the product is mostly negative for configuration P50 (figure 9
b), which implies that
 $v$
and
 $p$
have opposite signs (out-of-phase).
Instantaneous spatial structure of
 $p^+ v^+$
at the wall.

The following analysis explores the relative position of signed transpiration and pressure fluctuations for the three example control configurations in detail. We again take a Fourier perspective and quantify the instantaneous relative spatial arrangement in terms of the phase difference between wall pressure and transpiration at length scale
 $\boldsymbol{\kappa }$
:
 \begin{equation} \Delta \theta _{\boldsymbol{\kappa }}(t) = \angle \hat {p}_{\boldsymbol{\kappa }}(y_w, t) - \angle \hat {v}_{\boldsymbol{\kappa }}(y_w, t). \end{equation}
The phase difference
 $\Delta \theta _{\boldsymbol{\kappa }}$
is an example of so-called directional data and requires careful statistical characterisation. The appropriate notion of temporal mean, namely the circular mean, is introduced in Appendix B. Section 5.1 explores the structure of the Green’s function solution and identifies conditions for approximately steady phase differences, which are a prerequisite for a non-zero circular mean. Section 5.2 reports the phase difference statistics at the example scales
 $\boldsymbol{\kappa }_s$
and
 $\boldsymbol{\kappa }_r$
, while § 5.3 discusses the phase difference spectra for all scales. Section 5.4 finally explores the connection between phase difference and scale-by-scale drag change. The phase difference
 $\Delta \theta _{\boldsymbol{\kappa }}$
is further related to the kinetic energy of the flow and the interested reader can find an in-depth discussion of this aspect in Appendix C.
5.1. Phase of wall pressure components: domain of dependence
The present section analyses the structure of the Greens function kernel and the analytical Stokes pressure solution. The discussion focuses on the wall pressure and, in particular, on how its phase is established through the domain of dependence in the wall-normal direction and in spectral space. These observations apply to turbulent channel flows in general and will be applied to the example controlled flows in § 5.2 to make sense of the observed statistics.
The phase of the fast and slow wall pressure results from a convolution of the Green’s function kernel with the associated source term
 \begin{equation} \begin{aligned} \angle \hat {p}_{\boldsymbol{\kappa }, \{f/s\}}(y_w, t) &= \angle \left \lbrace \int _{-1}^{1} G(y_w, a) \hat {f}_{\{f/s\}}(a, t) \, {\textrm{d}} a \right \rbrace \\ &= \angle \left \lbrace \int _{-1}^{1} \lvert G(y_w, a) \hat {f}_{\{f/s\}}(a, t) \rvert e^{i (\angle \hat {f}_{\{f/s\}}(a,t) + \pi) } {\textrm{d}} a \right \rbrace\! .\end{aligned} \end{equation}
Recall from (2.12) that the Green’s function kernel
 $G(y,a)$
is real-valued and negative throughout the channel, which is reflected in the additional
 $\pi$
phase above. The integral expression in (5.2) shows that the phases of the fast and slow wall pressure are weighted wall-normal averages of
 $\angle \hat {f}_{\{f/s\}}(y)$
. The weight function is given by
 $\lvert G(y_w, a) \hat {f}_{\{f/s\}}(a) \rvert$
, and differs for the fast and slow pressure due to the different source terms (see (2.9)). Both weight functions have compact support in
 $y$
for sufficiently large
 $\kappa$
, since
 $G(y_w, a)$
is localised (see figure 7). The wall-normal support of the weight function for the fast pressure may be further restricted by the mean shear
 $S$
, which is part of the source term. This is especially relevant at low
 $\kappa$
when the magnitude of
 $G(y_w, a)$
decays slowly (see, e.g. the profile for
 $\kappa = 1$
in figure 7).
Despite their similarities in the wall-normal domain of dependence, the fast and slow pressure have very different spectral dependencies. The source term of the fast pressure is linear, which implies that
 $\hat {p}_{\boldsymbol{\kappa }, f}(y_w)$
and its phase only depend on the flow state at that same
 $\boldsymbol{\kappa }$
. Conversely, the source term of the slow pressure is nonlinear, so that its value and phase at the wall do not depend on the flow state at
 $\boldsymbol{\kappa }$
itself, but on all wavenumbers that are triadically consistent with
 $\boldsymbol{\kappa }$
. Approximately steady phase relations between wall transpiration and fast or slow pressure can result if the pressure source term correlates with
 $\hat {v}_{\boldsymbol{\kappa }}(y_w)$
over the wall-normal layer where the weight function is non-zero.
The Stokes pressure on the other hand is forced by the boundary condition. The relation is linear, which implies that
 $\hat {p}_{St,\boldsymbol{\kappa }}$
only depends on the flow state at that same wavenumber. For sufficiently large
 $\kappa$
, when the influence of one wall is negligible at the other, the Stokes pressure further depends on local wall information only. In general, the Stokes pressure is a complex function of the wall transpiration gradients (see (2.9) and (2.10)), which makes its analysis challenging. Substantial simplifications are possible if
 $\kappa$
is large enough, so that the two walls are approximately independent, and if the rate of change of the transpiration is large relative to the viscous terms. These assumptions are reasonable for a realistic flow and enable approximating the Stokes pressure at the lower wall as
 \begin{equation} \hat {p}_{\boldsymbol{\kappa },St}(y=-1, t) \approx - \frac {\hat {P}_{b}(t)}{\kappa \tanh (2 \kappa )} \approx \frac {1}{\kappa \tanh (2 \kappa )} \frac {\partial \hat {v}_{\boldsymbol{\kappa }}}{\partial t}(y=-1,t), \end{equation}
and a similar expression can be derived for the upper wall as well. The phase of the Stokes pressure then depends on the temporal frequency content of
 $\partial \hat {v}_{\boldsymbol{\kappa }}/ \partial t$
, i.e.
 \begin{equation} \angle \hat {p}_{\boldsymbol{\kappa }, St}(y_w, t) = \angle \left \lbrace \int _{-\infty }^{\infty } -i \omega \hat {v}_{\boldsymbol{\kappa }}(y_w, \omega ) \, e^{-i \omega t} \, {\textrm{d}} \omega \right \rbrace ,\end{equation}
where the the sign of the complex exponential in (5.4) is inverted relative to the Fourier series in (2.2), as is common practice in the stability literature. Approximately steady phase relations between wall transpiration and Stokes pressure can result if the temporal frequency content in (5.4) is sparse.
5.2. Phase difference at example scales
Histograms of the phase difference between wall pressure and transpiration. Each row corresponds to a different pressure component, and each column represents a specific combination of phase shift and scale. The red symbol indicates the circular mean.

This section focuses on spatial scales
 $\boldsymbol{\kappa }_s$
and
 $\boldsymbol{\kappa }_r$
in the regime where they are dynamically relevant. Select histograms of the phase difference
 $\Delta \theta _{\boldsymbol{\kappa }}$
are shown in figure 10. Each column represents a different control configuration and scale, while each row shows a different pressure component. The bin count of the phase difference is represented by the segment radius and the circular mean is indicated by the red circle. The histograms further give a sense for the spread about the mean value, even if the circular variance is not explicitly quantified.
The total pressure is the measurable quantity in experiments and real-world applications, which makes the associated phase difference
 $\Delta \theta _{\boldsymbol{\kappa }}$
the most relevant one. This phase difference is shown in the first row (yellow segments) of figure 10 and varies significantly across control configurations and spatial scales. For example, the mean phase difference at scale
 $\boldsymbol{\kappa}_s$
changes from a value of approximately
 $+\pi / 2$
for configuration N75 (left column) to
 $0$
(i.e. in-phase) for controller N25 (centre column). On the other hand,
 $v$
and
 $p$
in configuration P50 are out-of-phase at scale
 $\boldsymbol{\kappa}_r$
(right column). The spread about the circular mean is also different in each case. The spread is small for N25 and P50, making conclusions for these configurations statistically strong. On the other hand, the spread for N75 is much larger, which renders the interpretation of this controller more ambiguous. To understand the differences in mean values and spread between configurations, it is helpful to decompose the pressure into its components and study the associated phase relation separately. For each component, we can combine pressure source term data with the analytical insights from § 5.1 to explain the observed phase relations.
The second row of figure 10 (orange segments) shows the phase difference between fast pressure and wall transpiration
 $\Delta \theta _{\boldsymbol{\kappa },f}$
. An approximately steady phase difference with little temporal spread is established in all three cases and the mean phase difference appears to shift in tandem with
 $\angle \hat {A}_d$
. For example,
 $\overline {\Delta \theta }_{\boldsymbol{\kappa },f} \approx 0$
for controller N25 and increases to
 $\overline {\Delta \theta }_{\boldsymbol{\kappa },f} \approx 3\pi / 8$
for N75. It is also evident that all values in the time series are clustered around the circular mean, with the greatest spread observed for configuration N25. This robust phase relation is an immediate consequence of the control and the structure of the fast pressure solution: the opposition control scheme, (2.3), relates wall transpiration to sensor measurement and, thus, constrains the wall-normal profile of
 $\hat {v}_{\boldsymbol{\kappa }}$
between
 $y_w$
and
 $y_d$
. The phase of the fast pressure at the wall corresponds to a weighted average of
 $\angle \hat {v}_{\boldsymbol{\kappa }}$
according to (5.2). Since the weighting function decays quickly away from the wall, the phase of the fast wall pressure is determined by the wall-normal velocity in the constrained region, and a robust phase relation
 $\Delta \theta _{\boldsymbol{\kappa },f}$
can be established.
This point is illustrated in figure 11 for scale
 $\boldsymbol{\kappa }_s$
and controller N75 (small spread about circular mean, see figure 10
a) and N25 (larger spread, figure 10
b). For controller N75, the normalised weighting function (grey curve) is indeed close to zero for
 $y\gt y_d$
, demonstrating that the phase of the fast pressure at the wall is determined by
 $y \in [y_w, y_d]$
where
 $\angle \hat {v}_{\boldsymbol{\kappa }}$
is closely constrained. In contrast, the normalised weighting function of controller N25 is larger for
 $y\gt y_d$
, allowing the fast pressure at the wall to acquire phase from regions where
 $\angle \hat {v}_{\boldsymbol{\kappa }}$
is unconstrained. This leads to the larger spread observed in figure 10. It is important to note that both plots in figure 11 show the same spatial scale
 $\boldsymbol{\kappa }_s$
at two different
 $\angle \hat {A}_d$
. The Green’s function kernel is identical for the two cases and the difference in the weighting function comes from the mean shear, which is greater in the drag-increasing case. The phase relation between fast wall pressure and transpiration is thus particularly robust for small scales (due to the fast decay of the Green’s function kernel) or drag-increased flows (due to the large mean shear close to the wall), as confirmed by the histogram for scale
 $ \boldsymbol{\kappa} _r$
and controller P50.
Representative instantaneous phase profile
 $\angle \hat {v}$
(solid black line) and product of Green’s function kernel
 $G$
and mean shear
 $S$
normalised by the maximum value (solid grey line). The two plots show the same spatial scale
 $\boldsymbol{\kappa }_s$
at different
 $\angle \hat {A}_d$
.

The phase difference between slow pressure and transpiration
 $\Delta \theta _{\boldsymbol{\kappa }, s}$
(blue segments in the third row) shows significant variation in all cases. The three circular means have similar values, but their significance is likely reduced due to the large variance. This large variance is again a consequence of the Green’s function structure. The source term of the slow pressure is the divergence of the nonlinear advection term. The nonlinearity can further be split into an irrotational and solenoidal part, each of which has a distinct dynamical role (Chorin & Marsden (Reference Chorin and Marsden1993). Only the irrotational component enters the source term of the slow pressure and determines the nonlinear effects in the pressure field. The solenoidal part, on the other hand, governs the nonlinear effects in the evolution of the velocity field and represents the forcing in input--output formulations of the Navier–Stokes equations (McKeon & Sharma Reference McKeon and Sharma2010). Due to the quadratic form of the nonlinearity, the source term of the slow pressure depends on all scales that are triadically consistent with
 $\boldsymbol{\kappa }$
, but not on
 $\boldsymbol{\kappa }$
itself. With disjoint spectral domains of dependence, it is unlikely that the weighted integral of the source term is strongly correlated with
 $\hat {v}_{\boldsymbol{\kappa }}(y_w)$
and that a robust phase relation can be established. The large variance in
 $\Delta \theta _{\boldsymbol{\kappa }, s}$
, as shown in the histograms of figure 10, supports this interpretation. The phase difference between transpiration and slow pressure can possibly be modelled as a stochastic process, but the sample size is too small to draw meaningful conclusions.
The last row of figure 10 (purple segments) completes the picture and shows the phase difference between the Stokes pressure and the transpiration
 $\Delta \theta _{\boldsymbol{\kappa },St}$
. The phase difference for negative
 $\angle \hat {A}_d$
shows considerable spread around the mean, whereas all values are tightly clustered near the mean for controller P50. Equation (5.4) suggests that
 $\Delta \theta _{\boldsymbol{\kappa }, s}$
is approximately determined by the temporal frequency content of
 $\partial \hat {v}_{\boldsymbol{\kappa }} / \partial t$
and that a robust phase relation can be established when the frequency content is sparse. To validate this, we analyse the temporal frequency content of two example control configurations. In this specific instance, the DNS is run at a constant time step to enforce a uniform sampling rate and the temporal frequency content is estimated using Welch’s method. Each time series is divided into segments of
 $M$
samples, which are multiplied by a Hamming window
 \begin{equation} w[n] = 0.54 - 0.46 \cos \left ( \frac {2 \pi n}{M-1} \right )\!, \quad 0 \leqslant n \leqslant M-1 ,\end{equation}
to enforce periodicity. Consecutive segments have a
 $50\,\%$
overlap and the robustness of the results was assessed through a convergence study. The results for the two example configurations are shown in figure 12: panel (a) shows the temporal frequency content of
 $\partial \hat {v}_{\boldsymbol{\kappa }} / \partial t$
at scale
 $\boldsymbol{\kappa }_s$
for controller N25 (larger variance in
 $\Delta \theta _{\boldsymbol{\kappa }, St}$
), while panel (b) presents scale
 $\boldsymbol{\kappa }_r$
and controller P50 (small variance). Each of the power spectra is normalised with its maximum value and only a subset of the resolved phase speeds
 $c = \omega / k_x$
is shown for clarity.
Power spectral density estimate
 ${\mathbb{E}} (\varPhi)$
of
 $\partial \hat {v}_{\boldsymbol{\kappa }} / \partial t$
for two different scales and phase shifts. Both spectra are normalised by their respective maximum values. The dotted vertical line in figure 12(b) indicates the wavespeed of the amplified eigenmode reported in Toedtli et al. (Reference Toedtli, Yu and McKeon2020).

For controller N25, the spectral content of
 $\partial \hat {v}_{\boldsymbol{\kappa }} / \partial t$
is distributed over a large range of positive phase speeds. The rate of change of the wall transpiration is not restricted to wavespeeds below the centreline velocity, as is typically the case for the velocity fluctuations in a canonical turbulent channel flow (Bourguignon et al. Reference Bourguignon, Tropp, Sharma and McKeon2014). This difference can likely be attributed to the time derivative, which amplifies higher frequencies, and to the closed loop control, which introduces additional dynamics. The temporal frequency content is broad-band and
 $\angle \hat{p}_{\boldsymbol{\kappa}, \textit{St}}$
therefore depends on multiple temporal frequencies. This can decrease the correlation to
 $\hat {v}_{\boldsymbol{\kappa }}$
and leads to the broader range of phase differences observed in figure 10.
In contrast, the temporal frequency content of
 $\partial \hat {v}_{\boldsymbol{\kappa }} / \partial t$
for configuration P50 and scale
 $\boldsymbol{\kappa }_r$
has a pronounced peak. Equation (5.4) suggests that the phase difference between Stokes pressure and transpiration is
 $-\pi / 2 + n 2\pi$
when a single frequency dominates, consistent with the histogram in figure 10. The dominant wavespeed roughly aligns with the phase speed of the amplified eigenmode that corresponds to the spanwise roller (green dotted line), which Toedtli et al. (Reference Toedtli, Yu and McKeon2020) computed for this configuration under idealised conditions (uncontrolled mean, single mode in isolation). The temporal frequency content thus provides further evidence that the amplified eigenmode drives the flow response of configuration P50 at scale
 $\boldsymbol{\kappa }_r$
and leaves a clear imprint not only in the velocity field, but also in the Stokes pressure.
Figures 8 and 10 together offer insights into how the phase difference between total pressure and transpiration (
 $\Delta \theta _{\boldsymbol{\kappa }}$
) is established. Consider, for example, scale
 $\boldsymbol{\kappa }_r$
in control configuration P50. The dominant Stokes and fast pressure (see figure 8
f) add to a resultant vector in the complex plane that is close to out-of-phase with the transpiration. The slow pressure adds a stochastic element to the resultant, but its magnitude is too small to significantly change the orientation of the pressure vector. The fast and Stokes pressure thus establish the out-of-phase relationship observed for the total pressure in this case. In contrast, the slow and Stokes pressure are dominant at
 $\boldsymbol{\kappa }_s$
and negative phase shifts and imprint the overall phase relation between transpiration and wall pressure. Given the significant variation in the direction of the slow pressure, it remains somewhat unclear how controller N25 establishes a robust overall phase relationship.
5.3. Phase difference at all scales
We next discuss the mean phase difference
 $\overline {\Delta \theta }_{\boldsymbol{\kappa }}$
between total pressure and transpiration across all scales, which is shown in figure 13(a,c,e). The interpretation of these spectra requires care: the phase of a Fourier coefficient with (close to) zero magnitude is ill-defined, which implies that the phase difference at scale
 $\boldsymbol{\kappa }$
is only meaningful if both
 $\hat {p}_{\boldsymbol{\kappa }}$
and
 $\hat {v}_{\boldsymbol{\kappa }}$
are non-zero. The spectra in figure 13 are therefore only shown for scales that satisfy
 $\varPhi _{{vv}} \varPhi _{pp} / \max (\varPhi _{{vv}} \varPhi _{pp}) \geqslant 10^{-2}$
. Scales that do not satisfy this condition are blanked out.
(a,c,e) Phase difference spectra
 $\overline {\Delta \theta }_{\boldsymbol{\kappa }}/\pi$
and (b,d,f) drag change spectra. Both quantities are only shown for the scales with
 $\varPhi _{{vv}} \varPhi _{pp} / \max (\varPhi _{{vv}} \varPhi _{pp}) \geqslant 10^{-2}$
. The green contour lines are the same as in figure 4 and label
 $\varPhi _{{vv}}^+ / \max (\varPhi _{{vv}}^+) = (0.15, 0.3, 0.45)$
.

The average phase difference for the drag-reducing controller N25 is shown in figure 13(c). The highlighted entry at scale
 $\boldsymbol{\kappa }_s$
corresponds to the circular average of the histogram shown in figure 10(b), and similar histograms could be constructed for all other scales. Analogous to scale
 $\boldsymbol{\kappa }_s$
, the phase difference at scales with large control input is approximately zero, indicating that transpiration and pressure at the streak scales are in-phase for controller N25. On the other hand, the phase relation between
 $v$
and
 $p$
for controller N75 (figure 13
a) is less clear. The average phase difference for the energetic streak scales is between
 $0$
and
 $+\pi / 2$
, with significant variability from scale to scale. As shown in figure 10(a), the circular variance for this control configuration is larger compared with the other two configurations, which makes the value of the circular mean less conclusive and possibly contributes to the observed spread across
 $\boldsymbol{\kappa }$
. Finally, transpiration and pressure at the roller scales are approximately out-of-phase for P50, as can be seen in figure 13(e). This is again consistent with the earlier observations for example scale
 $\boldsymbol{\kappa }_r$
.
The above discussion highlights that the example scales
 $\boldsymbol{\kappa }_s$
and
 $\boldsymbol{\kappa }_r$
are representative of their scale families also in terms of the mean phase difference. This suggests that the relative importance of the pressure components and the robustness of the phase relations through the domain of dependence apply broadly and underlie the observed phase difference spectra of each scale family.
5.4. Connection to drag change
We conclude this section by investigating whether specific values of
 $\overline {\Delta \theta }_{\boldsymbol{\kappa }}$
correlate with scale amplification and suppression. Figure 13(b,d,f) displays the scale-by-scale drag change, which was shown earlier in figure 5, but is now restricted to regions with non-zero
 $\hat {p}_{\boldsymbol{\kappa }}$
at
 $\hat {v}_{\boldsymbol{\kappa }}$
at the wall. A comparison between Figures 13(a,c,e) and 13(b,d,f) suggests a correlation between velocity-pressure phase difference and scale amplification. In the drag-reducing configuration N25, transpiration is in-phase with the wall pressure and the streak scales are suppressed. In contrast, the drag-increasing configuration P50 generates a transpiration that is out-of-phase with the wall pressure and amplifies the roller scales. The data for configuration N75 are less conclusive: the streak scales are amplified and the phase difference between transpiration and wall pressure is positive, but different from
 $\pi$
and shows considerable scatter. It is also important to remember that the variance in the phase difference was largest in case N75, which reduces the confidence in the exact value of the circular mean. One may speculate that the phase relation between
 $\hat {v}_{\boldsymbol{\kappa }}$
and
 $\hat {p}_{\boldsymbol{\kappa }}$
at the streak scales varies smoothly with
 $\angle \hat {A}_d$
. The two are in-phase at
 $\angle \hat {A}_d = - \pi / 4$
(configuration N25), when the drag is maximally reduced, and might be out-of-phase at
 $\angle \hat {A}_d = \pm \pi$
, when the drag increase is largest and the DNS diverges. From this perspective, configuration N75 could represent an intermediate state of positive phase shift as the scales approach the out-of-phase relation.
These observations suggest that the phase difference between transpiration and wall pressure is an important parameter of the problem. Drag reduction with streak scales coincides with actuation and wall pressure being in-phase, while drag increase with roller scales occurs if the two are out-of-phase. It is therefore plausible that the wall pressure encodes the state of the background flow, relative to which the transpiration is shifted by means of
 $\angle \hat {A}_d$
. The non-local domain of dependence (§ 5.1) is further consistent with an interpretation of the wall pressure as an averaged background flow state.
6. Summary and implications for control and modelling
This section summarises our results and puts them in broader perspective. A brief overview of the varying-phase opposition control results is given in § 6.1. Section 6.2 relates these results to the tailored surfaces and discusses implications for control and drag reduction. Possible avenues to extend the present results to higher Reynolds numbers are presented in § 6.3.
6.1. Summary of results
In this study we conduced DNS of low-Reynolds-number turbulent channel flows with wall transpiration and investigated the wall pressure field and its phase relation to the transpiration. The analysis considered the Fourier domain in the wall-parallel
 $\{x, z\}$
directions and focused on distinct spatial scales identified by the wavenumber combination
 $\boldsymbol{\kappa } = (k_x, k_z)^{\intercal }$
. The wall-normal and temporal coordinate were retained in physical space so that the Fourier coefficients depended on
 $y$
and
 $t$
.
The transpiration was generated by the varying-phase opposition control scheme, which measures the Fourier coefficient of the wall-normal velocity
 $\hat {v}_{\boldsymbol{\kappa }}(y_d, t)$
at a distance
 $y_d$
from the wall, and generates a wall transpiration
 $\hat {v}_{\boldsymbol{\kappa }}(y_w, t) = - \hat {A}_d \hat {v}_{\boldsymbol{\kappa }}(y_d, t)$
. The complex-valued controller gain
 $\hat {A}_d$
allowed shifting the phase of the transpiration (
 $\angle \hat {v}_{\boldsymbol{\kappa }}(y_w, t)$
) relative to the sensor measurement and the background flow. The gain was carefully defined so that
 $\angle \hat {A}_d$
corresponded to a shift in the streamwise direction. The sensor location was fixed at
 $y_d^+ = 15$
and
 $\angle \hat {A}_d$
was varied over the entire parameter range
 $[-\pi , +\pi ]$
. Our analysis focused on three example controllers: N75 (
 $\angle \hat {A}_d = -3 \pi / 4$
), N25 (
 $\angle \hat {A}_d = -\pi / 4$
) and P50 (
 $\angle \hat {A}_d = +\pi / 2$
).
The structure and magnitude of the wall pressure as well as the relative importance of its components (fast, slow and Stokes) changed with
 $\angle \hat {A}_d$
of the transpiration. Notably, the transpiration added an inertial forcing term to the Stokes pressure and made its magnitude comparable to the fast and slow pressure. The Stokes pressure is therefore not necessarily negligible in flows with wall transpiration.
We further analysed the structure of the pressure Green’s function solution. Specifically, we showed how the phase of the wall pressure is established and formulated conditions for robust phase relations between
 $\hat {p}_{\boldsymbol{\kappa }}$
and
 $\hat {v}_{\boldsymbol{\kappa }}$
. The phase relation between transpiration and fast and slow pressure was determined by a weighted wall-normal integral and a robust relation resulted if the integrand was correlated to
 $\hat {v}_{\boldsymbol{\kappa }}(y_w)$
over the wall-normal extent where the weight function was non-zero. This was typically the case for the fast pressure but not for the slow pressure. The difference is due to the spectral dependence of the two source terms: the source term of the fast pressure depends on
 $\hat {v}_{\boldsymbol{\kappa }}$
at the same wavenumber, which is constrained by the varying-phase opposition control scheme. On the other hand, the nonlinear source term of the slow pressure depends on all wavenumbers that are triadically consistent with
 $\boldsymbol{\kappa }$
and is typically not strongly correlated to
 $\hat {v}_{\boldsymbol{\kappa }}(y_w)$
. The phase relation of the Stokes pressure depended on the temporal frequency content of the transpiration dynamics at the wall. A robust phase relation resulted for approximately sparse frequency content, which was observed when the eigenspectrum of the linearised Navier–Stokes operator had an amplified eigenvalue.
Most of our subsequent analysis focused on the phase difference (relative streamwise arrangement) between wall pressure and transpiration, which changed as a function of
 $\angle \hat {A}_d$
. We considered scales at distinct
 $\boldsymbol{\kappa }$
, which belonged to one of two families: streak scales (
 $k_x$
small and
 $k_x \lt k_z$
, associated with the near-wall cycle at the current
 ${\textit{Re}}_{\tau }$
) and roller scales (
 $k_z$
small and
 $k_x \gt k_z$
). A significant contribution from the roller scales was only observed in configuration P50. For such positive
 $\angle \hat {A}_d$
, wall pressure and transpiration were approximately out-of-phase (
 $\overline {\Delta \theta }_{\boldsymbol{\kappa }} \approx \pi$
) and control amplified the roller scales, which lead to a large drag increase. Earlier studies showed that the drag increase coincides with the appearance of an amplified eigenvalue in the linearised Navier–Stokes operator and the presence of spanwise rollers in the DNS (Toedtli et al. Reference Toedtli, Yu and McKeon2020). On the other hand, the streak scales were most active for
 $\angle \hat {A}_d \lesssim 0$
. For configuration N25, wall pressure and transpiration at the streak scales were in-phase (
 $\overline {\Delta \theta }_{\boldsymbol{\kappa }} \approx 0$
) and transpiration suppressed the near-wall cycle and resulted in maximum drag reduction. The phase difference for more negative
 $\angle \hat {A}_d$
was positive, with large variance at each
 $\boldsymbol{\kappa }$
and significant variation across scales. In this case, transpiration amplified the near-wall cycle and lead to a drag increase.
To our knowledge, this study presented the first direct evidence that drag reduction correlates with
 $\Delta \theta _{\boldsymbol{\kappa }} \approx 0$
in the full nonlinear flow, confirming the hypothesis of Xu et al. (Reference Xu, Rempfer and Lumley2003). Similarly, the present study provided evidence that
 $\Delta \theta _{\boldsymbol{\kappa }} \approx \pm \pi$
correlates with drag increase and the appearance of spanwise rollers, which to our knowledge had not been appreciated thus far. It is possible that
 $\Delta \theta _{\boldsymbol{\kappa }} \approx \pm \pi$
can induce other flow structures as well (we hypothesised that this phase relation could also be established at
 $\angle \hat {A}_d = \pm \pi$
) but this aspect remained speculative. At its core, the present study made a case that the phase relation between wall transpiration and pressure deserves more attention in the flow control community.
6.2. Connection to tailored surfaces and implications for modelling and control
We next connect the varying-phase opposition control results to tailored surfaces. As described in the introduction, the occurrence of spanwise rollers is well documented for a range of tailored surfaces including porous (Jiménez et al. Reference Jiménez, Uhlmann, Pinelli and Kawahara2001) and permeable walls (see, for example, Breugem et al. Reference Breugem, Boersma and Uittenbogaard2006; Efstathiou & Luhar Reference Efstathiou and Luhar2018; Gómez-de Segura & García-Mayoral Reference Gómez-de Segura and García-Mayoral2019) and riblets past the viscous breakdown (García-Mayoral & Jiménez Reference García-Mayoral and Jiménez2011). The appearance of spanwise rollers coincides with a significant drag increase and, in many cases, with the presence of an amplified eigenvalue in the spectrum of the linearised Navier–Stokes operator. A number of pressure-driven tailored surfaces further impose a phase relation between pressure and transpiration at the wall. For example, Jiménez et al. (Reference Jiménez, Uhlmann, Pinelli and Kawahara2001) modelled their porous wall as
 \begin{equation} v(x, y_w , z, t) = -\beta p^{\prime }(x, y_w, z, t), \end{equation}
where
 $\beta \geqslant 0$
is a material parameter and
 $p^{\prime }$
denotes the pressure fluctuations above the background pressure and mean gradients. By construction, wall pressure and transpiration are out-of-phase in this configuration.
The flow response to varying-phase opposition control with roller scales and positive
 $\angle \hat {A}_d$
leads to the same observations: the transpiration induces spanwise rollers near the wall and causes a large drag increase; the onset of the rollers and their wall-normal structure can be predicted from the eigenspectrum of the linearised Navier–Stokes equations; and wall transpiration and pressure are out-of-phase. The close correspondence of flow responses suggest that transpiration with the roller scales and
 $\angle \hat {A}_d \gt 0$
is dynamically similar to this class of tailored surfaces. We use the term dynamical similarity to indicate that the overall flow response is analogous, even if finer details are different. For example, figure 6(f) suggests that wall pressure and transpiration of configuration P50 are not simply related by a constant, which is different from the boundary condition (6.1). To further test the dynamical equivalence, it would be interesting to verify if
 $\hat {v}_{\boldsymbol{\kappa }}$
and
 $\hat {p}_{\boldsymbol{\kappa }}$
are out-of-phase when other configurations, such as riblets, generate spanwise rollers. As mentioned in the introduction, the notion of transpiration in this case would apply to a suitably chosen plain inside the flow domain.
Tailored surfaces also interact with the near-wall cycle. For example, riblets in the viscous regime suppress the near-wall cycle and reduce drag, while riblets with spacings past the optimum can amplify these scales and increase the drag (Chavarin & Luhar Reference Chavarin and Luhar2020). Varying-phase opposition control with streak scales, which are associated with the near-wall cycle at the present
 ${\textit{Re}}_{\tau }$
, leads to the same observations: a transpiration with small negative
 $\angle \hat {A}_d$
suppresses the near-wall cycle and leads to drag reduction, analogous to riblets in the viscous regime. On the other hand, transpiration with large negative or positive
 $\angle \hat {A}_d$
amplifies the near-wall cycle and leads to a drag increase, analogous to the flow response to riblets past the viscous regime. The close correspondence of flow responses again suggests that transpiration with streak scales is dynamically similar to tailored surfaces interacting with the near-wall cycle. It would be interesting to verify also in this case if wall pressure and transpiration are in-phase when riblets suppress the near-wall cycle. A further analogy between the two control methods occurs for transpiration with
 $\angle \hat {A}_d \gt 0$
and the riblets past the viscous breakdown: both configurations amplify the near-wall cycle and induce spanwise rollers, but the amplification of the rollers is much stronger so that they dominate the flow response and the drag increase (see figures 3 and 4
f and García-Mayoral & Jiménez Reference García-Mayoral and Jiménez2011).
It is also important to highlight that varying-phase opposition control and at least a subset of tailored surfaces, namely the pressure-driven ones, have a complimentary perspective on how the
 $pv$
phase relation is established: the varying-phase opposition control scheme applies a transpiration with a phase shift
 $\angle \hat {A}_d$
, but does not explicitly depend on the pressure. Once the transpiration is generated, the pressure field responds and the phase relation is established according to the discussion in §§ 4 and 5. In contrast, a pressure-driven tailored surface generates a transpiration that explicitly depends on the pressure and the phase difference between
 $p$
and
 $v$
may be imposed by the boundary condition (see, e.g. (6.1)). In this case, the flow has to adjust the wall-normal profiles of the pressure source term and the spectral content of the Stokes pressure boundary condition to satisfy this phase relation (see § 5.2). This is in some sense a complementary problem to our configuration, but the tools we presented can still be used to analyse the flow changes in detail.
The observed dynamical similarity suggests that transpiration at the two scale families together with the phase difference
 $\Delta \theta _{\boldsymbol{\kappa }}$
(or, equivalently,
 $\angle \hat {A}_d$
) build essential building blocks for flows over tailored surfaces. From a physical perspective, this suggests that the transpiration at the two scale families can provide a suitable diagnostic tool to analyse tailored surfaces and understand their dynamical effect. From a modelling perspective, this provides evidence that tailored surfaces can be represented by velocity boundary conditions and suggests that transpiration has to be a key component of any such dynamical representation, in agreement with the observations of Bottaro (Reference Bottaro2019).
We conclude this section with a few general remarks regarding control. First, the results of this study suggest that drag reduction with passive pressure-driven tailored surfaces is difficult to achieve. The spectral content of the wall pressure and transpiration are reasonably aligned when the drag is increased (see figure 6
f), but not when the drag is reduced (figure 6
d). The pressure therefore likely activates the ‘wrong’ scales if the tailored surface is scale agnostic. Moreover, many passive configurations induce an out-of-phase relation between
 $v$
and
 $p$
, which based on the results presented herein does not lead to scale suppression and drag reduction. In order to reduce drag, a passive pressure-driven tailored surface would therefore need to impose (i) a scale-dependent response, and (ii) a different phase relation between
 $p$
and
 $v$
. This could perhaps be achieved through an array of suitably placed Helmholtz resonators (see, e.g. Dacome, Siebols & Baars Reference Dacome, Siebols and Baars2023) or a still to be developed meta-material. A permeable substrate with complex-valued transpiration coefficient would be another interesting test case. Gómez-de Segura & García-Mayoral (Reference Gómez-de Segura and García-Mayoral2019) considered real-valued transpiration coefficients, which induced an out-of-phase relation between
 $p$
and
 $v$
at the substrate boundary. Drag reduction was observed for small values of the wall-normal permeability, which prevented the formation of spanwise rollers. It would be interesting to see if the spanwise rollers can alternatively be suppressed with complex-valued transpiration coefficients, which induce a different phase relation between
 $p$
and
 $v$
.
The second comment regards the pressure as a sensor measurement for control: the present study indicates that the wall pressure signal encodes the background flow and can inform a suitable transpiration. However, this pressure information has to come from the controlled flow itself, since the pressure changes significantly in the presence of transpiration. For example, the Stokes pressure is negligible in the canonical case but can become leading order in the presence of transpiration (see § 4). Control policies or flow estimators based on data from canonical wall-bounded flows are therefore likely not very effective once control is applied. An additional challenge with basing the control input on the wall pressure is the direct coupling between
 $v$
and
 $p$
, especially through the Stokes pressure. This is different from, say, opposition control, where the sensor and actuator are separated by a viscous flow region that reduces direct coupling.
6.3. Relevance at higher Reynolds numbers
The results presented in this study were for a low-Reynolds-number turbulent channel flow, which corresponded to
 $({\textit{Re}}_{\tau })_0 \approx 180$
in the absence of transpiration. Most practical applications operate at significantly higher Reynolds number. An obvious question is whether the scale families and the
 $pv$
phase relation are relevant at higher
 ${\textit{Re}}$
as well. We offer a few different perspectives on this question.
The first perspective is a phenomenological one: the two scale families were associated with distinct flow structures. The persistence of these flow structures at higher Reynolds numbers may be taken as an indication that the scale families remain relevant. Following this reasoning, results in the literature suggest that the streak and roller scales and their phase relations remain relevant for at least another decade in
 ${\textit{Re}}_{\tau }$
. For example, an experimental investigation by Efstathiou & Luhar (Reference Efstathiou and Luhar2018) found evidence for the existence of spanwise rollers over a porous wall at
 ${\textit{Re}}_{\tau } \approx 1700$
. Similarly, the DNS study of Deng et al. (Reference Deng, Huang and Xu2016) suggests that classical opposition control can reduce drag until at least
 ${\textit{Re}}_{\tau } \approx 1000$
. Classical opposition control is closely related to
 $\angle \hat {A}_d = 0$
, at which the streak scales lead to drag reduction. A resolvent study on compliant walls by Luhar et al. (Reference Luhar, Sharma and McKeon2015) at
 ${\textit{Re}}_{\tau } \approx 2000$
further suggests that the (fast) wall pressure and transpiration have to be in-phase to suppress the near-wall cycle, consistent with the results presented earlier. However, the
 ${\textit{Re}}$
scaling of the spatial scales remains an open question.
As the Reynolds number increases, large-scale flow structures in the logarithmic region become more energetic and their imprint reaches all the way down to the wall (see, e.g. Hutchins & Marusic Reference Hutchins and Marusic2007b
). A second question is how the results apply to these structures. Substantiated answers for this question are sparse, because effective flow manipulation schemes for large-scale structures are still rare. There has been recent success in suppressing flow structures in the logarithmic region by means of streamwise travelling waves of spanwise wall oscillations (Marusic et al. Reference Marusic, Chandran, Rouhi, Fu, Wine, Holloway, Chung and Smits2021), but it remains inconclusive if transpiration-based control can suppress these structures as well (Abbassi et al. Reference Abbassi, Baars, Hutchins and Marusic2017). Opposition control in the logarithmic region has so far lead to drag increase and the generation of spanwise rollers for some configurations (Guseva & Jiménez Reference Guseva and Jiménez2022), which suggests that the roller scales represent a general sensitivity of the flow to a relaxed no-throughflow condition. On the other hand, a different phase relation between
 $v$
and
 $p$
may be needed to suppress the large-scale motions in the logarithmic layer. A recent resolvent study suggests that wall pressure and transpiration no longer need to be in-phase to optimally suppress these motions (Luhar et al. Reference Luhar, Sharma and McKeon2015), but the caveat is again that this analysis only captures the fast pressure component. A future study may consider a modified version of the present analysis, with
 $\hat {A}_d$
according to (2.5) and sensors located in the logarithmic region, to clarify if and how transpiration-based control can increase or decrease the drag and what the
 $vp$
phase relation in each case is.
Finally, the present work offers a fresh perspective on flow control that can also be applied at higher Reynolds numbers. The phase difference
 $\Delta \theta _{\boldsymbol{\kappa }}$
is a wall quantity and its strong correlation with drag reduction suggests that flow control can perhaps be understood from the perspective of the wall. Control based on the wall pressure naturally selects scales that have an imprint at the wall and removes the somewhat unsatisfying necessity of identifying target structures inside the flow, at the expense of not being able to target scales that cannot be sensed at the wall. In addition, a wall transpiration with a specific phase relation to the wall pressure systematically alters the scale-by-scale vorticity flux, which represents the dynamical effect of the wall and is perhaps the most natural control target at any Reynolds number. The wall vorticity flux may therefore deserve more attention in the flow control community, as envisioned early on by Koumoutsakos (Reference Koumoutsakos1999).
Acknowledgements
The authors are grateful to Dr. Nicholas Hutchins, Dr. Daniel Chung, Dr. Dan Meiron, Dr. Adrian Lozano-Duran and Dr. Petros Koumoutsakos for many fruitful discussions.
Funding
The authors acknowledge funding from the Office of Naval Research through ONR Grant Number N00014-17-1-3022. The National Center for Atmospheric Research is sponsored by the National Science Foundation of the United States.
Declaration of interests
The authors report no conflict of interest.
Appendix A. Scale-restricted controllers
A scale-restricted controller is formally defined by (2.3) with a different controller gain
 \begin{equation} \hat {A}_{d, \boldsymbol{\kappa }} = \begin{cases} \hat {A}_d & \text{if } \boldsymbol{\kappa } \in \boldsymbol{\kappa }_c, \\ 0 & \text{otherwise} .\end{cases} \end{equation}
In (A1),
 $\boldsymbol{\kappa }_c$
denotes the set of controlled scales, for which the controller gain is identical to (2.5). All scales not contained in
 $\boldsymbol{\kappa }_c$
remain uncontrolled, which means
 $\hat {v}_{\boldsymbol{\kappa }}(y_w) = 0$
for these scales. The scale-restricted controllers thus generate a wall transpiration with very limited spectral content. Two different choices of
 $\boldsymbol{\kappa }_c$
will be considered subsequently: single-scale controllers, for which
 $\boldsymbol{\kappa }_c = \lbrace (k_{xc}, k_{zc})^{\intercal } \rbrace$
contains a single spatial scale, and single-wavenumber controllers, for which
 $\boldsymbol{\kappa }_c = \lbrace (k_{xc}, k_z)^{\intercal } | \, k_z = 0, \pm 1, \dots \rbrace$
contains all spanwise wavenumbers at a given
 $k_{xc}$
.
The control scales in
 $\boldsymbol{\kappa }_c$
are an additional parameter of the scale-restricted scheme, besides the sensor location
 $y_d$
and phase shift
 $\angle \hat {A}_d$
. We consider a scale-restricted controller for each scale family (streaks and rollers) in isolation, which results in two different sets
 $\boldsymbol{\kappa }_c$
. The scale selection within each family is somewhat arbitrary, but ideally the controlled scales are energetic enough so that their effect is detectable in the flow in a mean sense. Suitable energetic scales can thus be identified from the actuation spectra shown in figure 4.
The roller scales are particularly active at large positive phase shifts, and
 $\boldsymbol{\kappa }_c$
can thus be selected from the transpiration spectrum of configuration P50 in figure 4(f). The requirement of a strong flow response suggests selecting the most energetic scale, which was previously identified at
 $\boldsymbol{\kappa }_r = (k_x = 6.5, k_z = 0)^{\intercal }$
. A suitable scale-restricted controller for the roller family is therefore given by
 \begin{equation} \boldsymbol{\kappa }_c = \left \lbrace \boldsymbol{\kappa }_r = (k_{xr} = 6.5, k_{zr} = 0)^{\intercal } \right \rbrace \!,\end{equation}
and the red squares in figure 3 show the drag change due to control with this
 $\boldsymbol{\kappa }_c$
. The flow response to this single-scale controller is strong enough to be statistically significant for positive phase shifts, but no drag change is observed for negative phase shifts. We confirmed that increasing the control input by incorporating additional roller scales does not lead to a drag change either, which suggests that the roller scales do not contribute to the flow response in this parameter regime. This interpretation is also consistent with the transpiration spectra at negative
 $\angle \hat {A}_d$
(figures 4
b and 4
d).
The streak scales on the other hand are most active for
 $\angle \hat {A}_d \leqslant 0$
and suitable control scales
 $\boldsymbol{\kappa }_c$
can be selected from the transpiration spectrum of configuration N25 (figure 4
d). The most energetic scale of this configuration occurs at
 $\boldsymbol{\kappa }_s = (k_x = 0.5, k_z = 11)^{\intercal }$
, but a controller based on this single scale generates a weak flow response that is not statistically significant. The control input can be amplified by adding more spatial scales. A suitable scale-restricted controller for the streak scales is therefore given by the single-wavenumber controller
 \begin{equation} \boldsymbol{\kappa }_c = \left \lbrace \lbrace \boldsymbol{\kappa } \rbrace _{k_{xs}} = (k_{xs} = 0.5, k_z)^{\intercal } | \, k_z = 0, \pm 1, \dots \right \rbrace\!, \end{equation}
and the blue triangles in figure 3 show the drag change due to control with this
 $\boldsymbol{\kappa }_c$
. Equation (A3) is preferred over other possible choices of
 $\boldsymbol{\kappa }_c$
, because it contains many energetic scales (see figure 4
d) and ensures that no three scales are triadically consistent, since all have the same
 $k_{xs}$
. It is also important to point out that even though the single-wavenumber controller acts on all spanwise wavenumbers, they only correspond to approximately 1 % of all the Fourier modes.
Appendix B. Circular statistics
Phase differences or, more generally, phase angles in the complex plane are periodic quantities and take on values in the interval
 $[0, 2\pi )$
or any multiple of it. They are an instance of so-called directional data and have a number of properties that complicate their statistical characterisation. For example, the numerical representation of directional data is non-unique, since the angular value depends on the choice of zero direction and sense of rotation. In addition, the periodicity violates the Euclidean notion of distance: for example, a value of
 $2\pi - \epsilon$
is closer to
 $0$
than to say
 $\pi$
for sufficiently small
 $\epsilon$
. As a consequence, methods from linear statistical analysis are inappropriate to compute statistics of directional data. This is best illustrated by the example dataset shown in figure 14, which consists of two angles (
 $\theta _1, \theta _2$
). East is taken as the zero direction and positive angles are measured in the counter-clockwise direction, so that
 $\theta _2 = 2\pi - \theta _1$
. The standard linear mean
 $\tilde {\theta }$
,
 \begin{equation} \tilde {\theta } = \frac {1}{N} \sum _{i=1}^N \theta _i = \pi, \end{equation}
is represented as red cross in figure 14 and is clearly not representative of the average direction of the data.
Circular data (
 $\theta _1$
,
 $\theta _2$
) and their linear (
 $\tilde {\theta }$
, red cross) and circular mean (
 $\overline {\theta }$
, green square).

An appropriate mean value can instead be obtained from the circular mean, which interprets the directional data as points on the unit circle in the complex plane. Starting from the resultant
 $\boldsymbol{R}$
of the associated unit vectors
 \begin{equation} \boldsymbol{R} = \left ( \sum _i \cos (\theta _i), \sum _i \sin (\theta _i) \right )^{\!\intercal } = \left (C, S\right )^{\intercal }, \quad R = \sqrt {C^2 + S^2}, \end{equation}
the circular mean
 $\overline {\theta }$
is defined as the direction of
 $\boldsymbol{R}$
in the complex plane
 \begin{equation} \overline {\theta } = \angle \left ( C + i S \right ). \end{equation}
In the example of figure 14, the resultant of the two angles is
 \begin{equation} \boldsymbol{R} = \left (2 \cos (\theta _1), 0 \right )^{\intercal } \end{equation}
with circular mean
 $\overline {\theta } = 0$
, indicated by the green square in the figure. This circular mean provides an appropriate measure for the mean direction, and an overbar over an angular variable refers to the circular mean throughout the paper. We note that higher-order statistical measures can be defined as well, but are not further explored here. Interested readers may refer to Jammalamadaka & SenGupta (Reference Jammalamadaka and Sen Gupta2001) for an in-depth discussion of the topic.
Appendix C. Connection to kinetic energy
Section 5 explored the connection between mean phase difference
 $\overline{\Delta \theta}_{\boldsymbol{\kappa}}$
and drag change. This appendix demonstrates that the phase difference is also related to the energetics of the actuation. The starting point is the rate of change of the volume-integrated kinetic energy
 \begin{equation} \frac {{\textrm{d}} }{{\textrm{d}} t} \int _{-1}^{1} \left \langle e \right \rangle _{xz} \, {\textrm{d}}y = - 2 G_x U_b - \frac {1}{{\textit{Re}}_b} \int _{-1}^{1} \left \langle \left ( \frac {\partial u_i}{\partial x_j} \right )^2 \right \rangle _{xz} {\textrm{d}}y - \left [ \frac {\langle v^3\rangle _{xz}}{2} + \langle pv \rangle _{xz} \right ]_{y=-1}^{y=1}, \end{equation}
where
 $e = u_i u_i / 2$
. The first two terms on the right-hand side are analogous to a canonical turbulent channel flow and represent the work done by the mean pressure gradient and the viscous dissipation. The last two terms in square brackets are the contributions from the wall transpiration and quantify the injection of kinetic energy (first term) and the work done against the local pressure (second term).
The transpiration-pressure work at each wall can further be written in terms of Fourier modes
 \begin{equation} \left \langle pv \right \rangle _{xz}(y_w) = 2 \sum _{l} \sum _{m \in {\mathcal{M}}(l)} \lvert \hat {p}_{\boldsymbol{\kappa }}(y_w) \rvert \, \lvert \hat {v}^{\ast }_{\boldsymbol{\kappa }}(y_w) \rvert \, \cos (\Delta \theta _{\boldsymbol{\kappa }}) ,\end{equation}
where the superscript
 $\ast$
denotes a complex conjugate and the index set
 ${\mathcal{M}}$
contains all integers for
 $l \neq 0$
and only positive integers for
 $l = 0$
. Equation (C2) shows that the instantaneous scale-by-scale phase difference between velocity and pressure determines whether a specific scale injects or extracts kinetic energy from the flow through the pressure work term. Specifically at the lower wall, scales with
 $ \lvert \Delta \theta _{\boldsymbol{\kappa }} \rvert \leqslant \pi / 2$
inject energy into the flow, while scales with
 $\lvert \Delta \theta _{\boldsymbol{\kappa }} \rvert \gt \pi / 2$
extract energy from it. The net effect results from the sum over
 $\boldsymbol{\kappa }$
and the energetic behaviour can vary in spectral space, so that cancellations across scales are in principle permissible. Depending on the spread of
 $\Delta \theta _{\boldsymbol{\kappa }}$
over time, it is further possible that a specific scale acts as an energy sink and source for different parts of the time series. Figure 10(a) shows that scale
 $\boldsymbol{\kappa }_s$
in case N75 is an example of this behaviour.
Figures 10 and 13 further demonstrate that the streak scales inject energy in configuration N25, while the roller scales extract energy through the pressure term in configuration P50. However, the sign of the pressure work term does not say much about the overall effect of the transpiration on the flow. Configuration P50 has increased turbulence intensity and drag relative to the uncontrolled flow, even though the pressure work term extracts kinetic energy. Conversely, configuration N25 with a positive pressure work term has less turbulence intensity and lower drag. Two comments are important to interpret the disconnect between the sign of the pressure work and the effect on the flow. First, the pressure work is only one of two transpiration-related terms in (C1) and their sum may have the opposite sign. The transpiration-pressure phase relation does therefore not fully characterise the energetics of the actuation. Second, the data only consider the steady state of the controlled flow and the energetics of individual scales may be different during the transient stage. For example, the energetic roller scales in configuration P50 are associated with an amplified eigenvalue of the linearised Navier–Stokes operator. Their amplification in the transient stage, where the structural flow changes occur, is not part of the above discussion and beyond the scope of this work.