


Introduction
Sea ice is a sensitive indicator of climate change (Reference Lubin and MassomLubin and Massom, 2006). With its high albedo relative to the ocean and low thermal conductivity, it regulates the ocean–atmosphere heat, moisture, and energy exchange (Reference Smith, Muench and PeaseSmith and others, 1990; Reference Meier and StroeveMeier and Stroeve, 2008). Variations in sea-ice albedo and these exchanges are difficult to monitor on a basin-wide scale. Satellite data can support the determination of the sea-ice albedo and the mentioned fluxes by providing detailed ice-property distribution information by, for example, classification of different ice types, mapping of the sea-ice roughness distribution, or identification of leads and polynyas (Reference JeffriesJeffries, 1998; Reference Lubin and MassomLubin and Massom, 2006).
Detailed ice information at fine spatial resolution can be provided by satellite synthetic aperture radar (SAR) operating at a frequency of 5.3GHz (wavelength 5.6 cm), i.e. in C-band (Reference Onstott, Shuchmann, Jackson and ApelOnstott and Shuchmann, 2004; Reference ReesRees, 2006; Reference JohannessenJohannessen and others, 2007). Ice types and radar backscatter values obtained with C-band SAR or satellite scatterometer were correlated in various studies for the Arctic and Antarctic (Reference CarseyCarsey and others, 1992; Reference Kwok, Rignot, Holt and OnstottKwok and others, 1992; Reference Jeffries, Chuah and MorrisJeffries and others, 1995; Reference Drinkwater and LytleDrinkwater and Lytle, 1997; Reference Tsatsoulis and KwokTsatsoulis and Kwok, 1998; Reference Drinkwater and LiuDrinkwater and Liu, 2000; Reference Kwok, Cunningham and NghiemKwok and others, 2003). During (cold) winter conditions ice-type discrimination is relatively straightforward because the typically shallow and dry snow cover has only a small influence on the radar backscatter at C-band. However, during summer or summer-like conditions this discrimination is hampered by an increasing influence of the snow cover.
Reference HaasHaas (2001) investigated C-band scatterometer data obtained over perennial sea-ice regions around Antarctica and found a marked increase in C-band radar backscatter values by, on average, 5.6 dB between spring (–16.3 dB) and summer (–10.7 dB); sudden drops in C-band radar backscatter values during spring/summer were also observed. According to Reference HaasHaas (2001), the increase is most likely caused by snow meltwater. A layer of superimposed ice is formed from refreezing snow meltwater percolating through the snow layer. This ice layer contains air bubbles and is rough at the centimeter scale. the above-mentioned sudden drops, on the other hand, can be associated with periods of a meltwater-saturated surface snow layer. These observations are confirmed by Reference Kawamura, Wakabayashi and UshioKawamura and others (2006) who investigated C-band SAR data in relation to the snow property changes on landfast sea ice in Lützow-Holm Bay, Antarctica, and who reported minimum C-band normalized radar cross-section (NRCS) values during mid-summer and a remarkable increase in the NRCS values at the end of summer.
Reference Willmes, Bareiss, Haas and NicolausWillmes and others (2006, Reference Willmes, Haas, Nicolaus and Bareiss2009) investigated snow properties on second-year ice in the Weddell Sea during mid-summer. They confirmed the initial decrease in C-band NRCS values once snowmelt commences and observed an increase in the NRCS values as summer progresses. This increase was caused by an increase in snow-grain size due to snow metamorphism triggered by diurnal melt–refreeze cycles. In addition to an increase in C-band NRCS values, brightness temperatures (TB) measured by the Special Sensor Microwave/Imager (SSM/I) at a frequency of 37 GHz, vertical polarization, start to vary diurnally once melt– refreeze cycles have set in. Reference Willmes, Haas, Nicolaus and BareissWillmes and others (2009) used this diurnal variation, together with the fact that an increased snow wetness also causes a substantial increase in TB(37 GHz) values (see Reference Garrity and CarseyGarrity, 1992), to characterize the nature and map the progress of snowmelt on Antarctic sea ice.
On Antarctic sea ice, surface flooding and formation of a slush layer on top of the sea ice under the submergence of sea ice due to a heavy snow load (Reference Eicken, Lange, Hubberten and WadhamsEicken and others, 1994) is quite common. the effect of ice–snow interface flooding with sea water on the radar backscatter of sea ice is, however, not yet fully understood. It is a function of various factors like frequency and incidence angle as well as processes at the ice–snow interface like brine wicking or slush-ice formation (Reference Jeffries, Chuah and MorrisJeffries and others, 1995; Reference Lytle, Jezek, Gogineni and HosseinmostafaLytle and others, 1996; Reference Morris, Jeffries, Li and JeffriesMorris and others, 1998; Reference HaasHaas, 2001; Reference Onstott, Shuchmann, Jackson and ApelOnstott and Shuchmann, 2004).
With a –5.7% declining trend in sea-ice cover during 1979–2006, the Bellingshausen/Amundsen Seas region has shown the largest decline in Antarctic sea-ice extent (Reference Comiso and NishioComiso and Nishio, 2008). This contrasts with sea-ice extent increase rates of 4.2% in the Ross Sea region and 1.0% for the Southern Hemisphere overall (Reference Comiso and NishioComiso and Nishio, 2008). the objectives of this study are (1) to derive relationships between visual ship-based Antarctic Sea Ice Processes and Climate (ASPeCt) observations and coincident C-band NRCS values for different sea-ice types under mid- to late-summer conditions; (2) to explain the change in C-band NRCS values as summer progresses, with the aid of ASPeCt observations and Advanced Microwave Scanning Radiometer–Earth Observing System (AMSR-E) TB(37 GHz) values for the transition period from early summer to the end of summer in West Antarctic sea ice; and (3) to investigate the ridged-ice fraction and volume effect on C-band NRCS values. To address these objectives we use data collected on two research cruises, Oden 2008 and Palmer 2009, conducted in the West Antarctic sea-ice zone (Fig. 1) during the International Polar Year (IPY). In addition, we use European Space Agency (ESA) Environmental Satellite (Envisat) Advanced Synthetic Aperture Radar (ASAR) Wide Swath Mode (WSM) images and daily TB and sea-ice concentration values from the AMSR-E.
Cruise tracks of Oden 2008 (total of 100 ship-based observations) and Palmer 2009 (total of 197 ship-based observations). the superposed ellipse and rectangle denote the approximate sample locations discussed in the paper.

Data
ASPeCt ship-based observations during Oden 2008 and Palmer 2009
Visual ship-based sea-ice observations constitute the main ground-truth data of this study. These were performed based on the ASPeCt protocol (Reference Worby, Allison and DiritaWorby and others, 1999). ASPeCt provides a consistent and quantifiable method for estimating the type, thickness and distribution of sea ice along a ship’s track through the pack ice by making hourly observations from the ship’s bridge. These observations include the ship’s position, total sea-ice concentration, an estimate of the areal coverage, type, thickness, floe size, topography of sea ice and snow cover and depth in the three dominant ice-thickness categories within a ~1 km radius of the ship (Reference Worby, Allison and DiritaWorby and others, 1999; Reference Worby and AckleyWorby and Ackley, 2000). They are recorded on log sheets based on the predefined ASPeCt codes.
ASPeCt observations of Oden 2008 started on 10 December 2008 at 1200 h GMT and ended on 9 January 2009 at 0250 h GMT (austral summer). A total of 100 ASPeCt observations were carried out, as shown (by an x) in Figure 1. Total ice concentration and the primary (i.e. largest) ice-thickness ASPeCt observations during the cruises are presented in Figure 2a and b. During Oden 2008, average air temperature was –2.5±1.8˚C; the minimum and maximum air temperatures were –6.2˚C and 3.9˚C. Average wind speed was 4.4±3.2ms–1, with a maximum of 18ms–1. Figure 3a shows the air-temperature values obtained from ASPeCt observations of Oden 2008.
Primary ice-concentration (a) and primary ice-thickness (b) from ASPeCt ship-based observations during Oden 2008. Sampling locations (ASPeCt as well as ice-core sampling) are denoted by arrows and boxes in (b). Each box in (b) is annotated with a code name that corresponds to entries in Table 1 and 2; ‘IC’ refers to an ice core, ‘Ao’ to an ASPeCt observation.

A total of 197 ASPeCt observations were carried out during Palmer 2009, starting on 11 January 2009 at 1700 h GMTand ending on 16 February 2009 at 0000 h GMT. This period coincides with the second half of the 2009 austral summer; air temperatures varied between –7.3˚C and 1.9˚C, with a mean value of –2.5±1.9˚C (Fig. 3b). Average wind speed was 6.9±2.6ms–1, with a maximum value of 10ms–1. ASPeCt observations of total ice concentrations and the primary ice thicknesses are presented in Figure 4a and b, respectively. During Oden 2008 and Palmer 2009, in ~90% of all ASPeCt observations the primary ice type coincided with the dominant ice type.
Air-temperature values for Oden 2008 (a) and Palmer 2009 (b) cruises. Dates are day.month.year. Open squares on the x-axis indicate the ASAR image acquisition.

Primary ice-concentration (a) and primary ice-thickness (b) ASPeCt ship-based observations during Palmer 2009. See Figure 2 caption for explanation of the boxes and code names.

Envisat ASAR WSM and AMSR-E brightness temperature
The ASAR instrument aboard the polar-orbiting Envisat satellite operates at C-band (frequency 5.3 GHz, wavelength 5.6 cm) (http://envisat.esa.int/instruments/asar/). Among its different operational modes, the WSM, having a nominal pixel spacing of 75 m with a spatial resolution of 150 m and a swath width of ~400 km, is the most appropriate for sea-ice monitoring (Reference JohannessenJohannessen and others, 2007). Here we use 15 ASAR WSM images obtained from ESA.
The AMSR-E aboard the polar-orbiting Aqua satellite is a microwave radiometer. the US National Snow and Ice Data Center (NSIDC) provides gridded AMSR-E/Aqua daily TB values, sea-ice concentration and snow depth data (AE_SI12) with a grid resolution of 12.5 km ×12.5 km. AE_SI12 includes horizontally and vertically polarized TB from 18.7 GHz through 89.0 GHz (D.J. Cavalieri and others, http://nsidc.org/data/ae_si12.html). From the AE_SI12 dataset, we used the ascending, descending and daily average TB(37 GHz) vertical polarization (TB37V henceforth), and the sea-ice concentration values.
Methodology
Reference Worby, Massom, Allison, Lytle, Heil and JeffriesWorby and others (1998) indicated that daily shifts in ice-edge location may reach up to 1˚ of latitude in Antarctica. Thus, to reduce the inaccuracies that may arise from sea-ice advection between an ASPeCt observation and ASAR image acquisition, only those ASPeCt observations lying within ±2.5 hours of the ASAR image acquisition time are considered, resulting in eight images for comparison ( Table 1). These images were geocoded, calibrated and projected onto a polar stereographic grid true at 70˚ S with a grid resolution of 125m×125 m.
Overview of observed (ASPeCt) total and dominant-ice-type ice concentrations (ice types are first-year ice (FY; thickness 0.7–1.2 m), thick first-year ice (TFY; thickness >1.2 m) and multi-year ice (MY)) and dominant-ice-type thickness and snow depth, together with mean values and standard deviations of ASAR radar backscatter (NRCS) for the available overlapping dates. the ASAR incidence angle, σ, is the local incidence angle (degrees from nadir) at the ship’s position. the number of pixels is the number of valid ASAR image gridcells of the respective 2 km×2 km box (maximum number here is 288; a smaller number indicates that the box is located at the ASAR image edge)

Reference Kwok, Rignot, Holt and OnstottKwok and others (1992) noted the effect of wind-induced surface roughness on radar backscatter measurements over open water leading to ambiguities in interpretation of SAR images. Furthermore, icebreakers try to avoid the thickest ice during cruises, resulting in a bias towards thinner ice (Reference PerovichPerovich and others, 2009). Thus, to reduce the ambiguities arising from surface scattering over open water, only those ASPeCt data that have at least 50% total ice concentration are considered in the further analyses.
A 2.125 km ×2.125 km box (2 km ×2 km henceforth) centered at the ship’s position for the corresponding ASPeCt observation was co-located in the respective ASAR image and is used to derive a mean C-band NRCS value for the respective 1 km ASPeCt observation radius. A typical histogram of such a box is given in Figure 5a. the standard deviation of the radar backscatter within the boxes is also calculated. However, within these 2 km ×2 km boxes comprising 289 SAR gridcells with 125 m grid resolution) more than one ice type or open water may exist. Consequently, a histogram of the NRCS distribution of such a 2 km×2 km box might show more than one mode, so the mean NRCS value might be based on a mixture of different surface types, each with a distinct typical NRCS value (Fig. 5b). When the time difference between ASAR image acquisition and ASPeCt observations was >0.5 hour, and when neither the histogram nor the 2 km ×2 km NRCS boxes provided a clear NRCS partitioning for different surface types, we looked into the NRCS distribution within 12.5 km×12.5km boxes centered at the ship’s position and the respective histograms. In this way, features such as floe boundaries or the location of the ship could be better identified and the representativeness of the NRCS value for the ice conditions within the particular 2 km×2 km box could be judged.
Histograms of the C-band HH-polarization radar backscatter (left) distribution shown in the maps (right) for a unimodal case (a) and a bimodal case (b). Note that while the mean value is quite close to the modal value in (a) it is not in (b) but would represent an ice-type mixture with NRCS of about –16 dB and –13 dB.

Observed NRCS Values
The dominant ice types, concentrations, the mean and standard deviations (± s.d.) of the NRCS values obtained are listed in Table 1. Figure 6 represents the time series of NRCS values (mean ± s.d.) for the encountered ice types: multi-year (MY), first-year (FY) and thick first-year (TFY) ice. NRCS values obtained from 2 km ×2 km boxes for TFY range from –16.3±1.1 to –7.6±1.0 dB; the maximum standard deviation for TFY is 1.7 dB. Just one NRCS value was obtained for MY ice: –12.6±1.3 dB. Note that the NRCS values of TFY increase with time from –~15 dB in December/January to –9 dB in mid-February.
Time series of C-band HH-polarization radar backscatter (NRCS) with ±1 standard deviation observed during Oden 2008 and Palmer 2009 for multi-year ice (diamonds) and thick first-year ice (squares). Dates are day.month.year.

In addition to the ASAR images co-located with ASPeCt observations, we have four ice cores with an ASAR overpass within 2 hours. Respective parameters are listed in Table 2. the ice type for ice cores is either FY or TFY ice. Snow depths and conditions at the snow–ice interface were, however, quite variable and we have to distinguish between flooded and non-flooded cases. During the Oden 2008 cruise, the NRCS takes values of –16.3 dB over TFY ice with just 3 cm of snow, and –14.9 dB over TFY ice with 52 cm of snow, both without flooding but with slush present at the snow–ice interface (December/January). During the Palmer 2009 cruise, the NRCS takes values between –13.6 and –8.0 dB over flooded FY or TFY ice with a deep snowpack (41 and 76 cm). Note that the lower value has been observed in mid-January, while the higher value (–8.0 dB) has been observed towards mid-February. Therefore, as shown in Figure 6, an increase of the NRCS over time can be observed. Note that, for both Figure 6 and Table 2, ASAR images were acquired at air temperatures below 0˚C. However, for the second (1 January; code O_IC2), third (14 January; code P_IC1) and last (8 February; code P_IC2) cores given in Table 2, air temperatures were close to or at the freezing point a few hours prior to core sampling and ASAR image acquisition (see Fig. 3a and b). For the second and fourth cores (O_IC2, P_IC2; Table 2) the ASAR image acquisition was before the core sampling, i.e. closer to the observed higher air temperatures.
Comparison of ice-core ice and snow properties and the co-located ASAR C-band HH-polarization radar backscatter value (NRCS) for Oden 2008 and Palmer 2009. ASPeCt ice types FY and TFY denote first-year ice (thickness 0.7–1.2 m) and thick first-year ice (thickness >1.2 m), respectively
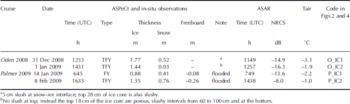
a5 cm slush at snow–ice interface; top 28 cm of ice core is also slushy.
bNo slush at top; instead the top 18cm of the ice core are porous, slushy intervals from 60 to 100 cm and at the bottom.
Interpretation and Discussion
The observed range of C-band NRCS values for FY and TFY ice (Table 2) agrees with other summertime sea-ice NRCS observations in the West Antarctic (e.g. Reference Morris, Jeffries, Li and JeffriesMorris and others, 1998). This range includes the NRCS value of –12.4±0.6 dB found by Reference Ozsoy-Cicek, Kern, Ackley, Xie and TekeliOzsoy-Cicek and others (in press) for late-winter/ early-spring conditions in the Bellingshausen Sea. the observed increase in C-band radar backscatter values with time (Fig. 6) agrees with the findings of Reference HaasHaas (2001) and Reference Kawamura, Wakabayashi and UshioKawamura and others (2006). the radar backscatter value observed for MY ice (Table 2), –12.6±1.3 dB, is also in agreement with earlier summertime observations of C-band radar backscatter (Reference Morris, Jeffries, Li and JeffriesMorris and others, 1998; Reference HaasHaas, 2001). Note that this value has higher standard deviation than that given by Reference Ozsoy-Cicek, Kern, Ackley, Xie and TekeliOzsoy-Cicek and others (in press) for late-winter/ early-spring conditions.
A substantial fraction of the large difference (3.2 dB) between the NRCS values for region O_Ao3 (Table 1; Fig. 2b) is likely caused by the incidence angle difference: 23˚ versus 40˚ (Table 1). According to Reference Nghiem and BertoiaNghiem and Bertoia (2001) and Reference Stern and MoritzStern and Moritz (2002), typical changes of C-band HH-polarization radar backscatter over Arctic FY and MY ice are ~1.5 and ~1.0 dB per 10˚ incidence angle, respectively. Assuming that a similar change rate is applicable for Antarctic sea ice, this would result in a decrease in the NRCS of the order of 2 dB in the aforementioned case between the observations at 23˚ incidence angle and 40˚ incidence angle. NRCS values for O_Ao3 corrected for the incidence-angle influence would then read –15.1±1.0 and –16.3±1.1 dB; accordingly the values would almost agree within one standard deviation. Therefore the difference in incidence angles must be kept in mind when comparing NRCS values of the same ice type from different samplings. the differences between the NRCS values observed on 8 February (Table 1) could more likely be an artifact caused by the increasing time difference between ASPeCt observation and ASAR image acquisition; for the last value (–7.6 dB) this difference is >2 hours.
Figure 6 reveals that on 14/15 January during Palmer 2009, TFY and MY ice cannot be discriminated by means of the obtained C-band HH-polarization NRCS values. the spread between the values will reduce if we take the incidence-angle influence into account (MY ice: 31˚; TFY ice: 21˚, 31˚ and 32˚ (Table 1)). Despite the data being from different seasons, this result is similar to the findings of Reference Ozsoy-Cicek, Kern, Ackley, Xie and TekeliOzsoy-Cicek and others (in press).
In the following, we discuss the observed range and temporal variation of the NRCS values in the context of the possible causes.
NRCS values versus ridged-ice fraction and volume
The sea-ice roughness is one of the factors that can influence C-band radar backscatter values. We calculated the areal fraction and the volume of ridged ice within the ASPeCt observation radius from the ASPeCt observations of the topography (x and y values of topography information in ASPeCt codes). For the areal fraction, this is done by considering the respective fraction of ridges within each of the three ice types observed, and calculating a weighted sum of the fraction of ridged ice. For the volume, the average sail height is also taken into account. Note that the volume only comprises the volume fraction above the level sea ice. Figure 7 displays the areal fraction (Fig. 7a) and the volume (Fig. 7b) for ASPeCt observations given in Table 1 together with the coincident C-band HH-polarization NRCS values. Larger fractions of ridged ice are associated with high C-band HH-polarization NRCS values according to observations carried out by Reference Drinkwater, Hosseinmostafa and GogineniDrinkwater and others (1995) and Reference Jeffries, Chuah and MorrisJeffries and others (1995); both teams noted an increase in C-band radar backscatter values by ~10 dB between undeformed and deformed FY ice. However, the spread in the values is large, as is the standard deviation of both the NRCS and the ridged-ice fraction. A similar picture is seen when looking at the volume (Fig. 7b): large volumes tend to be associated with higher C-band HH-polarization NRCS values.
Variation of C-band HH-polarization radar backscatter with ridged-ice area (a) and with volume of deformed ice (b) within ASPeCt’s 1 km observation radius (field of view (FOV)) around the ship. Error bars denote one standard deviation.

NRCS values versus TB37V
High daily average TB37V values are typical for melting conditions, because the high liquid water content in the snow cover causes a high emissivity and thus high brightness temperatures; it also masks the emission from the underlying sea ice. In contrast, comparably low daily average TB37V values associated with an elevated diurnal variation of TB37V values indicate that melt–refreeze cycles have commenced (Reference Willmes, Bareiss, Haas and NicolausWillmes and others, 2006, Reference Willmes, Haas, Nicolaus and Bareiss2009). These cycles cause alternating high (melting during the day) and low (refreezing during the night) liquid water contents in the snow; the low contents are additionally associated with coarse-grained snow which is known for a low emissivity and thus a lower brightness temperature than in the aforementioned case. Therefore we compare our observed C-band HH-polarization NRCS values with co-located AMSR-E TB37V values. To reduce the potential influence of a changing ice concentration on the co-located TB37V values, we used only those data pairs (TB37V, NRCS) where ice concentrations observed during ascending and descending AMSR-E overpasses varied by <25%.
Figure 8a displays 7 day average TB37V values taken from the nearest co-located 12.5 km gridcell, with the 7 day period centered at the day of ASPeCt observation and ASAR image acquisition. A 7 day average was used to reduce day-to-day TB variations due to changing weather conditions; this way the average situation is displayed. For Oden 2008, TB37V takes values around 237 K, while for Palmer 2009 on 14/15 January and 8 February, TB37V takes values of about 221 and 219 K, respectively. This decrease in TB37V makes sense, because Oden 2008 data were acquired in December/January, i.e. during peak melt season, while Palmer 2009 data were obtained later. Consequently, the liquid water content in the snow can be expected to be higher during Oden 2008 than during Palmer 2009, and thus higher TV37V values can be expected during Oden 2008 than during Palmer 2009. Note the extremely high standard deviation for TB37V values for Palmer 2009 on 8 February.
AMSR-E TB37V values in comparison to co-located coincident ASAR C-band HH-polarization radar backscatter (NRCS) values using (a) a 7 day mean TB37V at the ship’s position centered at the day of observation, and (b) a 1 day mean TB37V over a 3×3 gridcell area centered at the ship’s position at the day of observation. Error bars denote one standard deviation (NRCS: variation within the 2 km box around the ship’s position; TB37V: variation within the 7 day period (a) and variation within the 3×3 gridcell area (b)).

Figure 8b displays 1 day average TB37V values taken from a 3×3 gridcell box centered at the ship’s position. For Oden 2008 and Palmer 2009, on 14/15 January, TB37V takes values similar to those shown in Figure 8a: 242 and 219 K. However, for Palmer 2009 on 8 February, TB37V values are as high as 248 K, i.e. 30 K higher than the 7 day average value.
Table 3 summarizes the results of a similar comparison between NRCS values associated with the ice-core analysis (see Table 2) and co-located AMSR-E TB37V values. For each ice-core location, Table 3 gives for a 3×3 gridcell box centered at the ice-core location the daily average TB37V (column Tb), its standard deviation (=spatial variability; column s.d. Tb), the daily average ice concentration (column Ice con), and the difference between average TB37V values of the ascending and the descending overpasses (column Delta Tb) for an 8 day period ending 1 day after ice-core sampling.
Daily mean and standard deviation of brightness temperatures (Tb and s.d. Tb, respectively), daily mean ice concentrations (Ice con) and daily brightness temperature amplitude (Delta Tb) obtained from AMSR-E; temperatures are given in K, ice concentrations in %
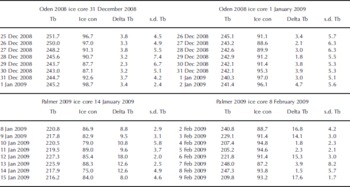
For core 31 December 2008 and core 1 January 2009, high TB37V values are observed, similar to Figure 8a and b. the total TB37V range is small: 8.7 and 4.8 K, respectively. Standard deviations are relatively high, ~6 K, and are partly determined by the day-to-day variation in the mean ice concentration (squared linear correlation coefficient 0.41). TB37V differences between ascending and descending AMSR-E overpasses remain on average <4 K and are less associated with ice concentration variations (squared linear correlation coefficient 0.24); a decrease (increase) in ice concentration would cause a decrease (increase) in TB37V. Taking Figure 6 into account and the information about snow depth and ice–snow interface properties given in Table 2, we suggest that melt conditions prevailed during Oden 2008 since TB37V values were high and TB37V differences between ascending and descending overpasses were low.
For core 14 January 2009, TB37V values are similar to Figure 8a and b, being ~220 K, and indicate a range of 11.1 K, between 216.2 and 227.3 K. Standard deviations are ~4 K, smaller than for the other two ice cores with a lower and similarly variable ice concentration. However, TB37V differences are substantially larger, taking values between 8 and 18 K (average 11.2 ±3.2 K). In comparison to the latter two cores (see above) we suggest that melt–refreeze has already commenced because TB37V values have dropped while TB37V differences have increased to values above 10 K, which is the value suggested by Reference Willmes, Haas, Nicolaus and BareissWillmes and others (2009) to indicate melt–freeze cycles.
Core 8 February 2009 reveals the most variable conditions: TB37V values vary from 205.2 to 248.0 K (i.e. over a range of 42.8 K), standard deviations take values between 1.7 and 8.2 K, and TB37V differences take values between 1.5 and 17.6 K (average 9.2 ±7.4 K). This agrees very well with the discrepancy between the 7 day and 1 day average TB37V values shown for this date in Figure 8a and b. the average TB37V difference does not exceed the above-mentioned threshold of 10 K. However daily TB37V values switch between very low values (~2 K) and values that exceed the threshold considerably (at least 14 K). Therefore we suggest that melt–refreeze has further advanced and is still in progress (see also the low 7 day average TB37V values given in Fig. 8a) but that unlike for core 14 January 2009 it is disturbed. One possibility could be snow-property changes due to advection of warm air.
Note that the air temperatures shown in Figure 3a for Oden 2008 and in Figure 3b for Palmer 2009 are not really suitable to aid this interpretation because (1) the liquid water content in the snow is not just determined by the air temperature but also by internal snowmelt due to shortwave radiation, and (2) the given temperatures display the situation at the ship’s location, which can vary substantially on a daily basis, and therefore the shown air-temperature time series cannot be used to explain surface conditions at a certain location 2 days before or after, for example, the ASAR image acquisition. We also note that air temperatures remained above –5˚C all the time, so liquid water could have been present in the snow all the time (Reference Garrity and CarseyGarrity, 1992). To better interpret the remote-sensing data, more and detailed investigations of the snow properties during both cruises would have been very helpful.
Conclusions
We compared Envisat ASAR C-band HH-polarization radar backscatter (NRCS) values with results from ice-core analysis and visual ship-based observations of sea-ice and snow properties carried out according to the ASPeCt protocol in the Bellingshausen and Amundsen Seas during two cruises (Oden 2008, Palmer 2009) in austral summer 2008/09. the dominant ice types encountered were TFY and MY ice, both with a snow cover typically several tenths of a meter thick. Flooding of the ice–snow interface was observed occasionally. the NRCS values obtained for MY (TFY) ice are 12.6±1.3 dB (–16.3±1.1 dB to –7.6±1.0 dB) and thus fall within the ranges reported in earlier studies dealing with summer Antarctic sea ice (e.g. Reference Morris, Jeffries, Li and JeffriesMorris and others, 1998). Average radar backscatter values for TFY increase from ~–15 dB in December/January to ~–9 dB in February, in agreement with findings by Reference HaasHaas (2001) for perennial ice in the Bellingshausen Sea and results by Reference Kawamura, Wakabayashi and UshioKawamura and others (2006) for fast ice in Lützow-Holm Bay.
The in situ observations of the snow and ice properties carried out during both cruises (ice cores and ASPeCt observations) as well as the observed meteorological parameters (e.g. air temperature) are not sufficient alone to interpret the observed radar backscatter values and their variation over time. We compared the radar backscatter values with the fraction of ridged ice and the associated ice volume derived from the ASPeCt observations. We found an indication that C-band HH-polarization radar backscatter values increase with increasing fraction of ridged ice (and volume). However, the investigated dataset is far too small to draw a conclusion; the scatter in the observed values as well as the NRCS values is too large.
We observed an increase in the C-band HH-polarization radar backscatter over time, which is accompanied by a drop in the 7 day average of co-located AMSR-E TB37V over time. This is consistent with the assumption that melt is at its peak in December/January, causing high liquid water content in the snow and thus high TB37V values/low C-band radar backscatter values. In February melt–refreeze cycles have commenced, causing a coarse-grained snow cover and thus a drop in TB37V values/high C-band radar backscatter values. This assumption is underlined by the fact that the difference in TB37V values between ascending and descending AMSR-E overpasses is ~4 K in December/January. However, starting in mid-January, values exceed the 10 K threshold given by Reference Willmes, Haas, Nicolaus and BareissWillmes and others (2009) as the indicator for melt–refreeze cycles. Thus, although the in situ observations of the ice and snow properties are very sparse we are confident the temporal radar backscatter change was caused by the transition from melt conditions to the commencement of melt–refreeze cycles.
Although it seems likely that snow-wetness changes and snow metamorphism have played the dominant role for the observed changes in C-band HH-polarization radar backscatter and in TB37V, more information about the vertical snow structure and its temporal evolution would be an asset for any interpretation of similar data in the future. It should be kept in mind that this study is just a case study, involving only 11 data pairs of in situ and satellite observations and as such its results must not be over-interpreted. If a similar study is planned for the future in the region encountered here, it should follow the examples given by the Ice Station POLarstern (ISPOL; Reference Hellmer, Haas, Dieckmann and SpindlerHellmer and others, 2008) and Sea Ice Mass Balance in the Antarctic (SIMBA; Reference LewisLewis and others, in press) cruises, during which detailed snow property observations were carried out on a drifting ice camp for a few weeks. However, instead of looking at just one ice floe we recommend trying to set up an array of automatic measurement stations (temperature profile in snow and ice, snow depth and ice thickness (by ice mass-balance buoy), short- and longwave radiation) at locations which (1) are spatially distributed over an area of several AMSR-E 12.5 km×12.5km gridcells, and (2) represent the dominant ice type of that particular region. At regular time intervals and on demand (e.g. when meteorological conditions change rapidly), these locations should be visited to obtain snow and ice samples to identify changes in the vertical layering (e.g. slush/ no-slush, flooding /no-flooding, density and grain-size changes) in the ice–snow system. A prerequisite that should not be overlooked in this context is the proper planning of SAR data acquisition in order to have a reasonable temporal and regional coverage with SAR data as was realized during SIMBA.
Acknowledgements
We acknowledge US National Science Foundation (NSF) grant ANT (AWT0703682) and NASA grant (NNX08AQ87G) to the University of Texas at San Antonio (UTSA) for support. Envisat images provided by ESA through Category-1 project (ID 6097) to UTSA are greatly appreciated. AMSR-E data were obtained from NSIDC. Ship-based observation data provided by P.L. Yager for the Oden 2008 and S. Stammerjohn for the Palmer 2009 are greatly appreciated. the Python code for processing and calibration of the Envisat ASAR images was kindly provided by L. Kaleschke. the International Space Science Institute (ISSI), Bern, Switzerland, is acknowledged for supporting this study via project 184.We thank the two anonymous reviewers as well as the scientific editor, I. Allison, for their comments which helped to substantially improve the manuscript.



