Implications
Next-Generation Sequencing technology offers the opportunity to gather information regarding the rumen microbiome by comparing repository databases of rumen bacteria 16S rRNA gene sequences generated through different experiments. The high extent of sequencing attained through this research provides valuable information on the microbial biodiversity of the liquid phase of the rumen and represents a contribution to research in rumen microbiology and dairy feed supplements. However, the effectiveness of yeast supplements to modify the rumen bacterial microbiome requires further investigation.
Introduction
Bacteria account for more than 95% of the total number of rumen microorganisms (Brulc et al., Reference Brulc, Antonopoulos, Berg Millera, Wilsona, Yannarella, Dinsdaled, Edwardsd, Frankh, Emersoni, Wacklini, Coutinhoj, Henrissatj, Nelsoni and White2009) and their metabolism has a significant effect on animal maintenance and performance. Although rumen bacterial populations have flexible metabolic capabilities, dietary composition and physical features of feedstuffs have a major influence on microbial diversity. Particularly, although the total microbial number often remains similar, changes might occur in terms of the microbiome composition or species makeup (Fernando et al., Reference Fernando, Purvis, Najar, Sukharnikov, Krehbiel, Nagaraja, Roe and DeSilva2010). The ecology of rumen microbes is based on a dynamic interaction between the host and the diet and is strictly related to the vital functions of the animal, such as its immune functions, regulation of extracellular signalling and competition with opportunistic pathogenic bacteria (Khafipour et al., Reference Khafipour, Li, Plaizier and Krause2009). These aspects increase the complexity in understanding the rumen ecology and its adaptation to different environments, which is also probably subject to the interplay between the rumen microbes and the host genome, as has been reported for other mammals (Turnbaugh et al., Reference Turnbaugh, Ley, Mahowald, Magrini, Mardis and Gordon2006).
Dietary supplements are widely used in dairy cows to increase their productivity through improving rumen metabolism. Yeasts, in particular different strains or commercial products of Saccharomyces cerevisiae, have been tested on dairy cows with a number of positive effects such as increased dry matter intake (DMI) and milk production (Wohlt et al., Reference Wohlt, Corcione and Zajac1998; Dann et al., Reference Dann, Drackley, McCoy, Hutjens and Garrett2000); improved diet digestibility (Erasmus et al., Reference Erasmus, Botha and Kistner1992; Marden et al., Reference Marden, Julien, Monteils, Auclair, Moncoulon and Bayourthe2008); stabilized rumen pH (Bach et al., Reference Bach, Iglesias and Devant2007); and stimulated rumen bacteria growth (Newbold et al., Reference Newbold, Wallace, Chen and McIntosh1995). However, there are also many studies with no or negative responses to yeast supplementation (Mwenya et al., Reference Mwenya, Santoso, Sar, Pen, Morikawa, Takaura, Umetsu, Kimura and Takahashi2005; Longuski et al., Reference Longuski, Ying and Allen2009; Chung et al., Reference Chung, Walker, McGinn and Beauchemin2011), probably related to the strong influence of the basal diet, the variation in yeast strains and the different commercial formulations.
Meta-analysis (Desnoyers et al., Reference Desnoyers, Giger-Reverdin, Bertin, Duvaux-Ponter and Sauvant2009; Robinson and Erasmus, Reference Robinson and Erasmus2009) of published lactation experiments with S. cerevisiae supplementation has shown an increase in milk production of 0.9 kg milk/day or 1.2 g milk/kg BW, but many factors were claimed to interfere with the results (e.g. strain and level of supplementation, DMI, dietary NDF, % of dietary concentrates). Moreover, theories about the physiological effects of live S. cerevisiae supplementation in dairy cows differ widely, and detailed investigations of the effects of yeasts on rumen microbiome composition are lacking.
High-throughput sequencing (HTS), such as pyrosequencing, is effective in obtaining sequences of a large number of microorganisms simultaneously, allowing metagenomic investigations of different microbiomes. Massive and parallel pyrosequencing of microbial communities allows the investigation of the variability of potential ‘rumen phenotypes’ and the bases of the diet–rumen microbiome interactions. A continually increasing amount of data on the rumen metagenome is being generated from HTS techniques, but little information is available regarding the rumen content fractions, which are likely to represent microorganisms related to the digestion of different substrates, that is, the soluble components in the liquid fraction and dietary fiber in the solid fraction (Pitta et al., Reference Pitta, Pinchak, Dowd, Osterstock, Gontcharova, Youn, Dorton, Yoon, Min, Fulford, Wickersham and Malinowski2010).
In this study, a gene-centric metagenomic approach is used to investigate the microbiome composition of the liquid fraction of the rumen content obtained from 12 lactating dairy cows supplemented with potato protein or with a similar amount of lyophilized or dried S. cerevisiae. The aim is to provide insight into the bacterial composition and its biodiversity, as a basis for further investigations.
Material and methods
Animals, milk production, diets and sample collection
Twelve lactating Friesian cows housed in the same barn and fed the same diet were used for the experiment. Animals were of the first to third parity from 60 to 240 days in milk. Animals had ad libitum access to water and were offered a total mixed ration (17.3 kg DM/head per day), formulated to cover the nutrient requirements for lactation (INRA, 1988). The diet consisted of 532 g/kg DM corn silage, 255 g/kg DM lucerne forage, 154 g/kg DM cereals (60 : 40 corn and barley meal proportion), 44 g/kg DM protein supplement (soy bean meal and hydrolyzed potato protein), and 15 g/gk DM vitamin and mineral supplement. Animals were fed twice a day, at 0700 and 1700 h and the supplements were given individually once daily with the morning feeding. Milk production was recorded individually for 30 days, starting from 15 days before the beginning of the experimental period.
At the beginning of the experiment, cows were split into three groups of four animals each, paired for parity, milk yield and stage of lactation. The average milk yield was 29.5±4 kg/day. The three groups were randomly assigned to experimental treatments: Group LY (yeast form 1), Group DY (yeast form 2) and a Control Group (Ctrl; potato protein). Cows in the LY group received 50 g/head per day of a commercial live lyophilized brewer’s yeast (DM 95.5%, CP 46.0%, L 4.7%, CF 0.5%, ash 6.0%; vital count 1×10¹⁰ cfu/g). Those in the DY group were given a supplement of 50 g/head per day of dried brewer’s yeast (DM 95.0%, CP 32.0%, L 1.8%, CF 0.2%, ash 28%). The control group received 50 g/head per day of hydrolyzed potato protein (DM 90.0%, CP 86.0%, L 3.6% CF 0.6% and Ash 3.1%). After 14 days of supplementation, rumen contents were collected 1 h after the morning feeding with an oesophageal probe. A sample of about 40 g of rumen contents was collected, which were separated immediately into two aliquots of about 20 g each, one without fixative for DNA extraction and the second (20 ml) with 1 ml of 85% ortophosphoric acid (H2PO4) for volatile fatty-acid (VFA) determination. The aliquots were frozen at −80°C until analysis or DNA extraction.
Sample fractioning and VFA analysis
For DNA extraction, the aliquots of whole rumen content were centrifuged for 5 mins at 750×g to separate the solid phase from the liquid phase. The supernatant was transferred to a tube and centrifuged for 20 mins at 12 000×g. The pellet formed was washed with buffer solution (NaCl 0.9%), centrifuged again and the supernatant discarded. For VFA analyses, the second aliquot of the whole rumen contents was centrifuged at 20 000×g for 30 min at 10°C. The supernatant was filtered using a 25 mm syringe filter with a 0.45 µm polypropylene membrane (VWR International Srl, PA, USA) and the filtrate analyzed by HPLC at 220 nm (LC 200 Perkin-Elmer pump connected to a model ISS-100 autosampler (20 μl loop) with a UV-Vis model LC 95 Perkin-Elmer detector, Perkin-Elmer, Norwalk, CN, USA). Separations were achieved using an Aminex HPX-87 H column (300 mm×7.8 mm) and one pre-column (Bio-Rad, Hercules, CA, USA) with the thermostat at 40°C.
For data collection and integration, Turbochrom software with two NCI 900 PE Nelson Perkin Elmer interfaces was used. For a complete analysis of VFA by HPLC, a 40 min isocratic programme was run with H2SO4 0.008N as a mobile phase at a flow rate of 0.6 ml/min. Peaks of compounds were identified by comparing retention times of standard mixtures with those of the samples and quantification was based on peak area measurements on the basis of an external standard.
Metagenomic DNA extraction
The DNA from the pellets of the liquid fraction was extracted with a Fecal DNA MiniPrep kit (Zymo Research; Irvine, CA, USA) following the manufacturer’s instructions, including a bead beating step. Pre-amplification of DNA concentration in the samples was measured with a Quant-iT dsDNA BR Assay (Invitrogen, Carlsbad, CA, USA). The primers used for the Eubacteria 16S rRNA amplification were F8 AGAGTTTGATCCGGCTCAC (Baker et al., Reference Baker, Smith and Cowan2003) and R534 ATTACCGCGGCTGCTGGC (Liu et al., Reference Liu, Lozupone, Hamady, Bushman and Knight2007), which produced amplicons of about 500 base pairs (bps). The primers were chosen to amplify the eubacteria 16S rRNA regions V1–V3, as reported by Liu et al. (Reference Liu, Lozupone, Hamady, Bushman and Knight2007 and Reference Liu, DeSantis, Andersen and Knight2008), as being the most reliable to produce community clusters and to accurately assign taxonomy in a large data set (Kumar et al., Reference Kumar, Brooker, Dowd and Camerlengo2011; Vilo and Dong, Reference Vilo and Dong2012). The primers above were added with multiplex identifier tags and 454 adapters A and B to allow pooling of the amplicons generated from different individuals before sequencing. PCR amplification was initially performed in a CFX96 Real-Time PCR detection system (Bio Rad, Hercules, CA, USA) using the EvaGreen™ dye (Biotium, Hayward, CA, USA) and two units of the Phusion® Hot Start High-Fidelity DNA Polymerase (Finnzymes, Varta, Finland) according to the manufacturer’s instructions. Optimal PCR conditions were found with the following thermal profile: an initial 1-min denaturation step at 95°C, followed by 25 cycles at 95° for 20 s, 65°C for 15 s and 72°C for 30 s. Amplification products were analysed with a 65°/95°C melting curve. The same thermal profile was thus used for metagenomic DNA (3 to 11 ng) amplification with Mastercycler® epgradient S (Eppendorf, Hamburg, Germany), adding a final extension step at 72°C for 1 min. The samples were checked on TBE 2% gel and extracted and purified with HiYeld™ Gel/PCR DNA Fragments Extraction kit (RBC Bioscience, Taipei, Taiwan), according to the manufacturer’s instructions. After purification, sample concentrations were measured by a Quant-iT dsDNA BR Assay (Invitrogen, Carlsbad, CA, USA) and the pooled samples were sent to an external sequencing service for pyrosequencing on half a plate of a Roche 454 GS FLX Titanium series. Collection and sequence information were deposited at GenBank SRA (short read archive) under accession number SRA049734.1.
Metadata analysis
Trimmed fastA files from pyrosequencing Roche 454 GS FLX Titanium series were analysed with the online RDP Classifier 2.3 (http://rdp.cme.msu.edu; Ribosomal Dataset Project; Cole et al., Reference Cole, Wang, Cardenas, Fish, Chai, Farris, Kulam-Syed-Mohideen, McGarrell, Marsh, Garrity and Tiedje2008) for Operational Taxonomic Units (OTUs) identification, rarefaction curves and α-biodiversity calculations, by targeting our samples on bacterial small-subunit 16S rRNA. Hierarchical clustering analysis was applied for OTUs definition, whereas for the analysis of α-biodiversity the nonparametric Chao1 estimator (Chao, Reference Chao1984) and the Shannon Index, H′ (Shannon and Weaver, Reference Shannon and Weaver1949) were used.
For taxonomic analysis, the community visualization tool for the Eubacteria domain at the genus taxonomic level, including not assigned taxa from the online VAMPS service (http://vamps.mbl.edu) was used (data not shown). Sequences were then annotated and assigned with the GAST assignment method, which blasts each high-quality tag against a reference database of hypervariable sequences of the regions V1-V3 (RefV1-V3) from the 16S rRNA database (Ref16SSU). First, the tag was aligned against the top 100 BLAST hits and the Ref V1-V3 matches having the minimum pairwise distance to the tag were selected. For each best Ref V1-V3 match, all sources from Ref 16SSU sequences were selected and a consensus agreement of ⩾66% of selected Ref 16SSU sources was calculated. The consensus taxonomy was then applied to the tag.
Statistical analysis
The differences of total VFA contents (mMol/l) and their molar percentages in the rumen fluid samples between the groups were evaluated using the ANOVA model with ‘group’ as a fixed factor. Pearson’s coefficients indicated the correlation between the microbiome composition and the VFA proportions in the rumen contents. All the statistical analyses were performed with SPSS (SPSS, 1997).
Results
During the recording period, the mean±s.d. milk yields did not significantly differ between treatments and were 28.9±4.4, 29.1±4.5 and 30.1±4.3, respectively, for the LY, DY and Ctrl groups.
Sequencing data and biodiversity analysis
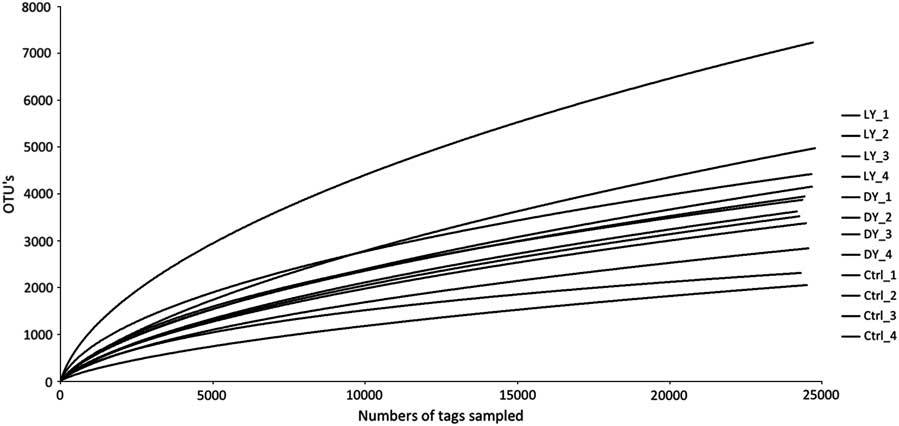
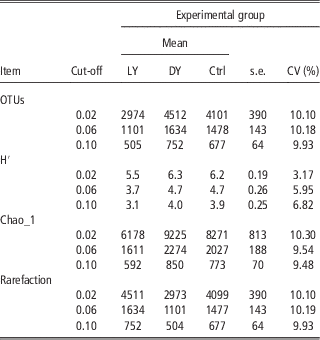
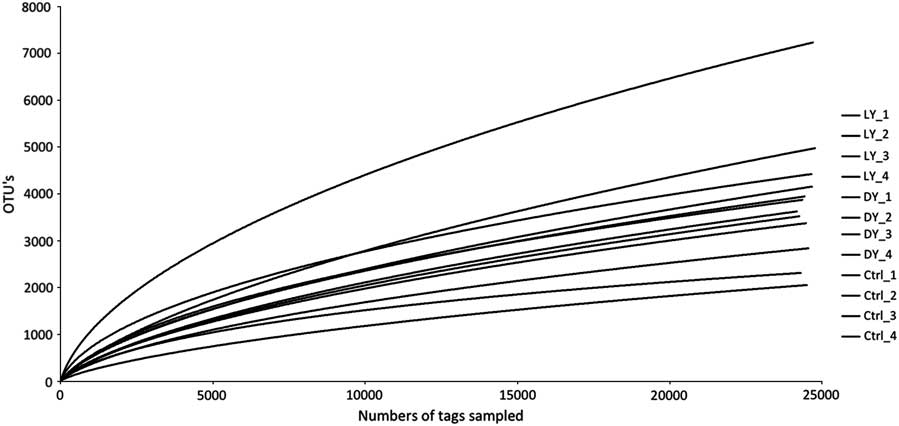
The number of reads sequenced per sample showed a good reliability for sequencing depth, further confirmed by the small difference in number, length and average quality score of sequences of different samples. The mean number of 16S sequence reads per sample was 30 245 with a mean length of 458 bps (minimum 455; maximum 461). To compare alternative definitions, the classification of sequences into OTUs and biodiversity indexes of Chao1 and H′ were calculated with a stair-step cut-off of 0.02 from 0.00 to 1.6 (data not shown). The analysis of the results indicate that the 0.10 cut-off (10% similarity among sequences) leads to comparable mean values between Chao1 and OTU values (i.e. estimated and detected (Table 1). The rarefaction curves (Figure 1) for a cut-off of 0.02 indicate the very high-sequencing depth and the reliability of the results, independently from the number of tag sampled. No significant differences between the groups are shown for OTU and Chao1 at the selected cut-offs. In addition, the Shannon biodiversity index (H′) for species richness in the fluid fraction does not significantly vary between treatments, indicating a large variability between cows or a limited effect of the treatment.
Rarefaction curves of all 12 samples at 0.02 distance cut-off. Distance cut-off indicates the similarity threshold among sequences needed to be clustered in an Operational Taxonomic Unit. (A 0.1 distance cut-off indicates sequences similarity of 90%).
Number of OTU, Shannon (H′) and Chao_1 biodiversity indexes and rarefaction data of bacterial microbiome measured in rumen liquid fluid of cows daily supplemented with 50 g LY, 50 g DY or with 50 g potato protein (Ctrl) using increasing distance cut-off values

LY=lyophilized yeast; DY=dried yeast; OTU=Operational Taxonomic Units; Ctrl=Control.
Differences between means were never significant (P>0.05)
Distance cut-off indicates the level of similarity (units) among sequences needed to be clustered in an OTU. (A 0.1 distance cut-off indicates sequences similarity of 90%).
16S rRNA annotations, phylogenetic analysis and effect of yeast supplementation
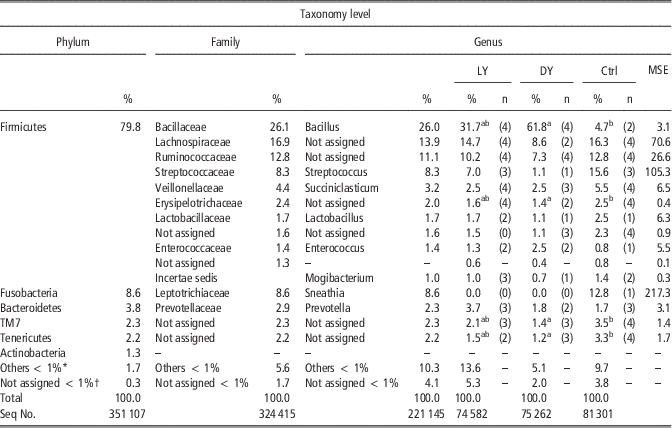
Taxonomic annotations (352 031 sequences for the 12 samples) were performed for the bacteria domain at the different levels and the assigned sequences belonging to abundant phylotype members, having a frequency higher than 1% (Fuhrman, Reference Fuhrman2009), are reported in Table 2. Within the annotated sequences, Firmicutes is the most represented phylum (79.76%), followed by Fusobacteria (8.60%), Bacteroidetes (3.84%), TM7, Tenericutes and Actinobacteria. Members at the phylum level having a frequency lower than 1% (rare members, included in the ‘others’ in Table 2), are Chloroflexi (0.54%), Proteobacteria (0.44%), Cyanobacteria (0.22%), Spirochaetes (0.20%) and Verrucomicrobia (0.17%). A small amount (0.26%) of the coding sequences could not be assigned to a phylum. Many sequences are identified only down to the order, class or family level (e.g. Ruminococcaceae, Lachnospiraceae). Among the identified genera, the most represented are Bacillus (26.03%), Sneathia (8.60%), Streptococcus (8.28%) and Succiniclasticum (3.20%). No genera were assigned to any of the two highly represented families, Lachnospiraceae and Ruminococcaceae. Annotated genera having a low frequency are Lactobacillus, Enterococcus and Mogibacterium (1.70%, 1.35% and 1.02%, respectively) and Prevotella (2.32%). For more than 30 genera, the percentage in the liquid phase was lower than 1%, and these genera are included in the ‘others’ in Table 2 (Fuhrman, Reference Fuhrman2009). Within these genera, the most represented (range 0.4% to 1.0%) are Butyrivibrio (0.86%), Lysinibacillus (0.70%), Ruminococcus (0.66%), Marvinbryantia (0.47%) and Clostridium (0.45%), all belonging to the phylum Firmicutes, and Atopobium (0.56%) belonging to the phylum Actinobacteria.
Average taxonomic frequencies distributions and number of assigned sequences (Seq) at a phylum, family and genus levels of microbiome in rumen liquid fractions and effect of yeasts supplementation at the genus level
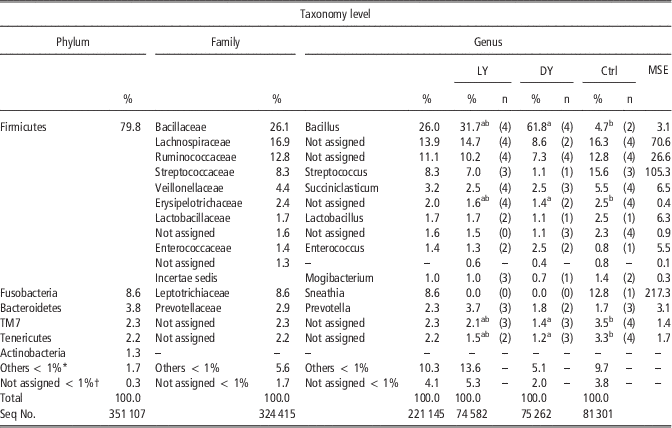
LY=lyophilized yeast; DY=dried yeast; Ctrl=Control; MSE=mean square error.
Results of statistical analysis (ANOVA) and frequency values between the LY group (lyophilized yeast), DY group (dried yeast) and Control group (potato protein) is reported only at a genus level, as data for phylum and family are not significant between groups (frequency are the average for the 12 rumen samples).
In brackets, the number of cows in each experimental group that presented the annotated sequences.
*Others < 1%: sequences assigned to other Taxa having a frequency lower than 1%.
†Non-assigned < 1%: sequences not assigned belonging to Taxa having a frequency lower than 1%.
a,bSignificant difference (P<0.05).
The comparisons of individual bacterial microbiomes indicated that the classes Bacilli and Clostridia of Firmicutes phylum were common in the 12 samples. The genus Bacillus was detected in 10 of the 12 cows, with the highest prevalence for all the cows of DY treatment. Members of the genus Streptococcus were identified in seven cows, and was the most abundant taxa in some cows (up to 35.66%). Families Lactobacillaceae and Enterococcaceae and their respective genera Lactobacillus and Enterococcus were detected in samples of a limited number of cows (n=5).
The family Ruminococcaceae is present with a non-assigned genus in all samples ranging from 2.32% to 20.63%. Within this family, Ruminococcus and Faecalibacterium are the most identified genera (Table 2). Within the same class, the Lachnospiraceae family is also common to all samples, but the most abundant genus are not identified and the other genera are Marvinbryantia, Blautia, Butyrivibrio, Syntrophococcus and Acetitomaculum (Table 2).
Bacteria belonging to the class Clostridia family Veillonellaceae genus Succiniclasticum were represented in all except for one cow, which also showed the lowest level of biodiversity (data not shown). Other identified genera such as Selenomonas, Schwarzia and Mogibacterium are detected only in few cows (Table 2).
Within the phylum Bacteroidetes, only the Bacteroidia class is detected, with two families identified, Prevotellaceae, accounting for 2.86% of the total sequences, and Rikenellaceae, accounting for <1%.
Bacteria belonging to Prevotellaceae and Rikenellaceae families are represented in eight and two cows, respectively, although the most prevalent genus identified (Prevotella) never exceeded 4% of the bacteria in the liquid fraction rumen content.
The genus Sneathia is found only in one cow of the Ctrl group, which accounted for more than 50% of the bacterial metagenome.
Limited differences between the DY group with the LY and Ctrl groups are observed for the bacterial microbiome at the genus level (Table 2).
In particular, differences (P<0.05) are observed between the DY group and the Ctrl group for the genus Bacillus, for a non-assigned genus of Erysipelotrichaceae family and for two non-assigned genera belonging to the TM7 and Tenericutes phyla, respectively.
Among the rare members, Firmicutes Ruminococcus was also under-represented in the DY group and showed frequencies of 0.27%, 0.91% and 0.63% in the DY, LY and Ctrl groups, respectively (P<0.05).
Rumen VFA’s analysis and bacterial microbiome associations
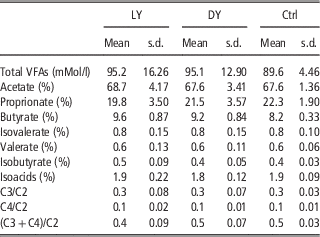
The average content of VFA in the rumen liquid (Table 3) is 95.2 in LY, 95.1 in DY and 89.6 mMol/l in the Ctrl group (P>0.05).
Mean concentrations (±s.d.) at the Time 15 of total volatile fatty acids (mMol/l), molar proportion of individual fatty acid (%) and ratio of fatty acids in rumen fluid of the LY group (lyophilized yeast), DY group (dried yeast) and Ctrl (potato protein) group

Ctrl=Control.
Comparison of the means between groups were not significant (P>0.05).
C3/C2: propionate to acetate ratio.
C4/C2: butyrate to acetate ratio.
(C3+C4)/C2 ratio: propionate plus butyrate to acetate ratio.
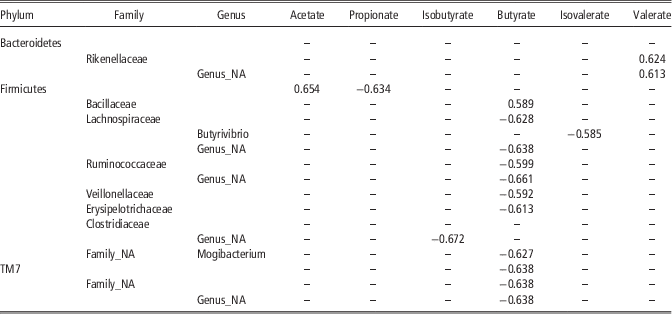
The highest and most significant Pearson correlations are found between the molar proportions of butyrate in the rumen liquid and the bacterial microbiome composition both at the phylum, family and genus level (Table 4).Negative correlations with butyrate are calculated for Firmicutes Lachnospiraceae, Ruminococcaceae, Veillonellaceae, Erysipelotrichaceae families, for Mogibacterium genus and for TM7 phylum. Only for the Bacillaceae family in the Firmicutes phylum, a positive correlation with butyrate is shown. This phylum also shows uniquely significant correlations with acetate and propionate, with opposite signs. Significant correlations are also shown for valerate with the Bacteroidetes family Rikenellaceae, for isovalerate with the genus Butyrivibrio and for isobutyrate with an unknown genus of Clostridiaceae family.
Coefficients of correlation between the abundance of bacterial taxa and molar percentage of volatile fatty acids in the rumen content (n=12)

Pearson correlation is reported for phylum, families and genus.
Only significant coefficients (P<0.05) are reported.
Discussion
Sequencing and biodiversity
The composition of the microbial population in the rumen affects the degradation of feeds, DMI, host nutrient supply and animal health (Fernando et al., Reference Fernando, Purvis, Najar, Sukharnikov, Krehbiel, Nagaraja, Roe and DeSilva2010; Kong et al., Reference Kong, Teather and Forster2010; Mosoni et al., Reference Mosoni, Martin, Forano and Morgavi2011). The advent of Next-Generation Sequencing (NGS) offers a breakthrough opportunity to go deeper into this knowledge (Woelders et al., Reference Woelders, Te Pas, Bannink, Veerkamp and Smits2011) and new rumen research in this field has recently been published (Brulc et al., Reference Brulc, Antonopoulos, Berg Millera, Wilsona, Yannarella, Dinsdaled, Edwardsd, Frankh, Emersoni, Wacklini, Coutinhoj, Henrissatj, Nelsoni and White2009; Kong et al., Reference Kong, Teather and Forster2010; Jami and Mizrahi, Reference Jami and Mizrahi2012; Ross et al., Reference Ross, Moate, Bath, Davidson, Sawbridge, Guthridge, Cocks and Hayes2012). As a first attempt to depict the variation of the microbiome composition subsequent to yeast supplementation, NGS was applied to the rumen fluid fraction. The rumen fluid fraction contains small non-degraded feed particles, metabolites, free microbes and microbial remnants, and the richness of bacterial populations is considered to be much lower than that of bacteria adherent to large particles of feeds (Kong et al., Reference Kong, Teather and Forster2010). As oesophageal tubing was the mode of collection in the current experiment, analyses have been limited to the rumen liquid fraction as this collection technique does not generate representative samples of the solid phase of the rumen content, as this fraction is mainly composed of an intermediate layer of heterogeneous digesta (Hobson, Reference Hobson1988) at different stages of fermentation.
From the rarefaction curves (Figure 1), it appears that the sequence depth reached in the current experiment allowed an in-depth investigation of the biodiversity of the rumen samples. As a consequence of the sequencing depth, the OTUs classified from the rumen microbiomes in the present experiment (Table 1) are higher than in other studies. In particular, in the studies by Kong et al. (Reference Kong, Teather and Forster2010) and Fernando et al. (Reference Fernando, Purvis, Najar, Sukharnikov, Krehbiel, Nagaraja, Roe and DeSilva2010), which used technologies producing lower sequencing depths (clone libraries and T-RFLP), the OTUs at 0.03 cut-off were 613 in the first study and 315 or 398, depending on the experimental group, in the second study. The H′ data reported by Kong et al. (Reference Kong, Teather and Forster2010), for a cut-off of 0.03, ranged from 4.50 to 4.62 for the liquid fraction and from 4.74 to 4.78 for the particulate fraction. The reported values are very close to the H′ of Table 1 for a 0.6 cut-off.
However, a full analysis of the microbiome composition is not only dependent on the use of NGS, but also on the number of reads per sample. The number of OTUs estimated from rarefaction analysis by Pitta et al. (Reference Pitta, Pinchak, Dowd, Osterstock, Gontcharova, Youn, Dorton, Yoon, Min, Fulford, Wickersham and Malinowski2010) were 647 and 808. The authors used a cut-off of 0.03 and an average depth of pyrosequences of 2141 and 3046 for liquid and solid fractions, respectively. This value is considerably lower than the mean value of 3862 OTUs reported in Table 1 for the 0.02 cut-off (average of experimental groups). However, data obtained in different experiments are not straightforward to compare, as they are affected by environmental conditions (i.e. feeding, management, healthy status, etc.), sampling technique, depth of sequencing and, probably, animal genetic.
Identification and distribution of 16S rRNA assigned sequences in the experimental groups
According to the assignment of 16S rRNA sequences to the NCBI database (Table 2) genera of the phylum, Firmicutes are the most represented and the genus Bacillus is the most abundant in both yeast-supplemented groups (LY and DY groups P<0.05 in comparison with the Ctrl group). Conversely, genera of the phylum Bacteroidetes (Prevotella and Rikenella) are detected at lower frequencies.
Instead, Pitta et al. (Reference Pitta, Pinchak, Dowd, Osterstock, Gontcharova, Youn, Dorton, Yoon, Min, Fulford, Wickersham and Malinowski2010), comparing Bermuda grass hay with grazed winter wheat diets fed to cows, reported that genera of the phylum Bacteroidetes were the most abundant in the rumen bacterial community followed by genera of Firmicutes, both in the solid and the liquid fractions. The same authors reported that the prevalence of the genera Prevotella and Rikenella were not different between both rumen fractions and diets. In a study by Kong et al. (Reference Kong, Teather and Forster2010), the composition of the bacterial communities in the rumen of cows fed lucerne or triticale differed between the tightly attached to particulate populations compared with the planktonic and those loosely attached to particulates. Differences in sampling procedures and dietary composition can partly explain the variation of the rumen microbiome composition in comparison with the present study. A further difference can be related to the higher sequencing depth and to the 16S region sequenced (V1-V3), which probably lead to a more complete and different description of the microbial phylogenic distribution. This is confirmed by Brulc et al. (Reference Brulc, Antonopoulos, Berg Millera, Wilsona, Yannarella, Dinsdaled, Edwardsd, Frankh, Emersoni, Wacklini, Coutinhoj, Henrissatj, Nelsoni and White2009), who obtained a more accurate bacterial partitioning on the same samples by increasing the sequencing depth with the use of NGS. Brulc et al. (Reference Brulc, Antonopoulos, Berg Millera, Wilsona, Yannarella, Dinsdaled, Edwardsd, Frankh, Emersoni, Wacklini, Coutinhoj, Henrissatj, Nelsoni and White2009) obtained, from samples collected in the same period (1 h after morning feeding) and 454 sequencing, a percentage of Firmicutes in the liquid fraction lower than the value reported in this study (62% v. 79%).
Data on the effects of S. cerevisiae on microbiome composition are not available in the literature, and some evidence, summarized by Desnoyers et al. (Reference Desnoyers, Giger-Reverdin, Bertin, Duvaux-Ponter and Sauvant2009) and Robinson and Erasmus (Reference Robinson and Erasmus2009), does not allow to postulate how yeast can affect the rumen bacterial microbiome. The results presented in Table 2 for the three experimental diets indicate a limited influence of dried yeast (DY group) on rumen bacteria, which is significant (P<0.05) for the percentages of Bacillus (P<0.05), for a non-assigned genus of Erysipelotrichaceae, and for a non-assigned genus of the phyla TM7 and Tenericutes, even if the metabolic meaning of these variations is currently unknown. The average VFA content and their molar proportions and ratios (Table 3) are not significantly affected by the lyophilized or the dried form of S. cerevisiae inclusions. These parameters were analyzed at time 0 and did not differ between the groups. For instance, the mean total VFA content (mmol/l) was equal to 82.4±7.19, 85.6±7.93 and 79.3±9.58, and the molar proportions of acetate were equal to 68.5±4.26, 70.4±1.56 and 68.2±3.48 for the Ctrl group, DY group and LY group, respectively. After 15 days (Time 15), the standard deviations of the total VFA content and of the molar proportions of acetate, propionate and butyrate were lower in the Ctrl group in comparison with the DY group and the LY group. Considered together, these data suggest that the effect of yeast supplementation was limited and that the inter-animal variability was not negligible, excluding a firm conclusion on the yeast treatment.
The correlation of Firmicutes with acetate and propionate indicates a fibrolytic metabolic pattern of this phylum (Sawanon and Kobayashi, Reference Sawanon and Kobayashi2006; Sawanon et al., Reference Sawanon, Koike and Kobayashi2011), but the understanding of the other correlations reported in Table 4 requires knowledge of the metabolic pathways of each bacterial strain within the rumen.
The negative correlation of families and genera of the Firmicutes and TM7 with butyrate concentrations suggests that either the bacteria of these phyla can use the butyrate for their metabolism or that they are competing for the same substrate with butyrate-producing species.
Conclusions
This work represents a preliminary study to investigate the rumen microbiome of liquid fraction in lactating cows fed with or without yeast supplementation. The high depth of pyrosequencing allows to depict the microbial biodiversity of the liquid rumen contents, which represents a further contribution to the knowledge of the rumen ecosystem. The inclusion of 50 g of dry or lyophilized yeast in the diet had minor effects on the rumen microbiome, but has to be considered as preliminary conclusion, given the limited number of cows allotted to dietary treatments and the lack of rumen samples collected before the yeast supplementation. However, the present study can provide further information on the composition of the rumen microbiome in the liquid fraction and should be viewed as a starting point for future studies.
Acknowledgement
Research funded by FESR and Italy within the program for the ‘Cooperazione Transfrontaliera Italia Slovenia 2007–2013’.