




No CrossRef data available.
Article contents
Longitudinal outcomes of very low birth weight: Neuropsychological findings
Published online by Cambridge University Press: 01 March 2004
Abstract
To investigate the effects of very low birth weight (VLBW, <1500 g) on the development of neuropsychological skills, we assessed 67 children with birth weight <750 g, 64 with birth weight 750–1499 g, and 67 term-born controls. Growth modeling of raw scores from mean ages 7–14 years revealed persistent VLBW sequelae. Even when adjusting for IQ, the <750 g group scored more poorly than the term-born group on measures of language processing, verbal list learning, and perceptual–motor and organizational abilities. This group also made slower age-related progress than the control group on tests of perceptual-motor and executive functions. Environmental factors moderated group differences in change on other cognitive measures. These results revealed further evidence for slower skill development in both VLBW groups relative to controls, as well as“catch-up” growth in the 750–1499 g group on some measures. The findings suggest age-related changes in the cognitive sequelae of VLBW that depend on the skill assessed, the degree of VLBW, and environmental factors. (JINS, 2004, 10, 149–163.)
Information
- Type
- Research Article
- Information
- Journal of the International Neuropsychological Society , Volume 10 , Issue 2 , March 2004 , pp. 149 - 163
- Copyright
- © 2004 The International Neuropsychological Society
INTRODUCTION
Prior to the 1980s, few children with birth weights <750 g survived. Survival rates have increased dramatically over the last two decades (Hack & Fanaroff, 1999; Hack et al., 1996a). Unfortunately, this increase has not been accompanied by decreased neonatal morbidity or improvements in short-term outcomes, but by an increase in the absolute number of children with health and developmental problems (Lorenz et al., 1998). Cohorts of children within the broader, very low birthweight (VLBW, <1500 g) classification obtain lower scores than normal birthweight term-born controls on tests of global cognitive function and achievement (Hack et al., 1996b; Taylor et al., 2000a). VLBW cohorts also have higher rates of educational difficulties, behavior disorders, and health problems than control children (Hack et al., 1993; Szatmari et al., 1993; Taylor et al., 1998a). Weaknesses in attention and executive function, perceptual motor skills, verbal list learning, and math achievement are frequently reported. These weaknesses are found even when controlling for IQ or when excluding children with cerebral palsy, hearing or vision problems, or global cognitive impairment (Goyen et al., 1998; Hack et al., 1992; Klebanov et al., 1994; Klein et al., 1989; Luoma et al., 1998; Taylor et al., 2000b, 2000c, 2002). Findings indicating that these problems are more frequent and severe in children with lower birth weights suggest a gradient effect (Breslau et al., 1996; Klebanov et al., 1994; Taylor, 2000b).
Studies of childhood outcomes of diffuse brain insults incurred early in life provide little reason to predict recovery of function, or plasticity, in VLBW children during the school-age years (Taylor & Alden, 1997). On the contrary, several considerations lead to expectations for age-related increases in these sequelae. The high rate of neonatal brain insults in VLBW children, including periventricular hemorrhagic infarction, periventricular leukomalacia, and associated white matter damage (Perlman, 1998; Volpe, 1998), raises the possibility that these children lack the capacity to acquire skills as efficiently as their peers. Given the susceptibility of VLBW children to frontal–striatal pathology, in combination with the continued development of these brain regions through puberty (Huttenlocher & Dabholkar, 1997), new or more severe manifestations of early insults may emerge as children reach adolescence. Persisting, or even worsening, sequelae of VLBW with advancing age would also be consistent with the poor cognitive recovery shown by young children with traumatic brain injuries, and with the slowed rates of growth in cognitive and achievement skills exhibited by children with more severe forms of meningitis (V. Anderson et al., 2000; Levin et al., 2000; Taylor et al., 2000d; Thompson et al., 1994).
However, studies examining outcomes of VLBW during the school-age years have yielded mixed results. Some investigations suggest a trend toward increasing problems over time continuing into adolescence (Botting et al., 1998; Carran et al., 1989; Cohen et al., 1996; Monset-Couchard et al., 1996; O'Callaghan et al., 1996; Taylor et al., 2000b; Zelkowitz et al., 1995), while others indicate relatively stable developmental sequelae (Breslau et al., 2001; Powls et al., 1995; Rickards et al., 1988; Schothorst & van Engeland, 1996; Stevenson et al., 1999). One recent study even found increasingly age-appropriate scores on tests of receptive vocabulary and IQ in a VLBW cohort followed from 3 to 8 years of age (Ment et al., 2003). These inconsistencies may be explained by variations in study methodology. Many studies, for example, have failed to enroll an appropriate control group, assessed outcomes at only a single point in time, or used a limited set of outcome measures. Differences in sample characteristics, including sociodemographic status and the proportion of children with extremely low birth weights or more severe neonatal complications, may also account for variable results.
A further reason for inconsistency in study findings is that investigators have rarely used growth modeling techniques to analyze age-related changes in outcomes and the effects of environmental influences on these changes (Burchinal et al., 1994). Growth modeling is especially well suited for analysis of longitudinal follow-up data, as it avoids unwarranted statistical assumptions required by more traditional analytic approaches and is more sensitive to individual variation in growth rates or factors that predict change (Francis et al., 1991). In one of the few VLBW studies employing growth modeling, Landry et al. (1997, 1998) and Miller et al. (1995) followed children with birth weight <1600 g and gestational age <36 weeks, together with full-term controls, over a follow-up period extending from 6 to 40 months of age. Growth modeling methods revealed slower gains in cognitive and social skills in the VLBW group than in controls. Group differences, moreover, were moderated by parenting characteristics. For example, Landry et al. (1998) demonstrated that higher levels of maternal efforts to maintain children's attention predicted steeper increases in initiating behaviors, but that this relationship was stronger for children with VLBW than for controls. They also found that maternal sensitivity was more strongly related to increases in children's initiating behaviors for children with VLBW who had more severe neonatal complications. To our knowledge, changes in VLBW sequelae during later childhood have not been examined in this manner.
The major objective of this study was to investigate changes in the neuropsychological sequelae of VLBW during the school-age years and to explore factors related to these changes. Our first hypothesis was that children with VLBW would have poorer neuropsychological outcomes than term controls throughout a follow-up interval extending from mean age 7 to 14 years. In view of past demonstrations of poorer outcomes in children with more extreme VLBW, we anticipated that sequelae would be more marked in children with <750 g birth weight than in those with 750–1499 g birth weight. Given evidence for specific cognitive deficits, we further anticipated that group differences in some abilities, would remain even when controlling for IQ or when excluding children with low IQ or neurosensory disorder. Based on findings from previous longitudinal studies of children with early neurological insults, our second hypothesis was that repeated assessments of cognitive abilities across follow-up would reveal slower rates of development in the children with VLBW than in the controls, leading to increasing or later-emerging sequelae. In view of evidence that environmental factors have strongest effects on children at greatest biologic risk (Landry et al., 1997, 1998), our third hypothesis was that slowed rates of skill acquisition associated with VLBW would be most evident in children from less advantaged environments.
METHODS
Sample Recruitment and Follow-Up
The original sample, which included a regional cohort of children with <750 g birth weight, a 750–1499 g birthweight group, and a group of children born at term with normal birth weight, was initially assessed between November, 1990 and January, 1993. The <750 g group comprised a majority of the survivors (68/73 = 93%) of a cohort of 243 <750 g infants admitted to the three tertiary neonatal intensive care units in Region V of Ohio between July 1, 1982 and December 31, 1986. The five surviving non-participants were similar to the children recruited in birth weight and neonatal medical complications. The 750–1499 g group consisted of the next-born children from the same hospital as the children with <750 g birth weight and matched to these children on race and gender. The term group was formed by selecting children from the same schools as the children with <750 g birth weight, of the same race and gender, and with birth dates within 3 months. Children with congenital malformations unrelated to prematurity were excluded from the VLBW groups, and no term child was reported to have such a condition. Because of recruitment difficulties, the 750–1499 g and term groups comprised slightly fewer children than the <750 g group.
A follow-up phase of the study began a mean of 4.35 years (SD = .72, range = 3.18–8.63) after the initial assessment and involved four additional annual follow-ups. Early in this phase, we were able to enroll one of the surviving <750 g children who did not participate in the initial assessment. We also recruited six term matches for slots that were previously unfilled, and we replaced 9 of the original term children who had dropped out with matched controls who were subsequently followed. The rationale for adding these new participants was to maximize sample size for study of developmental change. We excluded three <750 g children from the original sample who were severely disabled and untestable.
Sample Characteristics and Attrition
Table 1 summarizes demographic and neonatal characteristics for the total sample. The groups were similar in terms of race, sex, age, family composition, and maternal education. Comparisons of the two VLBW groups on measures of neonatal course revealed that the <750 g children had longer hospitalizations and higher rates of septicemia and chronic lung disease than the 750–1499 g group. More of the <750 g children were also small for gestational age. Children with neurosensory deficits included 9 (13%) in the <750 g group (4 with cerebral palsy, 2 with hearing loss, and 3 with severe visual impairment) and 5 (8%) in the 750–1499 g group (3 with cerebral palsy, 2 with hearing loss, and 1 with severe visual impairment) [χ2(1,N = 131) = 0.57, p > .1]. None of the term children had these deficits.
Sample characteristics

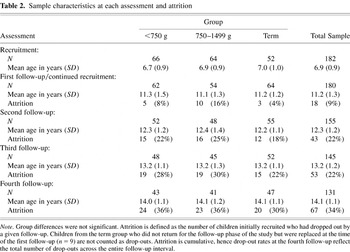
Table 2 presents information on sample composition at each assessment and attrition across follow-up. The groups did not differ significantly in mean age at any of the four follow-ups, or in the total number of assessments. Attrition was defined as the number of children who dropped out prior to each follow-up due to family moves or unwillingness to continue. Although attrition rates were relatively low initially, 67 children (34% of sample) dropped out prior to the final follow-up. Rates of drop out did not differ by group, race, or gender. However, socioeconomic status (SES), as measured by the Four Factor Index of Social Status (Hollingshead, 1975) was lower in the children who dropped out compared to those who remained in follow-up (M at first follow-up of 32.18, SD = 10.77 for the drop-outs, compared to M of 36.86, SD = 13.92 for children who remained in the study (t = 2.38, df = 110.79, p < .05). Although the first estimated IQ obtained by the child, as defined below, was also lower in the children who dropped out, this difference was not significant when SES was taken into account.
Sample characteristics at each assessment and attrition

Procedures and Measures
Although only neuropsychological testing and measures of the family environment are considered in this report, assessments also included tests of academic achievement and parent- and teacher-based ratings of behavior and school performance. The assessments were completed in single half-day sessions after obtaining informed consent. Child tests were given in counterbalanced order across children, and examiners were not informed prior to testing of children's birth weight or group membership.
Table 3 lists neuropsychological outcome measures and the assessments at which they were administered. The recommended tetrad short form of the Kaufman Assessment Battery for Children (K–ABC, Kaufman & Applegate, 1988) was administered to age-eligible children at the time of recruitment and first follow-up. This test provided an initial assessment of global cognitive ability but was subsequently discontinued because of its restricted age range. Subtests of the Wechsler Intelligence Scale for Children–Revised (WISC–III; Wechsler, 1991) were given to evaluate changes in IQ subtests during the follow-up phase. Additional neuropsychological tests were given to assess language skills, perceptual–motor abilities, memory, and attention and executive function. Previous research supports the validity of the test battery in evaluating the sequelae of VLBW and confirms its sensitivity to distinct cognitive functions (Taylor et al., 2000b, 2000d, 2002).
Neuropsychological outcome measures

Information on the family environment was collected from caregivers while the children were being testing. The vast majority of caregivers were custodial mothers or grandmothers (e.g., 95% at first follow-up). Consideration of multiple measures of the family environment was warranted by evidence that child outcomes are associated with multiple risk factors (Bendersky & Lewis, 1994; Bradley et al., 1994; Burchinal et al., 2000; Hauser-Cram et al., 2001; Taylor et al., 1998b). The distal family environment was defined by SES, and the proximal environment by measures of family stressors and resources obtained from the Life Stressors and Social Resources Inventory–Adult Form (LISRES–A; Moos & Moos, 1994). Parent responses to the LISRES–A fall into several domains. The Health scale is a self-rating of health problems and health-related stress, and the Negative and Positive Life Events scales are based on tallies of these events. Scores on other scales are based on ratings of stress and/or support associated with interpersonal relationships. The stressors score was the mean of the T-scores for six stressors scales (Health, Work, Spouse, Extended Family, Friends, and Negative Life Events), with higher scores reflecting more stressful environments. The resources score was the mean of the T-scores for five resources scales (Work, Spouse, Extended Family, Friends, and Positive Life Events), with higher scores representing more supportive environments. Only scales pertinent to the respondent were included in computing these scores. The birthweight groups did not differ on any of the three family measures at any of the assessments. Relationships between these measures at the initial assessment were as follows: SES with stressors [r(178) = −.13, p < .01]; SES with resources [r(178) = .33, p < .01]; stressors with resources [r(178) = −.28, p < .01]. Similar relationships were found at each assessment.
Data Analysis
General linear mixed model analysis, also referred to as hierarchical linear or growth modeling, was employed to examine child outcomes longitudinally (Burchinal et al., 1994; Francis et al., 1991). The mixed model approach has several advantages over more traditional repeated measures analysis of variance or multivariate analysis of variance. This approach incorporates estimates of intraindividual correlations across repeated assessments and is thus a sensitive method for assessing change, as well as group effects. Additional advantages are that assessments do not have to be equally spaced, and that maximum likelihood methods allow incomplete longitudinal data to be considered in estimating model effects. A further virtue of this approach is that predictor factors that change over time can be included as time-varying covariates, allowing assessment of the concurrent influences of these factors on outcomes.
Data from this study were analyzed using SAS Proc Mixed (Singer, 1998). In our primary analyses, age (linear change) and age2 (quadratic change) were modeled as random effects. Age differences in test performance were assessed by including terms for the separate and combined effects of linear and quadratic change. Birthweight group (represented by contrasts of each VLBW group to the term group), race, and sex were categorical predictors. The family factors (SES, stressors, resources) served as time-varying covariates. Group differences in change were tested by including interactions of group with the age factors. Moderating effects of family factors on group differences in change were tested by including triple interactions of group, the age factors, and the family factors. Interactions of Group × Race × Sex were also entered to determine if the latter factors moderated group differences. Gender differences in rates of developmental change prompted us to consider interactions of Sex × Group × Age (Kowaleski-Jones & Duncan, 1999; Roberts et al., 1999). To identify the most parsimonious models, reduce risks of over-fitting, and optimize statistical power, initial models were trimmed by eliminating non-significant interaction terms.
SES was the only family factor considered in the initial models. Following trimming, stressors and interactions of stressors with group and the age factors were added to examine these effects. Models involving stressors were in turn trimmed, and the effects of resources then examined in a similar manner. Main effects for group, race, sex, and SES were included in all models. Main effects for stressors and resources were retained if these factors interacted with group or the age factors, or if they predicted outcomes independently of SES. The purpose of this approach was to identify final models that considered all family factors, while preserving statistical power for tests of effects involving each individual factor.
Because drop-out was related to SES and this factor was taken into account in the analysis, these data are considered ignorable missing (Schafer, 1997). However, following the recommendations of Jaccard and Guilamo-Ramos (2002), we also assessed potential bias by labeling cases as having dropped out of the study by the final follow-up (yes or no). To assess bias, we re-ran the final models with both the main effect of drop-out and interactions of this factor with group, age and age2, and Group × Age × Age2. Absence of bias in our estimates of group differences was supported by the fact that drop-out rates were similar across groups and by lack of evidence for either main effects of drop-out or effects of this variable on age-related change.
Because of our interest in modeling developmental change, analyses were conducted on raw scores rather than on age-standardized scores. Analysis of raw scores is more sensitive to individual differences in change, as heterogeneity in change is obscured by norm-based transformations. To evaluate statistical significance, child outcomes were grouped by the domains listed in Table 3 and Bonferroni adjustments were made using a domain-wise alpha level of p < .05. To determine the source of interactions involving any of the three environmental factors, low and high levels for each factor were defined in terms of values that fell, respectively, 1 standard deviation below and above the sample mean. Alpha for examining simple effects was set at p < .05.
To identify neuropsychological sequelae of VLBW that were not related to generalized intellectual impairment, we added estimated IQ to the final models as a time-varying covariate. For the initial assessment, estimated IQ was based on the K-ABC Mental Processing Composite, or on WISC–III prorated IQ for children recruited during the follow-up phase who exceeded the age range for the K-ABC. Estimated IQ for 1 child with severe visual problems was based on Wechsler Verbal IQ. Children who were untestable on the K-ABC were assigned a standard score of 55 (4 cases). For the remaining assessments, the estimate was defined by prorated WISC–III IQ, based on all subtests administered at a given follow-up. IQ subtests were not considered as dependent variables in these analyses. Estimated IQ × Age factor interactions were included in the models to allow for the possibility that the effects of cognitive ability would vary across age. Estimated IQ × Group interactions were also examined, and these effects included where significant. As a further means for examining the specificity of sequelae, we repeated the primary analysis after excluding the 26 children with an initial estimated IQ <70 or neurosensory disorder.
RESULTS
Total Sample
Group differences that were not moderated by other model variables
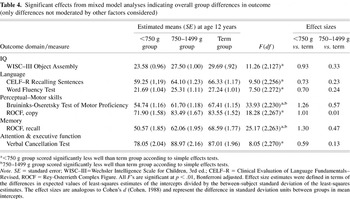
Table 4 summarizes results from the final models that revealed group main effects, but not interactions of group with other factors. Detailed results from the final models are available from the first author. Estimated means and standard errors are given at age 12 years to illustrate outcomes in the middle stage of follow-up. Simple effects tests revealed that the <750 g group had poorer outcomes than term controls on all measures listed in Table 4, and that the 750–1499 g group had poorer outcomes than controls on the Bruininks-Oseretsky Test of Motor Proficiency and Rey-Osterrieth Complex Figure (ROCF) recall. As shown in Table 4, effect sizes for the differences between the <750 g group and controls were large for all measures listed, but much smaller for 750–1499 g group versus control comparisons.
Significant effects from mixed model analyses indicating overall group differences in outcome (only differences not moderated by other factors considered)

Group differences in developmental change
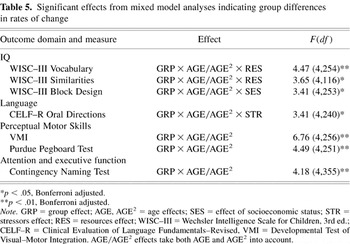
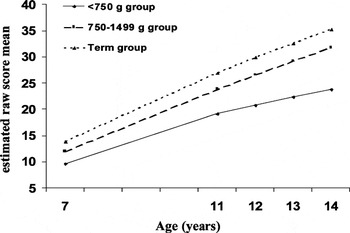
Table 5 lists effects from the final models that documented group differences in change. The two-way interactions of Group × Age or Age2 were consistent with hypothesized group differences in change. Specifically, the <750 g group made slower gains than the term group on the Developmental Test of Visual Motor Integration (VMI), Purdue Pegboard Test, and Contingency Naming Test. This pattern of findings is illustrated in Figure 1, which shows group differences in developmental change on the VMI. Similar group differences in change were found for the other two measures. Simple effects tests for group differences at each age (7–14 years) revealed significantly lower scores for the <750 g group than for controls at each age for all three measures.
Significant effects from mixed model analyses indicating group differences in rates of change


Model estimates of group means in raw scores across age for the Developmental Test of Visual–Motor Integration (VMI). Follow-up of a significant Age Factor × Group contrast effect (see Table 5) revealed less rapid age-related gains in the <750 g group than in the term-born group [F(2,256) = 11.93, p < .01].
Moderating effects of environmental factors on group differences
Group differences in other outcomes were moderated by environmental factors. These moderating effects indicated that group differences for children from more advantaged environments were not the same as the group differences for children from less advantaged circumstances. A Group × Stressors interaction was found for the CVLT–C [F(2,263) = 4.92, p < .05]. Follow-up of this interaction indicated that the <750 g group obtained lower scores than the term group at both high and low levels of stressors, but these differences were greater at a low level of stressors.
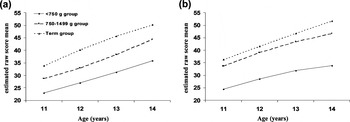
As shown in Table 5, environmental factors also moderated group differences in growth rates for several of the outcome measures. Inspection of the latter three-way interactions revealed two patterns of group difference in change, each of which was evident under specific environmental conditions. The first pattern entailed slower increases in three test scores for children with VLBW than for term controls, but only under conditions of environmental advantage. Specifically, at a high level of SES, the <750 g group progressed more slowly than controls on Block Design; at a low level of stressors, the <750 g group progressed more slowly than controls on Oral Directions; and at a high level of resources, the 750–1499 g group made slower gains than controls on Vocabulary. To illustrate this pattern, Figures 2a and 2b plot group differences in change on Block Design at low and high levels of SES, respectively.

Model estimates of group means in raw scores across age for the Block Design subtest of the Wechsler Intelligence Scale for Children, 3rd Edition (WISC–III). The means graphed in 2a and 2b represent performance at a low and high level of socioeconomic status (SES), as defined by values 1 SD below and above the sample mean, respectively. The age Factor × Group interaction graphed in 2a (low level of SES) was not significant. Follow-up of the interaction shown in 2b (high level of SES) indicated that the <750 g group made slower age-related gains than the term-born group [F(2,262) = 3.64, p < .05]. Analysis of these interactions was justified by a significant age Factor × Group × SES interaction (see Table 5).
Under above-noted conditions of environmental advantage, differences between the <750 g and term groups in Block Design and Oral Directions were significant across follow-up, whereas differences between the 750–1499 g and term groups in Vocabulary were significant only at age 14 years. The <750 g group also scored significantly less well than controls on Block Design at a low level of SES, and on Oral Directions at a high level of stressors. The latter differences, however, did not vary with age.
The second pattern involved faster increases in four test scores for the 750–1499 g group than for controls, but only under conditions of relative environmental disadvantage. This pattern, which suggests partial “catch-up” with age in the 750–1499 g group, was evident on Block Design at a low level of SES, Vocabulary and Similarities at a low level of resources, and Oral Directions at a high level of stressors. Figure 3a shows this group's catch-up growth in Vocabulary at a low level of resources. As illustrated in Figure 3b, catch-up growth was not observed at a high level of resources. In fact, as mentioned above, the 750–1499 g group made slower progress in Vocabulary than controls in this condition.

Model estimates of group means in raw scores across age for the Vocabulary subtest of the Wechsler Intelligence Scale for Children, 3rd Edition (WISC–III). The means shown represent performance at low and high levels of family resources, as defined by values 1 SD below and above the sample mean, respectively. Follow-up of the interaction shown in 3a (low level of resources) indicated that the 750–1499 g group made more rapid age-related gains than the term-born group [F(2,254) = 3.99, p < .05]. Follow-up of the interaction shown in 3b (high level of resources) indicated that the 750–1499 g group made slower age-related gains than the term controls [F(2,254) = 3.40, p < .05]. Analysis of these interactions was justified by a significant Age Factor × Group × SES interaction (see Table 5).
Under the above-noted conditions of environmental disadvantage, differences between the 750–1499 g group and controls, all favoring the controls, were significant only prior to age 14 years (Block Design at ages 12 and 13, Vocabulary at age 11, Similarities at age 12, Oral Directions at age 7). Under conditions of environmental advantage, differences between the 750–1499 g and control groups in Block Design and Oral Directions were not significant at any age, and differences between these groups in Similarities were significant only at age 14 years.
Additional predictors of outcome
Main effects other than group included age or age2, sex, race, and the three family factors. Advancing age was associated with better scores on all tests. Consistent with previous findings indicating better performances of girls than boys on tests of verbal list learning and psychomotor efficiency (Donders & Hoffman, 2002; Halpern, 1997), girls obtained higher scores than boys on the CVLT–C and Verbal Cancellation Test. Gender was additionally related to rates of change in scores on the Bruininks-Oseretsky and Purdue Pegboard. In accord with research on sex differences in development of motor skills (Denckla, 1974), the initial superiority of girls on these measures dissipated with age. Also in keeping with past findings (McDermott, 1995; Pungello et al., 1996), lower scores on several measures were associated with lower SES or resources, higher stressors, or minority status. Finally, as demonstrated by previous research (Breslau et al., 2001; Burchinal et al., 2000; Carta et al., 2001; Espy et al., 2001; Ment et al., 2003), environmental advantages predicted more rapid gains on some tests. In this study, higher SES and lower stressors were associated with more rapid gains in Vocabulary and Block Design, respectively.
Group differences remaining when controlling for estimated IQ
Even when controlling for the effects of estimated IQ, the <750 g group performed less well than controls on the CELF–R Oral Directions and Recalling Sentences subtests, Bruininks-Oseretsky, Purdue Pegboard, CVLT–C, and ROCF copy and recall. These analyses also continued to reveal catch-up growth on Oral Directions in the 750–1499 g group relative to controls at a high level of stressors. However, other group differences in change were no longer significant.
Subsample of Children Without Neurosensory Disorder or Global Cognitive Impairment
As further evidence for the selective effects of VLBW, findings from the final models were similar when children with a low initial estimated IQ or neurosensory disorder were excluded from analysis. All group main effects listed in Table 4 remained significant. Several of the interactions reported in Table 5 were no longer significant, but patterns of group differences were similar and in many cases marginally significant. The interactions reported in Table 5 that remained significant included those for WISC–III Similarities, CELF–R Oral Directions, and VMI. Patterns of group differences and age-related changes on these measures were the same as those found in the primary analyses.
Age-Standardized Scores
For descriptive purposes, age-standardized means and standard deviations were computed at each assessment for measures with published norms, including prorated WISC–III subtests and prorated WISC–III IQ, the CELF–R subtests, VMI, Bruininks-Oseretsky, and CVLT–C (table available from first author). For the <750 g group, most of these means ranged from borderline deficient (scores 70–79) to low average (scores 80–89). Although the 750–1499 g group scored consistently less well than the term group on these tests, both groups scored within 1 standard deviation of the normative means.
DISCUSSION
Support for Hypotheses
In support of the hypothesized persistence of VLBW sequelae, the <750 g group scored less well than term-born controls on every test and across all follow-ups. These findings, along with those of other recent studies (Botting et al., 1998; Breslau et al., 2001; Rickards et al., 2001; Saigal et al., 2000), suggest that sparing of function does not occur for many children with VLBW, at least in terms of attainment of normative levels of ability. Neural reorganization takes place after early brain insults and permits a limited form of plasticity in cases of localized lesions (Bates & Roe, 2001; Carlsson & Hugdahl, 2000; Kolb & Gibb, 2001; Stiles, 2000). Unfortunately, the brain insults sustained by children with VLBW are either too diffuse or too disruptive to neurogenesis to permit fully normal development.
As anticipated based on a gradient of VLBW effects (Breslau et al., 1996; Klebanov et al., 1994), deficits relative to term-born children were less pronounced for the 750–1499 g group than for the <750 g group. Whereas the 750–1499 g group did not differ from term controls on most outcome measures, this group had overall weaknesses on tests of motor and spatial–constructional skills. A few other weaknesses were also found, but were evident only at younger ages for children from disadvantaged environments, and at later ages for those from advantaged environments.
Most of the differences between the <750 g group and the controls remained significant in analyses that excluded children with low estimated IQ or neurosensory disorders. Even when estimated IQ was included as a covariate, the <750 g group scored less well than controls on tests of language processing and verbal working memory skills, verbal list learning, and perceptual–motor and spatial–organizational abilities. These results confirm previous evidence of selective cognitive sequelae and suggest that children in the <750 g group sustained greater damage to some brain regions than others (Frisk & Whyte, 1994; Luciana et al., 1999; Taylor et al., 2000b, 2000c, 2002; Waber & McCormick, 1995). Given the predilection of children with VLBW to insults in the periventricular region (Volpe, 1998), including the basal ganglia, hippocampus, and frontal–striatal circuits, one would expect the above-noted skills to be especially liable to impairment (Salmon et al., 2001).
Consistent with hypothesized effects of VLBW on rates of skill acquisition, the <750 g group made slower age-related gains on tests requiring perceptual-motor planning, attention shifting, and speed of processing (see Figure 1). These findings stand in contrast to the failure of several previous studies to find differences between VLBW groups and term-born controls in age-related changes in IQ scores (Botting et al., 1998; Breslau et al., 2001; Saigal et al., 2000) and to a recent report of positive gains in receptive vocabulary and IQ over time in a cohort of children with 600–1200 g birth weight (Ment et al., 2003). The discrepancy may be accounted for by the fact that we assessed a range of cognitive skills as opposed to a composite IQ measure, the large number of children with extremely low birth weight in our cohort, or our analytic approach.
The findings of this study failed to support the hypothesis that group differences in growth rates would be more pronounced in children from less advantaged family environments. Environmental factors moderated group differences in growth rates, but in ways that were unanticipated. One pattern of environmental moderation consisted of slower progress in the VLBW groups relative to controls on some tests, but only under favorable environmental conditions (Figure 2). These results indicate that some children with <750 g birth weight developed more slowly than controls across a broad range of tests, and that some children with 750–1499 g birth weight were also vulnerable to slowed rates of development. A second pattern of environmental moderation entailed catch-up growth in the 750–1499 g group, but only under less favorable conditions (Figures 3a and 3b). The implication of this pattern is that catch-up growth can occur (Ment et al., 2003), but that it is not ubiquitous and is most likely to be observed in children with less extreme degrees of VLBW.
Explanations for Group Differences in Rates of Skill Acquisition
Because the raw scores used in analysis were not equal-interval measures, group differences in change on the VMI, Purdue Pegboard, and Contingency Naming Test may merely reflect the poorer overall performance of the <750 g group. These differences would be expected if a raw score gain of one unit lower on the performance scale indicated a greater change in ability than a similar gain higher on the scale. Evidence for differential growth would also be artifactual if performance increases at the lower and higher ends of a scale were driven by different cognitive operations (e.g., increased graphomotor precision for gains at the lower end of the VMI scale, and improved planning and organization for gains at the upper end of the scale). If this were the case, the slower progress of the <750 g group could have been due to a larger group difference in the latter skill, rather than a group difference in acquisition rate.
However, scaling artifacts seem an unlikely explanation for all of the group differences in growth rates. Higher levels of performance on the Purdue Pegboard and Contingency Naming Test stem from greater efficiency rather than from increasing task demands. A more feasible interpretation of the group differences in these tests is that the children with <750 g birth weight, like others with neurological disorders early in life, have brain-based deficiencies in processes underlying skill acquisition (Carr, 1992; Dennis et al., 1991; Hodapp et al., 1990; Rourke, 1988; Taylor et al., 2000d). These children either acquire skills more slowly throughout childhood or have later-emerging deficits. Factors potentially associated with the presence of a developmental disability, including the cumulative effects of poor motivation and lack of educational support, also may contribute to group differences in growth rates (Zelkowitz et al., 1995).
Given that early brain insults were sufficient to slow the <750 g group's development on some tests, the lack of similar group differences across a wider array of tests is puzzling. Longitudinal studies of children with other early-onset neurological disorders have also failed to document pervasive effects of these conditions on skill acquisition (Cutting et al., 2002; Klapper & Birch, 1967; Taylor et al., 2000d). Nevertheless, a more general retardation in growth rates would be predicted based on the <750 g group's weaknesses on the ROCF, VMI, and Contingency Naming Test. To the extent that these tests tap executive functions (P. Anderson et al., 2000; Taylor et al., 1996), one would expect adverse effects on global cognitive development (Schatz et al., 2000). The lower initial cognitive functioning of the <750 g group (Taylor et al., 2000b) provides a further basis for anticipating a pervasive developmental slowing (Burchinal et al., 1994; Hatton et al., 1997; Keogh et al., 1997).
The neuropathology associated with VLBW may help account for the relatively limited effects of <750 g birth weight on cognitive growth. Brain insults localized to the basal ganglia and cortical–striatal circuits, for example, may affect the development of skills subserved by these regions more so than skills subserved by other neural areas. Noting relatively isolated deficits in motor and executive functions in children with subcortical insults, Denckla and Reiss (1997) proposed that intellectual development need not be adversely affected so long as the prefrontal cortex is intact. An alternative explanation is that damage to white matter tracts compromised the development of perceptual–motor and executive functions more so than other cognitive abilities (Booth et al., 2001; Rourke, 1988; Schatz et al., 2000). A third interpretation is that the <750 g children compensated for weaknesses in acquisition processes by developing alternative learning strategies or by receiving extra assistance or stimulation; and these compensatory processes were more effective in mediating development in some skill areas than in others. We know too little about the brain status, learning styles, and experiential backgrounds of the children to distinguish among these interpretations. An additional possibility is that a more pervasive slowing of development was present but was too subtle to be detected or obscured by repeated exposure to the test battery.
The absence of pervasive differences in growth rates between the <750 g and control groups is especially notable given the sizeable group differences in performance levels between the <750 g and term-born groups. The greater effects of <750 g birth weight on level of performance than on change in performance over time suggests that the mechanisms underlying interindividual differences in cognitive abilities are distinct from those influencing intraindividual development (Hauser-Cram et al., 2001). This dissociation also confirms a limited form of sparing in the <750 g group and is consistent with evidence that children with early brain lesions make considerable age-related gains in cognitive ability (Bates & Roe, 2001; Eslinger & Biddle, 2000; Stiles, 2000). M. Anderson's (1998) theory of the minimal cognitive architecture provides a theoretical account for this dissociation. According to Anderson, central processing capacities and speed are responsible for between-child variations in intelligence, whereas maturation of information processing modules underlie developmental change in mental ability. Because the two routes of knowledge acquisition are independent and subserved by different brain systems, certain types of brain insults (i.e., those that leave modules intact) may impair the level of cognitive ability without affecting rates of skill acquisition. Although Anderson does not specify the neural or neuropsychological referents for his constructs, his theory demonstrates how individual difference and developmental perspectives might be integrated to account for the longitudinal consequences of VLBW.
Explanations for Moderating Effects of the Family Environment
So far as we are aware, the two patterns of environmental moderation on growth rates observed in this study have not been reported previously. For this reason, replication is needed and only post-hoc explanations can be offered. A tentative interpretation of slowed acquisition rates in children with VLBW from more advantaged environments (Figure 2) is that children with early brain insults are constrained in their maximum capacity to benefit from environmental stimulation (Wolke & Meyer, 1999). This interpretation is consistent with the above-mentioned possibility of latent deficits, which would be most prominent among children at highest biological risk whose development was not otherwise constrained. In support of this explanation, slower rates of skill acquisition under conditions of environmental advantage were found primarily in the <750 g group. The finding that differences between the <750 g group and controls on the CVLT–C were greater at higher levels of environmental advantage can also be explained in terms of a lesser capacity of the former group to benefit from environmental enrichment.
To explain the catch-up growth of the 750–1499 g group on some tests under conditions of environmental disadvantage (Figure 3), we speculate that this group may have overcome or “escaped” the influences of family adversity. One potential reason for this group's escape from early environmental risk is an age-related increase in the exposure of children with VLBW to other more positive social influences, such as supportive peer interactions or participation in school and community activities (Rutter, 2000). Another reason is the later development of self-regulatory abilities in children with less extreme VLBW that offset their susceptibility to adverse home environments. The lack of catch-up growth in the children with <750 g birth weight could then be explained by a lesser ability of children at higher biological risk to participate in or profit from social experiences outside the home, or their more limited self-regulatory abilities. A further possibility is that the children with 750–1499 g birth weight were capable of catch-up growth regardless of environmental conditions, but that catch-up in children from more advantaged circumstances occurred prior to the follow-up period. According to this interpretation, catch-up growth in disadvantaged children with 750–1499 g birth weight would not be due to escape from risk, but to a prolongation of the period of catch-up due to environmental adversity. Because our follow-up did not begin until school age, we are unable to examine this possibility.
Limitations
One of the primary limitations of this study was an attrition rate of approximately 30% by the end of follow-up, with proportionally greater drop out of children with lower SES. Disproportionate drop out of children with lower IQ, some of whom were not capable of testing, is of additional concern and raises doubts as to the representativeness of growth estimates for children with more extreme cognitive deficiencies. Although SES was taken into account in the analysis, yielding unbiased estimates of model parameters, caution is advised in generalizing results to the broader VLBW population.
Other limitations relate to our measurement methods. Equal-interval test scales would have permitted stronger conclusions regarding group differences in age-related change; and modeling of changes in cognitive constructs, rather than in performance on individual tests, would have clarified the nature of skill development. Assessment of environmental influences was likewise limited. We assume that the influence of our three environmental measures on cognitive development was due to their associations with parent–child interactions, the degree of support or opportunity to learn, and the availability of cognitive stimulation (Campbell et al., 2001). However, different environmental characteristics may moderate growth in distinct ways, and patterns of moderation may vary with the age range across which children are followed. In contrast to our results, Landry et al. (1997, 1998) found that advantaged environments, not disadvantaged ones, were associated with more rapid development in children with VLBW compared with controls, or in high- compared with low-risk VLBW subgroups. The fact that these investigators defined the environment in terms of parent-child interactions and examined growth during the preschool years may help account for the different pattern of moderation observed in their study. Additional complexities not addressed in the present study include possible genetic mediation of environmental influences on growth rates and likelihood of bidirectional relationships between children's cognitive outcomes and the family environment (Rutter, 2000; Rutter et al., 2001).
Implications and Future Directions
We nevertheless conclude from these findings that most VLBW-related cognitive weaknesses persist throughout the school-age years, and that risks for these outcomes will be greatest in the children with more extreme degrees of VLBW. Some weaknesses may even become more pronounced with age, justifying continued surveillance of outcomes into adolescence and long-term planning for special education needs. In view of relatively greater effects on perceptual–motor, memory, and executive functions, these skills deserve special emphasis in assessing children and designing interventions.
The findings also underscore the importance of taking children's environments into account in assessing risks for adverse outcomes of VLBW or other conditions associated with early brain insults (Eslinger et al., 1997). Had we failed to include family factors in our prediction models, we would have found fewer group differences in acquisition rates. Likewise, the role of the environment would have been obscured, as the moderating influence of family factors was primarily on age-related change. The particular ways in which group differences in development were moderated by the environment have additional implications. The slowed acquisition of some skills in children with VLBW from more advantaged environments raises the possibility that these children may become less responsive to environmental enrichment with age. Data indicating catch-up in the 750–1499 g group under conditions of environmental disadvantage indicate that later recovery may be attainable for some children, perhaps as a result of changes with age in extra-familial influences or children's increasing capacity to self-regulate their learning over time.
Further research is needed to improve measurement of cognitive outcomes of VLBW and examine associated learning and behavior problems. Additional research is also required to enhance prediction of individual differences, identify the neuropathological basis of differential growth rates, and explore environmental mechanisms underlying the effects observed in this study (Taylor et al., 2000c, 2002). Follow-up of the sample is ongoing and should provide useful information on later outcomes and brain–behavior relationships. Longitudinal studies of other VLBW samples are needed to determine the replicability of these findings. Similar investigations of children with other neurological disorders will help expand our understanding of the neurocognitive basis of development and the ways in which the consequences of brain insults are modified by experience (Hauser-Cram et al., 2001).
ACKNOWLEDGMENTS
This work was supported by Grant HD26554 from the National Institute of Child Health and Human Development, H.G. Taylor, principal investigator. The authors acknowledge the contributions of Anne Birnbaum, Kathy Winter, Diane Pacella, Jennifer Angelopoulos, Elizabeth Kennedy-Hart, Sharon Cohen, and Mary Ann Ricci in data collection and coding. Appreciation is also extended to Anne Birnbaum and Drs. Penny Holding and Elizabeth Roth for help with the manuscript, to Dr. Mark Schluchter for consultation on the analytic methods and to Drs. John Moore (MetroHealth Medical Center) and Lawrence Lilien (Fairview General Hospital) for assistance in sample access.
References
REFERENCES
Anderson, M.
(1998).
Mental retardation general intelligence and modularity.
Learning and Individual Differences,
10,
159–178.CrossRefGoogle Scholar
Anderson, P.,
Anderson, V.,
Northam, E., &
Taylor, H.G.
(2000).
Standardization of the Contingency Naming Test (CNT) for
school-aged children: A measure of reactive flexibility.
Clinical Neuropsychological Assessment,
1,
247–273.Google Scholar
Anderson, V.,
Catroppa, C.,
Morse, S.,
Haritou, F., &
Rosenfeld, M.
(2000).
Recovery of intellectual ability following traumatic brain injury
in childhood: Impact of injury severity and age at injury.
Pediatric Neurosurgery,
32,
282–290.CrossRefGoogle Scholar
Bates, E. &
Roe, K.
(2001).
Language development in children with unilateral brain injury. In
C.A. Nelson &
M. Luciana (Eds.),
Handbook of developmental cognitive neuroscience (pp.
281–308).
Cambridge, MA:
The MIT Press.
Beery, K.E.
(1989).
Revised administration, scoring, and teaching manual for the
Developmental Test of Visual–Motor Integration.
Cleveland, OH:
Modern Curriculum Press.
Bendersky, M. &
Lewis, M.
(1994).
Environmental risk, biological risk, and developmental outcome.
Developmental Psychology,
30,
484–494.Google Scholar
Bernstein, J.H. &
Waber, D.P.
(1996).
Developmental scoring system for the Rey-Osterrieth Complex Figure:
Professional manual.
Odessa, FL:
Psychological Assessment Resources.
Booth, J.R.,
Burman, D.D.,
Van Santen, F.W.,
Harasaki, Y.,
Gitelman, D.R.,
Parrish, T.B., &
Mesulam, M.M.
(2001).
The development of specialized brain systems in reading and
oral-language.
Child Neuropsychology,
7,
119–141.Google Scholar
Botting, N.,
Powls, A.,
Cooke, R.W.I., &
Marlow, N.
(1998).
Cognitive and educational outcome of very low birth weight children
in early adolescence.
Developmental Medicine and Child Neurology,
40,
652–660.Google Scholar
Bradley, R.H.,
Whiteside, L.,
Mundfrom, D.J.,
Casey, P.H.,
Kelleher, K.J., &
Pope, S.K.
(1994).
Early indications of resilience and their relation to experiences
in the home environments of low birthweight, premature children living
in poverty.
Child Development,
65,
346–360.Google Scholar
Breslau, N.,
Chilcoat, H.,
Del Dotto, J.E.,
Andreski, P., &
Brown, G.G.
(1996).
Low birth weight and neurocognitive status at six years of age.
Biological Psychiatry,
40,
389–387.Google Scholar
Breslau, N.,
Chilcoat, H.D.,
Susser, E.S.,
Matte, T.,
Liang, K., &
Peterson, E.L.
(2001).
Stability and change in children's intelligence quotient
scores: A comparison of two socioeconomically disparate
communities.
American Journal of Epidemiology,
154,
711–717.Google Scholar
Bruininks, R.H.
(1978).
Bruininks-Oseretsky Test of Motor Proficiency: Examiner's
manual.
Circle Pines, MN:
American Guidance Service.
Burchinal, M.R.,
Bailey, D.B., Jr., &
Snyder, P.
(1994).
Using growth curve analysis to evaluate child changes in
longitudinal investigations.
Journal of Early Intervention,
18,
403–423.CrossRefGoogle Scholar
Burchinal, M.R.,
Roberts, J.E.,
Hooper, S., &
Zeisel, S.A.
(2000).
Cumulative risk and early cognitive development: A comparison of
statistical risk models.
Developmental Psychology,
36,
793–807.CrossRefGoogle Scholar
Campbell, F.A.,
Pungello, E.P.
Miller-Johnson, S.,
Burchinal, M., &
Ramey, C.T.
(2001).
The development of cognitive and academic abilities: Growth
curves from an early childhood educational experiment.
Developmental Psychology,
37,
231–242.Google Scholar
Carlsson, G. &
Hugdahl, K.
(2000).
Cerebral reorganization in children with congenital hemiplegia:
Evidence from the dichotic listening test. In
H.S. Levin &
J. Grafman (Eds.),
Cerebral reorganization of function after brain damage (pp.
232–246).
New York:
Oxford University Press.
Carr, J.
(1992).
Longitudinal research in Down syndrome.
International Review of Research in Mental Retardation,
18,
197–223.CrossRefGoogle Scholar
Carran, D.,
Scott, K.,
Shaw, K., &
Beydoun, S.
(1989).
The relative risk of educational handicaps in two birth cohorts of
normal and low birthweight disadvantaged children.
Topics Early Childhood Special Education,
9,
14–31.Google Scholar
Carta, J.J.,
Atwater, J.B.,
Greenwood, C.R.,
McConnell, S.R.,
McEvoy, M.A., &
Williams, R.
(2001).
Effects of cumulative prenatal substance exposure and environmental
risks on children's developmental trajectories.
Journal of Clinical Child Psychology,
30,
327–337.Google Scholar
Cohen, S.E.,
Beckwith, L.,
Parmelee, A.H.,
Sigman, M.,
Asarnow, R., &
Espinosa, M.P.
(1996).
Prediction of low and normal school achievement in early
adolescents born preterm.
Journal of Early Adolescence,
16,
46–70.Google Scholar
Cutting, L.E.,
Huang, G.,
Zeger, S.,
Koth, C.W.,
Thompson, R.E., &
Denckla, M.B.
(2002).
Growth curve analyses of neuropsychological profiles in children
with neurofibromatosis Type I: Specific cognitive tests remain
“spared” and “impaired” over time.
Journal of the International Neuropsychological Society,
8,
838–846.Google Scholar
Delis, D.,
Kramer, J.,
Kaplan, E., &
Ober, B.
(1994).
The California Verbal Learning Test–Children's Version.
San Antonio, TX:
The Psychological Corporation.
Denckla, M.G.
(1974).
Development of motor co-ordination in normal children.
Developmental Medicine and Child Neurology,
16,
729–741.Google Scholar
Denckla, M.B. &
Reiss, A.L.
(1997).
Prefrontal–subcortical circuits in developmental disorders.
In
N.A. Krasnegor,
G.R. Lyon, &
P.S. Goldman-Rakic (Eds.),
Development of the prefrontal cortex: Evolution, neurobiology, and
behavior (pp.
283–293).
Baltimore:
Paul H. Brookes.
Dennis, M.,
Spiegler, B.J.,
Hoffman, H.J.,
Hendrick, E.B.,
Humphreys, R.P., &
Becker, L.E.
(1991).
Brain tumors in children and adolescents: I. Effects on working,
associative, and serial-order memory of IQ, age at tumor onset and age
of tumor.
Neuropsychologia,
29,
813–827.Google Scholar
Donders, J. &
Hoffman, N.M.
(2002).
Gender differences in learning and memory after pediatric traumatic
brain injury.
Neuropsychology,
16,
491–499.CrossRefGoogle Scholar
Eslinger, P.J. &
Biddle, K.R.
(2000).
Adolescent neuropsychological development after early right
prefrontal cortex damage.
Developmental Neuropsychology,
18,
297–329.Google Scholar
Eslinger, P.J.,
Biddle, K.R., &
Grattan, L.M.
(1997).
Cognitive and social development in children with prefrontal
cortex lesions. In
N.A. Krasnegor,
G.R. Lyon, &
P.S. Goldman-Rakic (Eds.),
Development of the prefrontal cortex: Evolution, neurobiology, and
behavior (pp.
295–334).
Baltimore:
Paul H. Brookes.
Espy, K.A.,
Molfese, V.J., &
DiLalla, L.F.
(2001).
Effects of environmental measures on intelligence in young
children: Growth curve modeling of longitudinal data.
Merrill-Palmer Quarterly,
47,
42–73.Google Scholar
Francis, D.J.,
Fletcher, J.M.,
Stuebing, K.K.,
Davidson, K.C., &
Thompson, N.R.
(1991).
Analysis of change: Modeling individual growth.
Journal of Consulting and Clinical Psychology,
59,
27–37.Google Scholar
Frisk, V. &
Whyte, H.
(1994).
The long-term consequences of periventricular brain damage on
language and verbal memory.
Developmental Neuropsychology,
10,
313–333.Google Scholar
Gardner, R.
(1979).
The objective diagnosis of minimal brain dysfunction.
Cresshill, NJ:
Creative Therapies.
Goyen, T.,
Lui, K., &
Woods, R.
(1998).
Visual–motor, visual–perceptual, and fine motor
outcomes in very-low-birthweight children at 5 years.
Developmental Medicine and Child Neurology,
40,
76–81.Google Scholar
Hack, M.,
Breslau, N.,
Aram, D.,
Weissman, B.,
Klein, N., &
Borawski-Clark, E.
(1992).
The effect of very low birthweight and social risk on
neurocognitive abilities at school age.
Journal of Developmental and Behavioral Pediatrics,
13,
412–420.Google Scholar
Hack, M. &
Fanaroff, A.A.
(1999).
Outcomes of children of extremely low birthweight and gestational
age in the 1990s.
Early Human Development,
53,
193–218.CrossRefGoogle Scholar
Hack, M.,
Friedman, H., &
Fanaroff, A.A.
(1996a).
Outcomes of extremely low birth weight infants.
Pediatrics,
98,
931–937.Google Scholar
Hack, M.,
Klein, N., &
Taylor, H.G.
(1996b).
School-age outcomes of children of extremely low birthweight and
gestational age.
Seminars in Neonatology,
1,
227–288.Google Scholar
Hack, M.,
Weismann, B.,
Breslau, N.,
Klein, N.,
Borawski-Clark, E., &
Fanaroff, A.
(1993).
Health status of VLBW children during their first 8 years.
Journal of Developmental and Behavioral Pediatrics.Google Scholar
Halpern, D.F.
(1997).
Sex differences in intelligence: Implications for education.
American Psychologist,
52,
1091–1102.CrossRefGoogle Scholar
Hatton, D.D.,
Bailey, D.B., Jr.,
Burchinal, M.R., &
Ferrell, K.A.
(1997).
Development growth curves of preschool children with vision
impairments.
Child Development,
68,
788–806.Google Scholar
Hauser-Cram, P.,
Warfield, M.E.,
Shonkoff, J.P., &
Krauss, M.W.
(2001).
Children with disabilities: A longitudinal study of child development
and parent well-being.
Monographs of the Society for Research in Child Development,
66 (3, Serial No. 266).Google Scholar
Hodapp, R.M.,
Dykens, E.M.,
Hagerman, R.J.,
Schreiner, R.,
Lachiewicz, A.M., &
Leckman, J.F.
(1990).
Developmental implications of changing trajectories of IQ in males
with Fragile X Syndrome.
Journal of the American Academy of Child and Adolescent Psychiatry,
29,
214–219.CrossRefGoogle Scholar
Hollingshead, A.
(1975).
Four Factor Index of Social Status.
New Haven, CT:
Yale University Department of Sociology.
Huttenlocher, P.R. &
Dabholkar, A.S.
(1997).
Regional differences in synaptogenesis in human cerebral cortex.
Journal of Comparative Neurology,
387,
167–178.Google Scholar
Jaccard, J. &
Guilamo-Ramos, V.
(2002).
Analysis of variance frameworks in clinical child and adolescent
psychology: Advanced issues and recommendations.
Journal of Clinical Child Psychology,
31,
278–294.CrossRefGoogle Scholar
Kaufman, A. &
Applegate, B.
(1988).
Short forms of K-ABC Mental Processing and Achievement Scales at
age 4 to 12-1/2 years for clinical and screening purposes.
Journal of Clinical Child Psychology,
17,
359–369.Google Scholar
Keogh, B.K.,
Bernheimer, L.P., &
Guthrie, D.
(1997).
Stability and change over time in cognitive level of children with
delays.
American Journal of Mental Retardation,
101,
365–373.Google Scholar
Klapper, Z.S. &
Birch, H.G.
(1967).
A fourteen-year follow-up study of cerebral palsy: Intellectual
change and stability.
American Journal of Orthopsychiatry,
3,
540–547.Google Scholar
Klebanov, P.K.,
Brooks-Gunn, J., &
McCormick, M.C.
(1994).
School achievement and failure in very low birthweight children.
Developmental and Behavioral Pediatrics,
15,
248–256.Google Scholar
Klein, N.,
Hack, M., &
Breslau, N.
(1989).
Children who were very low birthweight: Developmental and academic
achievement at nine years of age.
Developmental and Behavioral Pediatrics,
10,
32–37.Google Scholar
Kolb, B. &
Gibb, R.
(2001).
Early brain injury, Plasticity, and behavior. In
C.A. Nelson &
M. Luciana (Eds.),
Handbook of developmental cognitive neuroscience (pp.
175–190).
Cambridge, MA:
The MIT Press.
Kowaleski-Jones, L. &
Duncan, G.J.
(1999).
The structure of achievement and behavior across middle childhood.
Child Development,
70,
930–943.CrossRefGoogle Scholar
Landry, S.H.,
Smith, K.E.,
Miller-Loncar, C.L., &
Swank, P.R.
(1997).
Predicting cognitive-language and social growth curves from early
maternal behaviors in children at varying degrees of biological
risk.
Developmental Psychology,
33,
1040–1053.Google Scholar
Landry, S.H.,
Smith, K.E.,
Miller-Loncar, C.L., &
Swank, P.R.
(1998).
The relation of change in maternal interactive styles to the
developing social competence of full-tern and preterm children.
Child Development,
69,
105–123.Google Scholar
Levin, H.S.,
Song, J.,
Chapman, S.B., &
Harward, H.
(2000).
Neuroplasticity following traumatic diffuse versus focal brain
injury in children: Studies of verbal fluency. In
H.S. Levin &
J. Grafman (Eds.),
Cerebral reorganization of function after brain damage (pp.
218–231).
New York:
Oxford University Press.
Lorenz, J.M.,
Wooliever, D.E.,
Jetton, J.R., &
Paneth, N.
(1998).
A quantitative review of mortality and developmental disability in
extremely premature newborns.
Archives of Pediatrics and Adolescent Medicine,
152,
425–435.Google Scholar
Luciana, M.,
Lindeke, L.,
Georgieff, M.,
Mills, M., &
Nelson, C.A.
(1999).
Neurobehavioral evidence for working-memory deficits in school-aged
children with histories of prematurity.
Developmental Medicine and Child Neurology,
41,
521–533.CrossRefGoogle Scholar
Luoma, L.,
Herrgard, E., &
Martikainen, A.
(1998).
Neuropsychological analysis of the visuomotor problems in children
born preterm at <32 weeks gestation: A 5-year prospective
follow-up.
Developmental Medicine and Child Neurology,
40,
21–30.Google Scholar
McDermott, P.A.
(1995).
Sex, race, class, and other demographics as explanations for
children's ability and adjustment: A national appraisal.
Journal of School Psychology,
33,
75–91.Google Scholar
Ment, L.R.,
Vohr, B.,
Allan, W.,
Katz, K.H.,
Schneider, K.C.,
Westerveld, M.,
Duncan, C.C., &
Makuch, R.W.
(2003).
Change in cognitive function over time in very low-birth-weight
infants.
Journal of the American Medical Association,
289,
705–711.Google Scholar
Mesulam, M.
(1985).
Principles of behavioral neurology.
Philadelphia, PA:
F.A. Davis.
Miller, C.L.,
Landry, S.H.,
Smith, K.E.,
Wildin, S.R.,
Anderson, A.E., &
Swank, P.R.
(1995).
Developmental change in the neuropsychological functioning of very
low birth weight infants.
Child Neuropsychology,
1,
224–236.Google Scholar
Monset-Couchard, M.,
de Bethmann, O., &
Kastler, B.
(1996).
Mid- and long-term outcome of 89 premature infants weighing less
than 1,000 g at birth, all appropriate for gestation age.
Biology of the Neonate,
70,
328–338.CrossRefGoogle Scholar
Moos, R. &
Moos, B.
(1994).
Life Stressors and Social Resources Inventory–Adult Form:
Professional manual.
Odessa, FL:
Psychological Assessment Resources, Inc.
O'Callaghan, M.J.,
Burns, Y.R.,
Gray, P.H.,
Harvey, J.M.,
Mohay, H.,
Rogers, Y.M., &
Tudehope, D.I.
(1996).
School performance of ELBW children: A controlled study.
Developmental Medicine and Child Neurology,
38,
917–926.Google Scholar
Perlman, J.M.
(1998).
White matter injury in the preterm infant: An important
determination of abnormal neurodevelopment outcome.
Early Human Development,
53,
99–120.CrossRefGoogle Scholar
Powls, A.,
Botting, N.,
Cooke, R.W.I., &
Marlow, N.
(1995).
Motor impairment in children 12 to 13 years old with a birthweight
of less than 1250 g.
Archives of Disease in Childhood,
72,
F62–F66.Google Scholar
Pungello, E.P.,
Kupersmidt, J.B.,
Burchinal, M.R., &
Patterson, C.J.
(1996).
Environmental risk factors and children's achievement from
middle childhood to early adolescence.
Developmental Psychology,
32,
755–767.Google Scholar
Rickards, A.L.,
Kelly, E.A.,
Doyle, L.W., &
Callanan, C.
(2001).
Cognition, academic progress, behavior and self-concept at 14 years
of very low birth weight children.
Developmental and Behavioral Pediatrics,
22,
11–18.CrossRefGoogle Scholar
Rickards, A.,
Ryan, M., &
Kitchen, W.
(1988).
Longitudinal study of very low birth-weight infants: Intelligence
and aspects of school progress at 14 years of age.
Journal of Australian Paediatrics,
24,
19–23.Google Scholar
Roberts, J.E.,
Burchinal, M.,
Durham, M.
(1999).
Parents' report of vocabulary and grammatical development of
African American preschoolers: Child and environmental
associations.
Child Development,
70,
92–106.Google Scholar
Rourke, B.P.
(1988).
The syndrome of nonverbal learning disabilities: Developmental
manifestations in neurological disease, disorder, and dysfunction.
Clinical Neuropsychologist,
2,
293–330.CrossRefGoogle Scholar
Rutter, M.
(2000).
Psychosocial influences: Critiques, findings, and research needs.
Development and Psychopathology,
12,
375–405.Google Scholar
Rutter, M.,
Pickles, A.,
Murray, R., &
Eaves, L.
(2001).
Testing hypotheses on specific environmental causal effects on
behavior.
Psychological Bulletin,
127,
291–324.Google Scholar
Saigal, S.,
Hoult, L.A.,
Streiner, D.L.,
Stoskopf, B.L., &
Rosenbaum, P.L.
(2000).
School difficulties at adolescence in a regional cohort of children
who were extremely low birthweight.
Pediatrics,
105,
325–331.CrossRefGoogle Scholar
Salmon, D.P.,
Heindel, W.C., &
Hamilton, J.M.
(2001).
Cognitive abilities mediated by frontal–subcortical
circuits. In
D.G. Lichter &
J.L. Cummings (Eds.),
Frontal–subcortical circuits in psychiatric and neurologic
disorders (pp.
114–150).
New York:
Guilford.
Schafer, J.L.
(1997).
Analysis of incomplete multivariate data.
Boca Raton, FL:
Chapman & Hall/CRC.CrossRef
Schatz, J.,
Kramer, J.H.,
Ablin, A., &
Matthay, K.K.
(2000).
Processing speed, working memory, and IQ: A developmental model of
cognitive deficits following cranial radiation therapy.
Neuropsychology,
14,
189–200.CrossRefGoogle Scholar
Schothorst, P.F. &
van Engeland, H.
(1996).
Long-term behavioral sequelae of prematurity.
Journal of the American Academy of Child and Adolescent Psychiatry,
35,
175–183.CrossRefGoogle Scholar
Semel, E.,
Wiig, W., &
Sabers, D.
(1987).
CELF–R: Clinical Evaluation of Language
Functions–Revised (technical manual).
New York:
The Psychological Corporation.
Singer, J.D.
(1998).
Using SAS PROC MIXED to fit multilevel models, hierarchical models,
and individual growth models.
Journal of Educational and Behavioral Statistics,
23,
323–355.Google Scholar
Spreen, O. &
Strauss, E.
(1991).
A compendium of neuropsychological tests: Administration, norms,
and commentary.
New York:
Oxford University Press.
Stevenson, C.J.,
Blackburn, P., &
Pharoah, P.O.D.
(1999).
Longitudinal study of behaviour disorders in low birthweight
infants.
Archives of Disease in Childhood Fetal and Neonatal Edition,
81,
F5–F9.Google Scholar
Stiles, J.
(2000).
Spatial cognitive development following prenatal or perinatal
focal brain injury. In
H.S. Levin &
J. Grafman (Eds.),
Cerebral reorganization of function after brain damage (pp.
201–217).
New York:
Oxford University Press.
Szatmari, P.,
Saigal, S.,
Rosenbaum, P., &
Campbell, D.
(1993).
Psychopathology and adaptive functioning among extremely low
birthweight children at eight years of age.
Development and Psychopathology,
5,
345–357.Google Scholar
Taylor, H.G. &
Alden, J.
(1997).
Age-related differences in outcomes following childhood brain
insults: An introduction and overview.
Journal of the International Neuropsychological Society,
3,
555–567.Google Scholar
Taylor, H.G.,
Burant, C.,
Holding, P.A.,
Klein, N., &
Hack, M.
(2002).
Sources of variability in sequelae of very low birth weight.
Child Neuropsychology,
8,
163–178.Google Scholar
Taylor, H.G.,
Hack, M., &
Klein, N.
(1998a).
Attention deficits in children with <750 gm birth weight.
Child Neuropsychology,
4,
21–34.Google Scholar
Taylor, H.G.,
Klein, N., &
Hack, M.
(2000a).
School-age consequences of birth weight less than 750 g: A review
and update.
Developmental Neuropsychology,
17,
289–321.Google Scholar
Taylor, H.G.,
Klein, N.,
Minich, N., &
Hack, M.
(2000b).
Middle school-age outcomes in children with very low birthweight.
Child Development,
71,
1495–1511.Google Scholar
Taylor, H.G.,
Klein, N.,
Schatschneider, C., &
Hack, M.
(1998b).
Predictors of early school age outcomes in very low birthweight
children.
Developmental and Behavioral Pediatrics,
19,
235–243.Google Scholar
Taylor, H.G.,
Minich, N.M.,
Klein, N., &
Hack, M.
(2000c).
Verbal memory deficits in children with <750 g birth weight.
Child Neuropsychology,
6,
49–63.Google Scholar
Taylor, H.G.,
Schatschneider, C., &
Minich, N.M.
(2000d).
Longitudinal outcomes of Haemophilus influenzae meningitis
in school-age children.
Neuropsychology,
14,
509–518.Google Scholar
Taylor, H.G.,
Schatschneider, C.,
Petrill, S.,
Barry, C.T., &
Owens, C.
(1996).
Executive dysfunction in children with early brain disease:
Outcomes post Haemophilus influenzae meningitis.
Developmental Neuropsychology,
12,
35–51.Google Scholar
Thompson, N.M.,
Francis, D.J.,
Stuebing, K.K.,
Fletcher, J.M.,
Ewing-Cobbs, L.,
Miner, M.E.,
Levin, H.S., &
Eisenberg, H.M.
(1994).
Motor, visual-spatial, and somatosensory skills after closed head
injury in children and adolescents: A study of change.
Neuropsychology,
8,
333–342.CrossRefGoogle Scholar
Usher, R. &
McLean, F.
(1969).
Intrauterine growth of live-born Caucasian infants at sea level:
Standards obtained from measurements of 7 dimensions of infants born
between 25 and 44 weeks of gestation.
Pediatrics,
74,
901–910.CrossRefGoogle Scholar
Volpe, J.J.
(1998).
Brain injury in the premature infant: Overview of clinical aspects,
neuropathology, and pathogenesis.
Seminars in Pediatric Neurology,
5,
135–151.Google Scholar
Waber, D.P. &
McCormick, M.C.
(1995).
Late neuropsychological outcomes in preterm infants of normal IQ:
Selective vulnerability of the visual system.
Journal of Pediatric Psychology,
20,
721–735.Google Scholar
Wechsler, D.
(1991).
WISC–III: Wechsler Intelligence Scale for Children–3rd
Edition: manual.
San Antonio, TX:
The Psychological Corporation.
Wolke, D. &
Meyer, R.
(1999).
Cognitive status, language attainment, and prereading skills of
6-year-old very preterm children and their peers: The Bavarian
Longitudinal Study.
Developmental Medicine and Child Neurology,
41,
94–109.Google Scholar
Zelkowitz, P.,
Papageorgiou, A.,
Zelazo, P.R., &
Weiss, M.J.S.
(1995).
Behavioral adjustment in very low and normal birth weight children.
Journal of Clinical Child Psychology,
24,
21–30.Google Scholar

Sample characteristics
Sample characteristics at each assessment and attrition

Neuropsychological outcome measures
Significant effects from mixed model analyses indicating overall group differences in outcome (only differences not moderated by other factors considered)
Significant effects from mixed model analyses indicating group differences in rates of change
Model estimates of group means in raw scores across age for the Developmental Test of Visual–Motor Integration (VMI). Follow-up of a significant Age Factor × Group contrast effect (see Table 5) revealed less rapid age-related gains in the <750 g group than in the term-born group [F(2,256) = 11.93, p < .01].
Model estimates of group means in raw scores across age for the Block Design subtest of the Wechsler Intelligence Scale for Children, 3rd Edition (WISC–III). The means graphed in 2a and 2b represent performance at a low and high level of socioeconomic status (SES), as defined by values 1 SD below and above the sample mean, respectively. The age Factor × Group interaction graphed in 2a (low level of SES) was not significant. Follow-up of the interaction shown in 2b (high level of SES) indicated that the <750 g group made slower age-related gains than the term-born group [F(2,262) = 3.64, p < .05]. Analysis of these interactions was justified by a significant age Factor × Group × SES interaction (see Table 5).
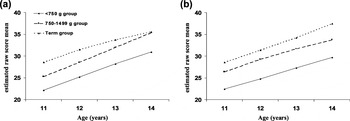
Model estimates of group means in raw scores across age for the Vocabulary subtest of the Wechsler Intelligence Scale for Children, 3rd Edition (WISC–III). The means shown represent performance at low and high levels of family resources, as defined by values 1 SD below and above the sample mean, respectively. Follow-up of the interaction shown in 3a (low level of resources) indicated that the 750–1499 g group made more rapid age-related gains than the term-born group [F(2,254) = 3.99, p < .05]. Follow-up of the interaction shown in 3b (high level of resources) indicated that the 750–1499 g group made slower age-related gains than the term controls [F(2,254) = 3.40, p < .05]. Analysis of these interactions was justified by a significant Age Factor × Group × SES interaction (see Table 5).
 You have
Access
- 148
- Cited by