Introduction
Localized surface plasmons and enhanced electromagnetic fields
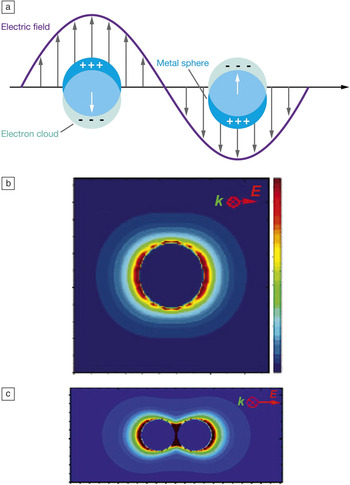
Noble metal nanoparticles, such as gold and silver, have attracted significant research interest due to their ability to behave as nanoscale antennas for visible and near-IR (infrared) light.Reference Schwartzberg and Zhang1–Reference Hutter and Fendler4 The antenna effect originates from the excitation of localized surface plasmons or the light-driven collective oscillation of the surface conduction electrons in the nanoparticle(s). Materials that can support plasmons must possess a negative real and small positive imaginary dielectric constant, which means that the material has a large number of loosely bound electrons and a low probability of absorbing incident light. In the case of localized surface plasmons, the nanoparticles must be smaller than the wavelength of the exciting light in order for the electrons to oscillate together in response to the electric field of the excitation light, as shown in Figure 1a.Reference Willets and Van Duyne5
Schematic diagrams illustrating a localized surface plasmon in metal nanoparticles (a) and the resulting enhanced electromagnetic field around nanospheres (b and c). (a) Nanoparticles with dimensions smaller than the wavelength of an excitation source can exhibit an oscillation of their conduction band electrons, creating an enhanced electromagnetic field around their surfaces. Reprinted with permission from Reference Reference Willets and Van Duyne5. ©2006, Annual Reviews. (b) Discrete dipole approximation (DDA) calculation of the electromagnetic field surrounding a silver nanosphere (radius = 19 nm) excited with 400 nm light. Here, red indicates a field of higher intensity, while blue represents lower intensity. Adapted with permission from Reference Reference Hao, Schatz and Hupp9. ©2004, Springer. (c) DDA calculation of the electromagnetic field surrounding a dimer of silver nanospheres (radii = 36 nm) separated by 2 nm and excited with 520 nm light. Adapted with permission from Reference Reference Hao and Schatz6. ©2004, American Institute of Physics. k, wave vector; E, electric field.

When these conditions are met, light of a specific frequency can drive a plasmon and create an enhanced electromagnetic (EM) field around the nanoparticle.Reference Hao and Schatz6, Reference Xu, Bjerned, Kall and Borjesson7 If we consider a spherical nanoparticle illuminated with z-polarized light (as in Figure 1b), we can use Maxwell’s equations to calculate the spatial distribution of the locally enhanced EM field at the nanoparticle surface:
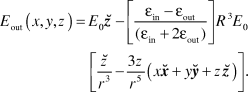
In this expression, E out is the EM field at a given position (x, y, z) in space; E 0 is the z-polarized incident field; εin and εout are the dielectric constants of the nanoparticle and its surroundings, respectively; R is the nanoparticle radius; r is the distance from the center of the sphere; and  ,
 , and
 are unit vectors corresponding to the typical Cartesian coordinates. Because Maxwell’s equations can only be applied to spherical and spheroidal nanoparticles, a variety of theoretical methods have been developed to calculate EM field enhancements at nanoparticle surfaces of arbitrary shape and size, including finite element modeling, discrete dipole approximation, and finite difference time domain approaches.Reference Mcmahon, Henry, Wustholz, Natan, Freeman, Van Duyne and Schatz8–Reference Oubre and Nordlander14Figure 1b shows an example of the intensity of the enhanced EM fields at the surface of a spherical nanoparticle calculated using the discrete dipole approximation approach and z-polarized excitation.Reference Hao, Schatz and Hupp9 The maximum intensity occurs at the poles of the sphere and has calculated |E out|2/|E 0|2 enhancements that exceed a factor of 100. As discussed later in the text, other nanoparticle shapes can offer even higher EM field enhancements, exceeding over 104.
Surface-enhanced Raman scattering (SERS)
The enhanced EM fields at the surface of plasmonic nanoparticles lead to a variety of surface-enhanced spectroscopies, in which a molecule close to the nanoparticle surface demonstrates enhanced absorption and/or emission. Examples include surface-enhanced Raman scattering (SERS), surface-enhanced fluorescence (SEF), surface-enhanced infrared absorption (SEIRA), and surface-enhanced Raman optical activity (SEROA).Reference Lal, Grady, Kundu, Levin, Lassiter and Halas15–Reference Kneipp, Kneipp and Kneipp23 SERS in particular has attracted significant interest due to its potential for molecular sensing and identification in biological, chemical, and medically relevant environments. Raman scattering is an inelastic light scattering process that can be used to identify molecules based on characteristic vibrations. Typically this signal is very weak due to low Raman cross-sections. However, when a molecule is in close proximity to a plasmonic metal nanoparticle or nano-roughened metal surface, the Raman scattering can be increased by 106—109 by a combination of chemical and EM enhancement and, under the right circumstances, even permit single molecule SERS detection.Reference Nie and Emory20, Reference Kneipp, Wang, Harald, Perelman, Itzkan, Dasari and Feld24
The SERS enhancement factor (EF) at the surface of a particle or aggregate can be defined via the following equation:
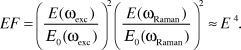
Here, E 0 is the incident EM field, E is the enhanced EM field at the nanoparticle surface, ωexc is the frequency of the excitation source, and ωRaman is the frequency of the Raman scattering.Reference Le Ru and Etchegoin25 Because ωexc and ωRaman are close in energy (Raman peaks of interest—which represent the energy difference between ωexc and ωRaman—are typically in the 100–3000 cm–1 range), SERS is often referred to as an E 4 enhancement mechanism. The origin of the E 4 enhancement is that both the excitation light and the Raman scattered light can couple into the plasmon of the material, the former creating the enhanced excitation field at the surface and the latter being reradiated via plasmonic coupling into the far field.Reference Le Ru and Etchegoin25
The extent of the EM field enhancement is highly dependent upon the wavelength and polarization of the excitation light, as well as the shape, size, and aggregation state of the nanoparticle. Figure 1c shows a calculation of the EM field enhancement for a spherical nanoparticle dimer, illuminated with light polarized along its long axis, revealing a region of significant intensity enhancement (|E out|2/|E 0|2 ≈ 11,000) at the gap between the two nanoparticles.Reference Hao and Schatz6 Researchers hypothesize that the greatest SERS enhancement must therefore occur in the junction regions between aggregated nanoparticles and have termed these regions SERS “hot spots.” Although these hot spots make up only a small percentage of the total substrate volume, it is believed that the bulk of the SERS signal is due to molecules located at these sites.Reference Fang, Seong and Dlott27
In the case of SERS from a single molecule, we speculate that the molecule must land in one of these hot spots in order to produce a sufficiently high SERS signal.Reference Etchegoin and Le Ru28 To date, the substrates best able to produce hot spots for single molecule SERS (SM-SERS) are randomly aggregated silver colloids, with diverse shape and size.Reference Lal, Grady, Kundu, Levin, Lassiter and Halas15 Despite the random nature of these substrates, a common theme for all SM-SERS-active nanoparticles is aggregation, which produces junction regions between adjacent nanoparticles.Reference Wang, Eswaramoorthy, Sherry, Dieringer, Camden, Schatz, Van Duyne and Marks29 However, we are limited in our ability to confirm the location of a SERS-active molecule on the surface of a metal nanoparticle aggregate and quantify how the local EM field enhancement affects the observed signal due to the optical diffraction limit, as described later. Although the ability to sense a single molecule is not necessarily required for many sensing applications, understanding the factors that lead to SM-SERS is critical for designing optimized SERS substrates and maximizing the measured SERS signals.
Super-resolution imaging
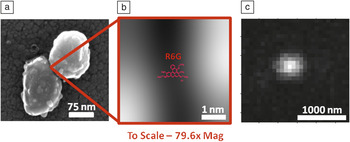
To get a sense of scale for a typical SM-SERS-active silver nanoparticle, Figure 2a shows a scanning electron microscope (SEM) image of a representative SM-SERS active dimer, which measures roughly 200 nm along its long axis (typical nanoparticle diameters of 20–150 nm are routinely observed in this system). In Figure 2b, we zoom in on the junction region of this dimer (resolution is limited by the SEM) and insert a to-scale representation of a Rhodamine 6G (R6G) molecule into the junction region between the two nanoparticles. The molecule is roughly two orders of magnitude smaller than the nanoparticle.
A typical silver nanoparticle aggregate labeled with Raman-active dye, Rhodamine 6G (R6G). (a) Scanning electron microscopy image of dimer of silver nanoparticles. Adapted with permission from Reference Reference Weber and Willets30. ©2011, American Chemical Society. (b) A zoomed view of the nanoparticle junction region with a to-scale representation of an R6G molecule. (c) Example of a diffraction-limited image taken in a wide-field optical microscope. Adapted with permission from Reference Reference Willets, Stranahan and Weber50. ©2012, American Chemical Society.

Imaging the SERS emission from this nanoparticle using standard far-field optics produces an image like the one shown in Figure 2c. To obtain images like this, silver nanoparticles are prepared in solution and then incubated with a SERS tag (such as R6G) and salt to facilitate aggregation. The labeled nanoparticles are dispersed from solution onto microscope cover glass and dried, and the resulting sample is then mounted into an optical microscope. Laser excitation (here, 532 nm) is focused through a high numerical aperture oil-immersion microscope objective in a wide field epi-illumination geometry, with an illumination spot size of ∼10 μm in diameter and illumination intensity of ∼0.7–7 kW cm–2. The resulting Raman scattering is collected back through the same objective and imaged onto an electron-multiplied charge-coupled device (EM-CCD). If the nanoparticle aggregates are well-dispersed on the surface, each aggregate will appear as an isolated spot on the CCD, as shown in Figure 2c.Reference Weber and Willets30, Reference Stranahan and Willets31
Instead of seeing the shape of the underlying nanoparticle(s) and/or the location of the molecule in this image, we see a spot with a diameter of ∼500 nm. This is due to the diffraction limit of light, which hinders our ability to discern nanoscale features using far-field optics. The diffraction limit of light is defined by the Rayleigh criterion, indicated by Equation 3:

In this equation, d sep is the separation distance required to discern two point sources and is dependent upon the wavelength of the emitted light (λ) and the numerical aperture (NA) of the imaging optics (e.g., microscope objective). When interrogating structures with light in the visible range (e.g., 532 nm) using a 100x objective with NA = 1.4, this corresponds to a minimum resolvable distance of about 250 nm, which is significantly larger than the spacing between the individual nanoparticles and the molecule on their surface. Moreover, the Rayleigh criterion defines the radius of the observed diffraction-limited spot in the corresponding optical image, as shown in Figure 2c; this represents the point spread function (PSF) of the microscope optics. Because of the diffraction limit, we are unable to rigorously identify the nanoparticle shape, aggregation pattern, molecule location, or hot spot features of SERS-active nanoparticles using standard far-field optical techniques.
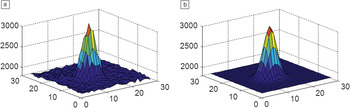
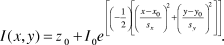
Recently, super-resolution imaging techniques have been employed to overcome this diffraction limit of light and obtain spatially resolved information about plasmonic hot spots.Reference Weber and Willets30–Reference Weber, Litz, Masiello and Willets32 In such super-resolution imaging, the PSF of a diffraction-limited spot (such as Figure 2c) is plotted in three dimensions (Figure 3a) and then fit to a two-dimensional Gaussian (Equation 4, Figure 3b) in order to determine the centroid (peak location) of the emission spot. The equation for fitting the PSF of a diffraction-limited spot is approximated as a two-dimensional Gaussian as follows:
Gaussian fitting of a point spread function. The intensity color scales are in arbitrary units with orange being higher intensity and blue being lower. x and y dimensions are represented in pixels (1 pixel = 46 nm). (a) The raw two-dimensional representation of a point spread function like that in Figure 2c. (b) The Gaussian fit of the raw point spread function which is shown in (a). This fitting technique allows very accurate localization of an emission centroid. Adapted with permission from Reference Reference Willets, Stranahan and Weber50. ©2012, American Chemical Society.

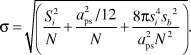
In this equation, I represents the intensity at a given position (x,y), z 0 is the background, x 0 and y 0 are the centroid of the fit, and sx,y are the standard deviations in the x and y-directions, respectively.Reference Gordon, Ha and Selvin33–Reference Thompson, Larson and Webb35 The centroid position (x 0,y 0) is the quantity of interest in this analysis because it defines the spatial origin of the observed signal. The accuracy of this centroid position, σ, can be defined by the following equation:
(5)
Here, N is the number of photons collected on a CCD camera with pixel size a ps (given in nm); s b is the standard deviation of the background signal in photons; and si is the standard deviation of the Gaussian fit (defined as sx,y in Equation 4).Reference Yildiz and Selvin36 With sufficient signal-to-noise and appropriate choice of detector, the accuracy of the calculated centroid can be better than 5 nm, which represents a 50x improvement over the diffraction limit.
Super-resolution imaging of SERS hot spots
Mapping out the hot spots
The PSF fitting technique allows us to spatially locate the origin of the SERS signal from a molecule coupled to a plasmonic nanoparticle (for complete details on the fitting/analysis procedure, the interested reader is referred to the original references).Reference Weber and Willets30–Reference Weber, Litz, Masiello and Willets32 A sample is prepared in which a molecule is adsorbed to a nanoparticle aggregate, and the resulting SERS signal is imaged with a wide-field optical microscope and detected with a CCD camera, producing a diffraction-limited image as described earlier. A series of images are acquired over time, and each image is fit to Equation 4 to track the centroid. For a stationary emitter, we expect the centroid values to converge to a single location, with a precision defined by Equation 5. However, SM-SERS is characterized by strong fluctuations in the intensity of the observed SERS signals, which have been attributed to diffusion of the analyte on the nanoparticle surface.Reference Weiss and Haran37, Reference Maruyama, Ishikawa and Futamata38 Thus, super-resolution imaging offers a unique tool for investigating this phenomenon and relating the spatial origin of the SERS signal (e.g., the centroid) to the measured SERS intensity.
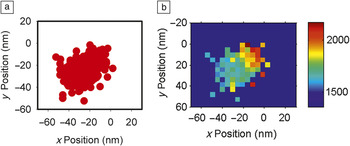
Figure 4a shows a scatter plot of SERS centroids for a series of images taken from a single SM-SERS active silver nanoparticle aggregate labeled with R6G, where each point in the graph represents the centroid fit of a single image.Reference Stranahan and Willets31 The centroid data are then binned (where each bin corresponds to a 4.6 nm × 4.6 nm region, or 1/10th the size of an imaging pixel), and the average SERS intensity associated with all points within a bin is calculated to create a two-dimensional intensity histogram, as shown in Figure 4b. This histogram is known as a spatial intensity map and allows us to spatially identify the regions of the most intense SERS emission.
These figures relate the shape and size of a hot spot as determined experimentally. (a) Scatter plot of emission centroids (each represented as a single red dot) for an R6G molecule. (b) Spatial intensity histogram displaying the average surface-enhanced Raman scattering intensity (arbitrary units with red indicating higher intensity and blue indicating lower intensity) measured at each centroid position. The bin size is 4.6 nm. Adapted with permission from Reference Reference Stranahan and Willets31. ©2010, American Chemical Society.

There are several important features to note about this spatial intensity map. First, the SERS intensity depends on the spatial origin of the signal, with the highest intensity associated with the upper right corner of the histogram and a gradient, directional decay in the SERS intensity as the emission centroid moves away from that spot; second, the SERS centroid data cover an area significantly larger than the error in our fit (>40 nm versus <5 nm, respectively); and third, the SERS centroid data are not symmetric around some mean value (as expected for a stationary emitter) but instead show a pronounced ellipticity. These trends lead us to conclude that the molecule must be changing its position over time and exploring the surface of the underlying nanoparticle. When the molecule is in the hot spot, we expect to see the strongest SERS intensity due to the strongly enhanced EM fields at this site; this is associated with the upper right corner of the spatial intensity map. As a molecule diffuses out of the hot spot, its SERS signal falls off in a gradient manner as the EF decreases, consistent with the theoretical calculations of the EM field enhancement in aggregated nanostructures (as in Figure 1c).Reference Hao and Schatz6, Reference Hao, Schatz and Hupp9
These data represent the first all-optical mapping of a SERS hot spot using a single molecule, showing how the intensity of the SERS signal changes as the spatial origin of the signal changes. However, the data are complicated by the fact that the SERS centroid does not represent the actual position of the molecule on the surface; rather, it reports how the molecule couples into and is radiated into the far field by different plasmon antenna modes as it explores the nanoparticle surface.Reference Ausman and Schatz39 As described previously, the plasmonically enhanced EM fields at the surface of the nanoparticles depend strongly on the shape and size of the nanoparticle. Thus, to better understand the relationship between the SERS spatial intensity map and the underlying plasmon modes of the nanostructure, we turn to correlated optical and structural imaging in which we combine super-resolution imaging with electron microscopy.
Correlated super-resolution imaging and electron microscopy
For correlated optical and structural imaging, samples are prepared on a conductive indium tin oxide-coated glass substrate patterned with an alpha-numeric grid to facilitate sample transfer and aggregate identification in the electron microscope.Reference Weber and Willets30, Reference Weber, Litz, Masiello and Willets32 Spatial intensity maps are calculated as described earlier and compared to the structure of the SERS-active nanoparticle. As discussed previously, we expect the “hottest” spot to be associated with the junction of the nanoparticle and for the gradient decay in the SERS intensity to be associated with movement away from that junction. For the data shown here, the “hot” junction has been assigned based on a qualitative agreement between the shape of the spatial intensity map and the geometry of the SERS-active nanoparticle; quantitative assignment of the hot spots will be discussed later.
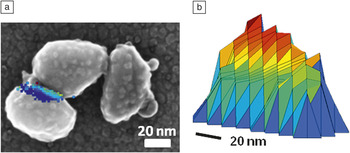
Figure 5a shows an example of a silver nanoparticle trimer that showed SM-SERS activity.Reference Weber and Willets30 The corresponding spatial intensity map (shown as a three-dimensional projection in Figure 5b) has a high intensity edge that decays in a gradient and directional fashion away from the hottest spot. Although the trimer in Figure 5a has two junction regions, the shape and alignment of the spatial intensity map agrees best with a molecule exploring the lower left junction region. This may be the only SERS-active junction due to either the absence of a molecule in the upper right junction or to biased excitation of the plasmon modes associated with the leftmost junction based on the excitation wavelength and polarization.Reference McLellan, Li, Siekkinen and Xia40, Reference Xu and Kall41 Importantly, the shape of the spatial intensity map reflects the geometry of the nanoparticle and how EM fields would be enhanced at its surface, based on theoretical calculations of similar nanoparticle structures.Reference Wustholz, Henry, McMahon, Freeman, Valley, Piotti, Natan, Schatz and Van Duyne42
Correlating optical data with scanning electron microscope (SEM) micrographs. (a) SEM image of a silver nanoparticle trimer with overlaid surface-enhanced Raman scattering spatial intensity histogram. (b) A two-dimensional representation of the spatial intensity histogram (arbitrary units with red indicating higher intensity and blue indicating lower intensity). This figure is an excellent example of how optical hot spot data can map out the approximate shape and size of an aggregate junction region. Adapted with permission from Reference Reference Weber and Willets30. ©2011, American Chemical Society.

One significant challenge with these correlated studies is the ability to obtain quantitative overlays of the spatial intensity maps with the SEM images. Thus far, efforts to triangulate the position of the “hot spot” on the nanoparticle structure using fluorescent beads as alignment markers have failed due to sample and stage drift. While stage drift can be corrected in optical studies by calculating and correcting the centroid position of the stationary alignment markers, it is more difficult to account for in SEM imaging due to the long acquisition times necessary for high resolution images. Also, bead and nanoparticle positions may be altered in the course of transferring the sample from one microscope to another due to thermal energy provided by ambient conditions. Several of our studies have focused on modifying the substrate to minimize bead movement, but thus far no strategy has produced triangulation results with reasonable accuracy (<50 nm).
Despite the challenges associated with quantitative assignment of the nanoparticle hot spots, it is possible to use secondary signals from the nanoparticles themselves to aid in the assignment of the SERS-active junction. Silver nanoparticles have a well-known (but poorly understood) luminescence signal that can also be analyzed with super-resolution techniques.Reference Stranahan and Willets31, Reference Borys and Lupton43–Reference Geddes, Parfenov, Gryczynski and Lakowicz45 Recent work in our lab has shown that the luminescence and SERS couple to the nanoparticle plasmon modes in different ways: in the case of luminescence, the signal samples all plasmon modes excited in the nanoparticle (a collective plasmon excitation), while in the case of SM-SERS, only the plasmon modes associated with the location of the molecule are excited (a local plasmon excitation).Reference Weber, Litz, Masiello and Willets32 By combining correlated SERS and SEM imaging with theoretical calculations using the discrete dipole approximation, it is possible to predict the average locations of the two emission centroids and compare them to the qualitative experimental assignments. This strategy has yielded excellent agreement and may prove to be a complementary approach to triangulation using alignment markers.
Super-resolution imaging of SEF hot spots
Cang et al.Reference Cang, Labno, Lu, Yin, Liu, Gladden, Liu and Zhang46 demonstrated another approach to imaging hot spots using super-resolution imaging. In that study, silver colloids were immobilized on a glass substrate, then immersed in an aqueous solution containing a fluorescent dye and imaged in a wide-field total internal reflection microscope with a CCD detector. At an appropriately low dye concentration (<1 nM), Brownian motion will cause individual dye molecules to diffuse into a hot spot, emit a burst of fluorescence, and then undergo photobleaching. These single “on” events can be fit to a 2D Gaussian (Equation 4) using linear least squares to obtain initial fit parameters, which are then used in a maximum likelihood estimation method to obtain the centroid of the diffraction limited spot.Reference Gordon, Ha and Selvin33, Reference Betzig, Patterson, Sougrat, Lindwasser, Olenych, Bonifacino, Davidson, Lippincott-Schwartz and Hess48, Reference Cheezum, Walker and Guilford49
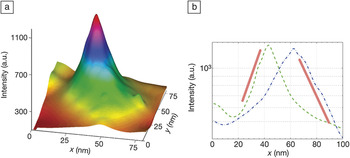
Using this approach, the researchers were able to localize the emission centroid of a single fluorophore, Chromeo 546, with 1.2 nm accuracy and create a three-dimensional rendering of the intensity profile of the hot spot, as shown in Figure 6a. Cross-sections of the hot spot map in both the x- and y-dimension are shown in Figure 6b and reveal that the hot spot decays both exponentially and asymmetrically from its peak value (note that the intensity is plotted on a log scale). Similar to the SERS data, the hot spot is elliptically shaped (Figures 4b and 5a–b), and the intensity decays as the centroid moves away from the peak of highest intensity. However, unlike the SERS data, the hot spot does not show directionality in the intensity decay and decreases smoothly in all directions from the “hottest” spot. This is most likely due to differences in how the molecule(s) samples the hot spot. In the SERS case, the molecule is adsorbed and diffuses on the surface, which means it is confined by the underlying morphology of the nanoparticle. On the other hand, with SEF, the molecules freely diffuse in solution and are able to sample all regions of the nanoparticle surface. In this case, the SEF approach will map out the entire hot spot, while the SERS case is confined to the path explored by the molecule. Both have advantages: SEF provides a more complete picture of the locally enhanced EM fields, while SERS is able to track real-time molecular dynamics in strongly enhanced EM fields.
Diffusion-mediated mapping of a nanoparticle hot spot using surface-enhanced fluorescence. (a) Reconstructed hot spot formed on a silver nanoparticle using Chromeo 642 dye and a 644-nm laser. The maximum enhancement factor, found at the peak, corresponds to a 136x enhancement compared to the same dye adsorbed onto a glass surface. (b) Cross-sectional view of the hot spot through the peak along x (green) and y (blue). The red lines are used to emphasize the exponential behavior of the cross-sectional views. Adapted with permission from Reference Reference Cang, Labno, Lu, Yin, Liu, Gladden, Liu and Zhang46. ©2011, Nature Publishing Group.

In addition to mapping hot spots from silver nanoparticles, SEF super-resolution imaging has also been used to characterize hot spots in aluminum films.Reference Cang, Labno, Lu, Yin, Liu, Gladden, Liu and Zhang46 As with the silver nanoparticle hot spots, regions of enhanced fluorescence that decayed exponentially from the “hottest” region were observed, although the enhancements were much lower given the reduced plasmonic properties of aluminum in the visible regime, as well as its susceptibility to oxidation. Interestingly, the authors found that the extent of the SEF enhancement tracked with the size of the calculated hot spot, with the strongest fluorescence enhancement (∼50) observed for the smallest hot spot diameter (∼15 nm).Reference Cang, Labno, Lu, Yin, Liu, Gladden, Liu and Zhang46 These data underscore an important difference between using SEF and SERS to map hot spots. In SEF, the signal comes from fluorescent dyes, which can be observed at the single molecule level without the aid of plasmonic enhancement. As a result, weakly enhancing substrates can be characterized using SEF super-resolution imaging, and a quantitative enhancement factor can be calculated simply by comparing the metal-enhanced fluorescence signal to a fluorophore immobilized on quartz. On the other hand, normal Raman scattering from a single molecule cannot be observed without the benefit of sizable EM field enhancements, making the hot spots characterized by super-resolution SERS imaging more rare, but also of great importance for substrate characterization and optimization.
Summary
The super-resolution imaging techniques outlined in this article represent a significant advancement in the study of plasmonic nanomaterials, providing researchers with the ability to interrogate enhanced electromagnetic (EM) fields beyond the resolution limit of the diffraction limit of light. Localization accuracies of <5 nm can be obtained using both methods, which is better than most near-field approaches that offer resolutions of ∼15–20 nm. Moreover, the readout is provided by the molecules that are coupled to the plasmonic near-field of the nanoparticle, which offers unique insight into how individual emitting dipoles are impacted by the plasmon modes of nearby molecules.
To date, two different approaches to super-resolution imaging of plasmonic hot spots have been reported, the first based on surface-enhanced Raman scattering (SERS) and the second based on surface-enhanced fluorescence (SEF).Reference Willets, Stranahan and Weber50 Both methods have their associated advantages and disadvantages. The SERS technique is based on the emission from a single or a few molecules and, as such, needs the molecule(s) to remain SERS-active for a significant amount of time in order to build up a complete image of the local EM field enhancement. In contrast, the SEF method summarizes the emission from numerous fluorophores as they photobleach. Consequently, the signal-to-noise ratio may be simply increased by collecting more data points. A second advantage to the SEF method is that EFs are easily calculated by comparing fluorescence from diffusing analytes on a roughened metal surface to the same analyte diffusing across non-enhancing glass or quartz. In contrast, SERS EFs are difficult to calculate and require knowledge of the exact number of analytes present within a hot spot. One significant advantage of the SERS approach is the ability to study the real-time dynamics of a molecule interacting with a colloid aggregate and exploring a hot spot.
Although the insights into local EM field enhancements and hot spot shape and size provided by super-resolution imaging are quite powerful, the technique improves when coupled with electron or atomic force microscopy or even near-field imaging of the excitation fields.Reference Nelayah, Kociak, Stéphan, GarcÍa de Abajo, Tencé, Henrard, Taverna, Pastoriza-Santos, Liz-Marzán and Colliex51–Reference Alonso-Gonzalez, Schnell, Sarriugarte, Sobhani, Wu, Arju, Khanikaev, Golmar, Albella, Arzubiaga, Casanova, Hueso, Nordlander, Shvets and Hillenbrand53 By improving our understanding of plasmonic hot spots, we will ultimately achieve the goal of designing robust, reliable substrates for surface-enhanced spectroscopy. Those with an interest in this area may also be interested in the article by Vesseur et al. in this issue, which addresses electron beam probes of plasmonic effects in nanostructures.Reference Vesseur, de Waele, Kuttge and Polman54
Acknowledgment
This work was supported by the Welch Foundation under Award No. F-1699.