INTRODUCTION
Mistletoes can have a profound effect on soil nutrient concentrations in terrestrial habitats (March Reference MARCH2007, March & Watson Reference MARCH and WATSON2007, Reference MARCH and WATSON2010), especially of N, which represents one of the major controls of plant productivity in arid ecosystems (Cross & Schlesinger Reference CROSS and SCHLESINGER1999). In the semi-arid savanna, the effects of mistletoes on nutrient cycling have not been investigated, and we are yet to understand how mistletoes impact cycling of nitrogen (N). In arid and semi-arid ecosystems of southern Africa trees are commonly infected by mistletoes mainly from the Loranthaceae and Viscaceae (Dean et al. Reference DEAN, MIDGLEY and STOCK1994). In addition to enhancing microbial activity (Bardgett et al. Reference BARDGETT, SMITH, SHIEL, PEACOCK, SIMKIN, QUIRK and HOBBS2006, Mueller & Gehring Reference MUELLER and GEHRING2006), mistletoes attract animal associates from a wide range of groups like mammals, birds and insects, thus increase diversity in environments where they occur (Watson Reference WATSON2009). Mistletoes have been found to enhance rates of nutrient cycling (March Reference MARCH2007, March & Watson Reference MARCH and WATSON2007, Reference MARCH and WATSON2010) through changes to the plant community and the abiotic environment. Three major mechanisms are thought to affect the rates of cycling of N: (1) changes in the quantity and (2) quality of resources available to microbes and (3) alteration of soil abiotic properties (Bardgett et al. Reference BARDGETT, SMITH, SHIEL, PEACOCK, SIMKIN, QUIRK and HOBBS2006, March & Watson Reference MARCH and WATSON2007, Reference MARCH and WATSON2010; Mueller & Gehring Reference MUELLER and GEHRING2006).
Recent studies conducted in Australia reported that mistletoe infection increased volumes of litter (March & Watson 2007, 2010) beneath host tree crowns, and thus may contribute to higher nutrient returns beneath infected trees. In addition, parasitic plants attain higher concentrations of foliar nutrients than their hosts (Bowie & Ward Reference BOWIE and WARD2004, Ehleringer & Marshall Reference EHLERINGER, MARSHALL, Press and Graves1995), and due to minimal withdrawal of elements occurring prior to abscission the litter remains enriched (Pate et al. Reference PATE, TRUE and KUO1991, Quested et al. Reference QUESTED, PRESS, CALLAGHAN and CORNELISSEN2002). Such litter decomposes faster and releases nutrients more rapidly than litter of co-occurring species, and may also stimulate the decomposition of more recalcitrant litters when mixed (Quested et al. Reference QUESTED, PRESS, CALLAGHAN and CORNELISSEN2002). The concentrations of structural compounds such as lignin as well as tannins and phenolics are known to regulate nutrient cycling (Gallardo & Merino Reference GALLARDO and MERINO1992, Hattenschwiler & Vitousek Reference HÄTTENSCHWILER and VITOUSEK2000, Melillo et al. Reference MELILLO, ABER and MURATORE1982), but no study has examined the effects of secondary compounds in mistletoe litter on N cycling. Litters with high lignin and/or polyphenol concentration, through mechanisms such as enhancing N immobilization (Gallardo & Merino Reference GALLARDO and MERINO1992), inhibiting nitrification (Horner et al. Reference HORNER, GOSZ and CATES1988) or retarding microbial breakdown of organic matter (El Azhar et al. Reference EL AZHAR, VERHE, PROOT, SANDRA and VERSTRAETE1986, Hattenschwiler & Vitousek Reference HÄTTENSCHWILER and VITOUSEK2000, Joanisse et al. Reference JOANISSE, BRADLEY, PRESTON and MUNSON2007), have been shown to slow the breakdown of leaf litter and consequently nutrient release. However, in mistletoes or parasitic plants in general, recalcitrant components such as lignin may be in low concentrations (Watson Reference WATSON2009), thus we expect strong effects of mistletoe litter on N cycling in the semi-arid savanna.
This study investigated the effects of mistletoes on N cycling in a semi-arid savanna woodland. The study addressed two questions: (1) What effect does mistletoe infection have on N cycling? (2) Do these effects vary with mistletoe species and soil horizon? The addition of organic matter through decomposition of mistletoe litter may represent an additional source of nutrients in this system. Therefore, mistletoe infection is likely to increase the return of nitrogen via litterfall. Thus, we hypothesized that, in semi-arid savannas, soil N-related attributes would be greater beneath infected trees (hosts) than beneath uninfected trees (non-hosts). We also expected to find the effects on N cycling to vary with mistletoe species. Our study focused on N, because under most circumstances, its cycling is under biological more than geochemical control.
STUDY SITE
The study was carried out in the Matopos Research Station (20°23′S 28°28′E) located 30 km south-west of Bulawayo at 1340 m asl. The mean annual temperature is 23.6°C and mean annual precipitation is 600 mm (Dye & Walker Reference DYE and WALKER1987). The soils, predominantly medium-textured red clay soils (Dye Reference DYE1983), are prone to surface crusting resulting in bare patches (Ward et al. Reference WARD, RICHARDSON, DENNY and DYE1979). Rattray (Reference RATTRAY1957) described the vegetation, dominated by Acacia karroo, Acacia nilotica, Acacia gerrardii, Acacia rehmanniana, Acacia nigrescens and Maytenus senegalensis, as Acacia tree–bush savanna of varying density. We studied the three most common mistletoes in this region (Mapaura & Timberlake Reference MAPAURA and TIMBERLAKE2004): Erianthemum ngamicum (Sprague) Danser (Loranthaceae), Plicosepalus kalachariensis (Schinz) Danser (Loranthaceae) and Viscum verrucosum Harv. (Viscaceae). Erianthemum ngamicum and V. verrucosum usually have high nitrogen affinity and parasitise high-nutrient hosts such as Acacia species (Pope et al. Reference POPE, POLHILL and MARTINS2006). While E. ngamicum and P. kalachariensis have leaves, V. verrucosum forms a leafless aerial shrub in host trees (Pope et al. Reference POPE, POLHILL and MARTINS2006).
METHODS
Plot measurements
In August 2011, we identified mistletoe infected and non-infected A. karroo trees in a 30-ha woodland. We established five plots (10 × 10 m) which each included three large canopy-dominant A. karroo trees infected by one of three mistletoe species (E. ngamicum, P. kalachariensis and V. verrucosum) and non-infected A. karroo trees. The plots were chosen with the following criteria estimated by observation in the field: (1) >90% dominance of the canopy by the mature trees of the target species, (2) significant (>50%) litter from mistletoes beneath infected trees, and (3) no evidence of recent disturbance such as logging or fire. We used mistletoes in canopy-dominant trees so that N-cycling properties of the soil would have been influenced by the same species for long periods prior to our sampling. In addition, we used large trees because they have a high mistletoe load (Ndagurwa et al. Reference NDAGURWA, MUNDY, DUBE and MLAMBO2012), and therefore likely greater litter effects. In each plot we measured key N-cycling characteristics: litterfall mass, foliar and litter N concentrations, litter lignin and polyphenol concentrations, soil nutrients and potential N mineralization, nitrification and nitrification fraction.
Litter sampling
In early August 2011, in each plot, we measured foliar N concentration by collecting foliage from mistletoes in each tree (n = 3). Viscum verrucosum does not have leaves; twigs <2 mm in diameter forming the shoot apex were collected. The samples were dried in a 60°C oven and ground before analysing for N. Litterfall was collected, beneath each infected tree (n = 3 in each plot or n = 15 total for each species), using four plastic buckets (each 0.25 m2 in collection area) installed in between the tree bole and canopy edge. Each bucket contained a fibreglass screen that trapped the litter and kept it off the bottom. Litter collectors were emptied every 2 wk during August–November 2011 and were composited for each tree. The mistletoe and Acacia litter components were separated visually, and then dried in an oven at 60°C and ground before analysis.
Soil sampling
In each plot, four cores in the top 20 cm layer were taken in the four cardinal directions (N, E, S, W) beneath each tree in between the tree bole and canopy edge. The core was separated into two samples representing organic and mineral horizons. However, the soil core generally included the entire organic horizon and a variable depth of the mineral soil. In the laboratory, soil cores were homogenized and large roots and rocks >2 mm were removed before air drying. We used the buried bag technique to measure net mineral N and net nitrate accumulation rates (Eno Reference ENO1960). At each sampling, we sealed 20 g of soil in polythene bags and buried the bags beneath each tree for 30 d. The same methods were used for non-infected trees. The soil samples were collected in the dry season, August to November.
Chemical analyses of soil
Soil N concentration was determined by the Kjeldahl method (Anderson & Ingram Reference ANDERSON and INGRAM1993). We analysed mineral N (NH4−N + NO3−N) by extracting 10 g fresh soil with 2 m KCl. Potential net N mineralization was calculated from the change in extractable N (NH4−N + NO3−N) from initial to final extractions. Net nitrate accumulation rate was calculated as the difference between initial NO3−N and incubated NO3−N. The nitrification fraction which shows the percentage of mineralized N that was nitrified was calculated as nitrification/mineralization. The net N mineralization and net nitrification was multiplied by the bulk density of the 0–10 cm soil layer to obtain results per unit area (Robertson et al. Reference ROBERTSON, SOLLINS, ELLIS, LAJTHA, Robertson, Bledsoe, Coleman and Sollins1999).
Chemical analyses of mistletoe litter
Mistletoe litter was dried at 60°C for 48 h, weighed and analysed for N concentration by the Kjeldahl method (Anderson & Ingram Reference ANDERSON and INGRAM1993). We analysed lignin concentration by the Van Soest (Reference VAN SOEST1963) procedure and folin-reactive phenols, total phenolics, were analysed using the Folin–Ciocalteu as described by Makkar (Reference MAKKAR2003). Condensed tannins (CT) were determined by extracting the sample (100 mg) with 20 ml of 50% aqueous methanol (1/1 methanol/water), adding the extract (1 ml) to n-butanol/HCL (5 ml, 95/5, v/v), placing the solution in a water-bath at 100°C for 1 h and reading absorbance at 550 nm (Reed et al. Reference REED, HORVATH, ALLEN and VAN SOEST1985). We used individual internal standards for each species.
Statistical analysis
All data were tested for normality before analysis (Zar Reference ZAR1984). Foliar N, litter N, condensed tannin, folin reactive phenols, lignin and lignin : N were tested for differences among treatments in one-way ANOVA (n = 15 for each treatment or n = 60 in total). We also compared variation in surface soil texture, pH, total nitrogen (N), phosphorus (P), potassium (K), calcium (Ca) and magnesium (Mg), ammonium N (NH4−N), nitrate N (NO3−N), potential N mineralization, nitrification and nitrification fraction among species using one-way ANOVA. Where F tests showed significant differences, means were compared using the Tukey multiple comparisons test (P <0.05). A repeated-measures ANOVA was used to test the effect of species, month of sampling, soil horizon and their interaction on ammonium N (NH4−N), nitrate N (NO3−N), potential N mineralization, nitrification and nitrification fraction. The month of sampling was specified as within-subjects factor, species and soil horizon as between-subjects factors and ammonium N (NH4−N), nitrate N (NO3−N), potential N mineralization, nitrification and nitrification fraction as measures. A repeated-measures ANOVA was also used to test the effect of species, month of sampling and their interaction on litterfall mass and litter N returns. The difference in litterfall between mistletoe and host was tested using a paired t-test. The relationships between soil N transformations and litter quality parameters were analysed by Pearson's correlation analysis. In all our tests α = 0.05. We conducted statistical tests using SPSS 16 for Windows (SPSS Inc., Chicago, IL USA).
RESULTS
Species chemical composition
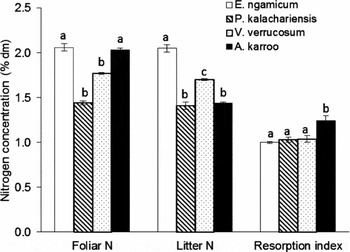
There was a significant difference in foliar N (F3, 56 = 556, P <0.001) and litter N (F3, 56 = 290, P <0.001) concentration among the study species. Foliar N was 1.4 and 1.2 times greater in E. ngamicum than in P. kalachariensis and V. verrucosum, respectively (Figure 1). Litter N concentration was 1.2–1.5 times greater in E. ngamicum than in the other species (Figure 1). The ratio of N concentration in foliage to that in litterfall is an index of resorption efficiency, and this index indicates that resorption was higher in A. karroo than in the mistletoes (P <0.05). The condensed tannin concentration in V. verrucosum was 2.8 times that in P. kalachariensis and A. karroo, and 3.8 times that in E. ngamicum (Table 1). However, between P. kalachariensis and A. karroo the condensed tannin concentration was not significantly different (P >0.05). Erianthemum ngamicum contained 2, 4 and 6 times more folin-reactive phenolics than P. kalachariensis, V. verrucosum and A. karroo, respectively (Table 1). The concentration of lignin and the lignin : N was >1.4 times greater in A. karroo than in the mistletoe species (Table 1).
Mean (± SE) concentrations of lignin (%), condensed tannins, CT (absorbance units A520 nm), folin reactive phenolics, FP (mg g−1 gallic acid equivalents) and the lignin : N ratio in the litter of Erianthemum ngamicum, Plicosepalus kalachariensis, Viscum verrucosum and Acacia karroo trees in a semi-arid savanna, south-west Zimbabwe. For each species, n = 15. Different superscripts (a, b, c, d) within each row differ significantly (Tukey's HSD, P <0.05).

Mean (± SE) foliar N, litter N and the resorption index or the ratio of fresh foliage : litter N concentration in mistletoes (Erianthemum ngamicum, Plicosepalus kalachariensis and Viscum verrucosum) and Acacia karroo in a semi-arid savanna, south-west Zimbabwe. For each species, n = 15. Different superscripts (a, b, c, d) within each column differ significantly (Tukey's HSD, P <0.05).

Litterfall mass and litter N
Litterfall significantly differed with species (F3, 56 = 97.9, P <0.001), month of sampling (F1, 56 = 35.0, P <0.001), and their interaction (F3, 56 = 12.3, P <0.001). The mistletoes were superior in terms of litter produced than the host trees (P <0.05). Mistletoe infection increased litter returns by 1.9, 2.8 and 1.4 times and litter N returns by 1.5, 2 and 1.5 times for A. karroo trees infected by E. ngamicum, P. kalachariensis and V. verrucosum, respectively (Table 2).
Mean (± SE) monthly litterfall mass and litter N beneath canopies of Acacia karroo trees infected by Erianthemum ngamicum, Plicosepalus kalachariensis and Viscum verrucosum and beneath non-infected Acacia karroo trees in a semi-arid savanna, southwest Zimbabwe. M, mistletoe; H, host. Litter was collected in the dry season (August–November). For each species, n = 15. Different superscripts (a, b) following means within a row and mistletoe species differ significantly, P <0.05.

Soil texture, pH, N, P, K, Ca and Mg
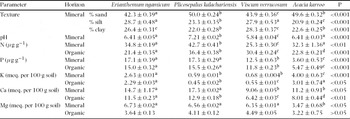
Our results showed that sand was the dominant fraction in soils of the study area, and the average texture across all plots was 45.4% sand, 26.5% silt and 25.6% clay (Table 3). Generally, we recorded more sand beneath trees infected by P. kalachariensis and non-infected A. karroo trees than beneath the other species (Table 3). Similarly, the clay and silt content varied among species with the highest values beneath trees infected by E. ngamicum and V. verrucosum, while the lowest was recorded beneath trees infected by P. kalachariensis and non-infected A. karroo, respectively. Soil pH significantly differed with species (P <0.01), and across all species the pH was <7.5. The concentration of N, P and Ca in the organic and mineral soil varied among species with greatest concentrations beneath trees infected by P. kalachariensis (Table 3). The concentration of K was higher beneath non-infected A. karroo, followed by trees infected by E. ngamicum, and least beneath trees infected by P. kalachariensis and V. verrucosum (Table 3). However, Mg concentration in the organic horizon did not vary among species (P >0.05). All measured parameters increased with soil depth.
Mean (± SE) surface soil texture, pH, total nitrogen (N), phosphorus (P), potassium (K), calcium (Ca) and magnesium (Mg) beneath canopies of Acacia karroo trees infected by Erianthemum ngamicum, Plicosepalus kalachariensis, Viscum verrucosum and beneath non-infected Acacia karroo trees in a semi-arid savanna, south-west Zimbabwe. For each species, n = 15. Different superscripts (a, b, c, d) within each row differ significantly (Tukey's HSD, P <0.05).

Mineral N
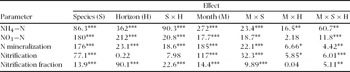
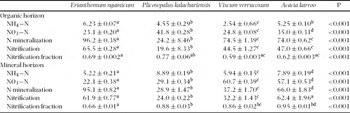
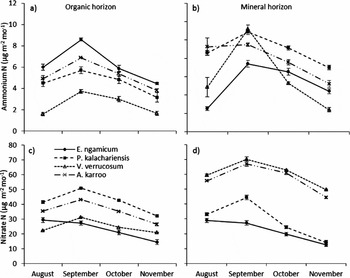
Mineral N was significantly affected by species, soil horizon, month of sampling and their interactions (Table 4). However, nitrate N was not affected by the interaction between month and soil horizon (P >0.05). In the organic soil, the NH4-N pool beneath trees infected by E. ngamicum was 1.2–2.5 times greater than beneath trees infected by P. kalachariensis, V. verrucosum and non-infected A. karroo trees (Table 5). The NH4-N pool in the mineral soil was 1.7 and 1.5 times greater beneath trees infected by P. kalachariensis than beneath trees infected by E. ngamicum and V. verrucosum, respectively (Table 5). Nitrate N varied significantly (P <0.05) among the species and was greatest beneath trees infected by P. kalachariensis and V. verrucosum in the organic and mineral horizon, respectively (Table 5). In the organic soil, NO3−N was 1.8 and 1.7 times greater beneath trees infected by P. kalachariensis than beneath trees infected by E. ngamicum and V. verrucosum, respectively (Table 5). In the mineral soil, NO3-N was 2.8 and 2 times greater beneath trees infected by V. verrucosum than beneath trees infected by E. ngamicum and P. kalachariensis, respectively (Table 5). Overall, the NH4−N and NO3−N pools were lower beneath mistletoe-infected trees than beneath non-infected A. karroo trees, and only marginally higher (~19%) when they were elevated beneath infected than non-infected trees. NH4−N and NO3−N beneath trees infected by E. ngamicum decreased with soil depth by 16% and 40%, respectively (Table 5). Beneath trees infected by P. kalachariensis, NH4−N increased by 95% while NO3−N decreased by 30%. The NH4−N and NO3−N pools increased with soil depth beneath trees infected by V. verrucosum (134% and 145%, respectively) and beneath non-infected A. karroo trees (50% and 63%, respectively) (Table 5). Both NH4−N and NO3−N in the soil attained maximum values in September before starting to decline at the onset of the rainy season (October/November) (Figure 2a–d).
Repeated-measures ANOVA testing the effects of species, month of sampling, soil horizon and their interactions on ammonium N (NH4−N), nitrate N (NO3−N), potential N mineralization, nitrification and nitrification fraction. *, P <0.05; **, P <0.01; ***, P <0.01.

Mean (± SE) soil parameter values (μg m−2 mo−1) measured in the organic and mineral soil horizon beneath canopies of Acacia karroo trees infected by Erianthemum ngamicum, Plicosepalus kalachariensis, Viscum verrucosum and beneath canopies of non-infected Acacia karroo trees in a semi-arid savanna, south-west Zimbabwe. For each species, n = 15. Different superscripts (a, b, c, d) within each row differ significantly (Tukey's HSD, P <0.05). NH4−N, ammonium N; NO3−N, nitrate N.

Dynamics of ammonium N (a, b) and nitrate N (c, d) measured in the organic and mineral soil beneath canopies of trees infected by Erianthemum ngamicum, Plicosepalus kalachariensis, Viscum verrucosum and beneath non-infected Acacia karroo trees in a semi-arid savanna, south-west Zimbabwe. Sampling was done in the dry season (August–November). For each species, n = 15. Symbols with no apparent error bars have error estimates too small to see or hidden by the symbol.

Potential N mineralization, nitrification and nitrification fraction
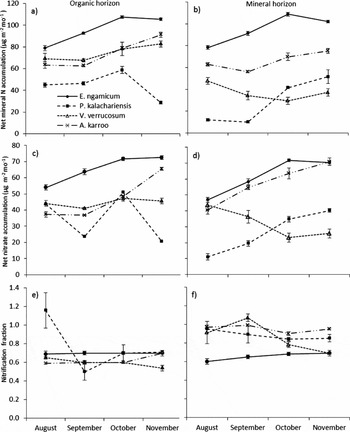
Potential N mineralization and nitrification fraction varied with species, soil horizon, month of sampling and their interactions (Table 4). Nitrification varied with species, month of sampling, and their interaction but did not vary with soil horizon and the species–horizon interaction (Table 4). The nitrification fraction also did not vary with the interaction between month of sampling and soil horizon (P >0.05). In the organic soil, N mineralization and nitrification rates were 1.8% and 40% greater beneath trees infected by E. ngamicum than non-infected A. karroo trees, respectively. For trees infected by P. kalachariensis, N mineralization and nitrification rates were 67.3% and 58% lower than beneath non-infected trees, respectively. N mineralization and nitrification were 0.7% greater and 5.3% lower beneath trees infected by V. verrucosum than beneath non-infected A. karroo trees, respectively (Table 5). In the mineral soil, N mineralization and nitrification rates were 44.1% greater and 0.8% lower beneath trees infected by E. ngamicum than beneath non-infected A. karroo trees, respectively (Table 5). N mineralization and nitrification were lower beneath trees infected by P. kalachariensis (56.2% and 61.5%, respectively) and V. verrucosum trees (43.6% and 48%, respectively) than beneath non-infected A. karroo trees (Table 5). N mineralization and nitrification decreased with soil depth beneath trees infected by E. ngamicum (1% and 5%, respectively) and non-infected A. karroo trees (50% and 28%, respectively). Beneath trees infected by P. kalachariensis, N mineralization and nitrification increased with soil depth by 20% and 22%, respectively (Table 5). N mineralization decreased by 11% while nitrification increased by 33% beneath non-infected A. karroo trees. The nitrification fraction significantly differed among species, and was greater in the mineral (range: 66–95%) than the organic soil (range: 59–77%). The nitrification fraction increased with soil depth by 14%, 46% and 53% beneath trees infected by P. kalachariensis and V. verrucosum and non-infected A. karroo trees, respectively (Table 5). However, beneath trees infected by E. ngamicum the nitrification fraction decreased with soil depth by 4% (Table 5). N mineralization and nitrification beneath E. ngamicum and A. karroo increased from August peaking in October (onset of the rainy season) while beneath V. verrucosum and P. kalachariensis the patterns were inconsistent in both horizons (Figure 3a–d). The nitrification fraction was highly variable between months beneath P. kalachariensis and V. verrucosum in the organic and mineral horizon, respectively (Figure 3e–f).
Dynamics of mineral N accumulation (a, b), net nitrate accumulation (c, d) and nitrification fraction (e, f) measured in the organic and mineral soil beneath canopies of Acacia karroo trees infected by Erianthemum ngamicum, Plicosepalus kalachariensis, Viscum verrucosum and beneath non-infected Acacia karroo trees in a semi-arid savanna, south-west Zimbabwe. Sampling was done in the dry season (August–November). For each species, n = 15. Symbols with no apparent error bars have error estimates too small to see or hidden by the symbol.

Relationships between litter and soil properties
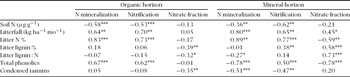
In both soil horizons, N mineralization and nitrification were negatively correlated to soil N but positively correlated to litter N and litter phenolics, except in the mineral soil were TP and N mineralization were negatively correlated (Table 6). N mineralization, nitrification and nitrate fraction were positively correlated to litterfall mass except the nitrate fraction in the organic soil (Table 6). In the mineral soil, N mineralization and nitrification had a negative correlation with condensed tannins (Table 6). While N mineralization in the mineral soils was negatively correlated to lignin : N, nitrification was positively correlated to lignin. The nitrification fraction was negatively correlated to lignin, lignin : N and condensed tannins in the organic soil while in the mineral soil the nitrification fraction was negatively correlated with both litter phenolics and litter N but positively correlated with litter lignin and lignin : N (Table 6).
Pearson product moment coefficients for correlations between soil N transformations (N mineralization, nitrification and nitrification fraction) and possible controlling variables beneath canopies of Acacia karroo trees infected by Erianthemum ngamicum, Plicosepalus kalachariensis, Viscum verrucosum and beneath canopies of non-infected Acacia karroo trees in a semi-arid savanna, south-west Zimbabwe. *, P <0.05; **, P <0.01; ***, P <0.01. Total phenolics expressed as mg g−1 gallic acid equivalents and Condensed tannins expressed as absorbance units A520 nm.

DISCUSSION
Species chemical composition
In general, mistletoes can attain greater nutrient concentrations than their hosts (Ehleringer & Marshall Reference EHLERINGER, MARSHALL, Press and Graves1995). However, a lower foliar N concentration was found in P. kalachariensis and V. verrucosum than in the host A. karroo, and is consistent with lower nutrient concentration in mistletoes than hosts reported by Bannister & Strong (Reference BANNISTER and STRONG2001). Mistletoes and parasitic plants in general, have low nutrient resorption efficiency (Pate et al. Reference PATE, TRUE and KUO1991, Quested et al. Reference QUESTED, PRESS, CALLAGHAN and CORNELISSEN2002), and thus retain nutrients in their tissues after senescence resulting in nutrient-rich litter. The N concentration in A. karroo litter, due to high nutrient resorption efficiency, was lower than in mistletoe litter (E. ngamicum and V. verrucosum). The concentration of secondary compounds also varied significantly among species, and the woody A. karroo was more lignified than the mistletoe species. This difference could be attributed to increased lignin in A. karroo as an anti-herbivory strategy (Cooper & Owen-Smith Reference COOPER and OWEN-SMITH1986). However, results of this study of higher concentrations of condensed tannins and folin reactive phenolics in mistletoes (V. verrucosum and E. ngamicum, respectively) contradict the notion that mistletoes have fewer chemical defences than their hosts (Watson Reference WATSON2009).
Litterfall
The mistletoes were superior in terms of litter produced than the host trees, with mistletoe infection increasing litter returns by 1.9, 2.8 and 1.4 times beneath trees infected by E. ngamicum, P. kalachariensis and V. verrucosum, respectively, compared with beneath non-infected A. karroo trees. Our results are greater than the 189% increase in litter-fall per tree reported in Australia for the mistletoe Amyema miquelii and its host Eucalyptus species (March Reference MARCH2007), which could be attributed to higher rates of leaf turnover in mistletoes than hosts (March & Watson Reference MARCH and WATSON2007). Accordingly, mistletoe infection increased N returns by a factor ranging between 1.5–2, which is greater than the 1.6 increase reported for the mistletoe A. miquelii in Australia (March & Watson Reference MARCH and WATSON2010) and the 1.4 increase reported with root hemiparasite infection (Quested et al. Reference QUESTED, CORNELISSEN, PRESS, CALLAGHAN, AERTS, TROSIEN, RIEMANN, GWYNN-JONES, KONDRATCHUK and JONASSON2003b). Therefore, as in other systems (March & Watson Reference MARCH and WATSON2007, Reference MARCH and WATSON2010), the resultant increased volumes of litter beneath infected trees may be contributing to higher nutrient returns in this system. However, Mlambo & Nyathi (2008) reported litterfall values 10 times greater than those reported in this study (range: 0.97–3.64 kg ha−1 mo−1). This could be attributed to differences in the pattern of leaf fall between A. karroo and Colophospermum mopane. In the Mlambo & Nyathi (2008) study, C. mopane leaf fall peaked from March to October which is longer than the period of peak leaf fall in this study, August to November. In addition, although we considered fire and logging, other disturbances such as herbivory and mechanical action of wind may have affected our litter sampling protocol. Thus, to increase accuracy of litterfall measurements in this system, we suggest that long-term observations in litter production which takes into consideration such factors be carried out. Further, due to high inter-annual variation in litter production and variability in contributions of the different litterfall fractions, litter production measurements should extend beyond a single year (Proctor Reference PROCTOR, Sutton, Chadwick and Whitmore1983).
Soil texture, pH, N, P, K, Ca and Mg
The soils in the study area were slightly alkaline in reaction (pH range: 5.8–7.2), which is in the range found previously (Mlambo et al. Reference MLAMBO, MWENJE and NYATHI2007). This could be related to the accumulation of basic cations which usually increases with lower rainfall as a result of the relatively higher evapotranspiration than precipitation in semi-arid environments (Sarah Reference SARAH2004). In addition, the high proportion of sand (45.4%) in the studied soils encourage leaching of the soil that in turn contributes to low pH values in arid environments (Sarah Reference SARAH2006). The present study found an increase in soil nutrient concentrations with mistletoe infection, with greatest concentrations of N, P and Ca measured beneath A. karroo trees infected by P. kalachariensis. This could be attributed to increased volumes of litter, and consequently nutrient returns beneath infected trees. Studies on annual root-parasitic herbs (Ameloot et al. Reference AMELOOT, VERLINDEN, BOECKX, VERHEYEN and HERMY2008, Quested et al. Reference QUESTED, PRESS and CALLAGHAN2003a) and perennial aerial hemiparasites (March Reference MARCH2007, March & Watson Reference MARCH and WATSON2007, Reference MARCH and WATSON2010) have also shown that parasitic plants substantially enhance nutrient returns to the soil through litter deposition. In addition to the ability of Acacia trees to fix atmospheric nitrogen, trees can generally influence nutrient cycling in the absence of above-ground litter inputs (Mlambo et al. Reference MLAMBO, NYATHI and MAPAURE2005). Therefore, the addition of organic matter through decomposition of mistletoe litter may represent an additional source of nutrients in this system.
Soil nutrients concentrations varied among trees infected by different mistletoe species suggesting that the effect of organic constituents on decomposition differ between tissues of different species (Schlesinger & Hasey Reference SCHLESINGER and HASEY1981), and so may decomposition and nutrient release rates. Apart from litterfall, N beneath trees may be elevated by other N redistribution mechanisms such as accumulation of N due to the washing of soil particles deposited by termites on tree trunks (Wezel et al. Reference WEZEL, RAJOT and HERBRIG2000). Mistletoes also attract other animal visitors, such as insects and birds, that alter overall nutrient inputs in their immediate vicinity (Watson Reference WATSON2009). Numerous bird droppings beneath mistletoe-infected trees were observed in the study site, and may be from visits from mistletoe-seed-dispersing birds that have a tendency to visit infected hosts more often than non-infected ones (Aukema & Martinez del Rio Reference AUKEMA and MARTINEZ DEL RIO2002). Although the chemical content of the droppings was not analysed, it can be suggested that they had an influence on the beneath-canopy surface-soil nutrient concentrations.
Mineral N
Generally, mineral N was lower beneath mistletoe-infected trees than beneath non-infected A. karroo trees. This suggests that enhanced N cycling may not be a generalized property of all mistletoes (March & Watson Reference MARCH and WATSON2010). However, in some instances the mineral N pool was higher (~20%) beneath mistletoe-infected trees than beneath non-infected A. karroo trees, which could have either been enlarged by increased mineralization of the parasitic litter of the previous years or the high K beneath non-infected A. karroo trees may have suppressed mineral N due to the antagonism between NH+4 and K at the soil exchange surfaces. Ameloot et al. (Reference AMELOOT, VERLINDEN, BOECKX, VERHEYEN and HERMY2008) also found greater soil N pools in grasslands parasitized by the root parasite Rhinanthus minor while Bardgett et al. (Reference BARDGETT, SMITH, SHIEL, PEACOCK, SIMKIN, QUIRK and HOBBS2006) reported greater mineral N availability in mesocosms infected with Rhinanthus minor. However, Bardgett et al. (Reference BARDGETT, SMITH, SHIEL, PEACOCK, SIMKIN, QUIRK and HOBBS2006) could not demonstrate that this was a direct consequence of the hemiparasitic litter. Our findings also seem to suggest that other factors, rather than mistletoe infection, may be more important in affecting mineral N pools in this system. NH4−N and NO3−N increased with soil depth beneath trees infected by V. verrucosum (134% and 145%, respectively) and non-infected A. karroo trees (50% and 63%, respectively) suggesting the presence of microbial N immobilization in the organic soil. Both NH4−N and NO3−N attained maximum values before the onset of the rainy season, possibly due to reduced nutrient leaching, when soil moisture was probably low. Hemiparasites may also reduce soil moisture as a result of their nutrient acquisition mechanism (Sala et al. Reference SALA, CARREY and CALLAWAY2001). Parasitic plants, by maintaining high transpiration rates, draw up nutrients and water from the host xylem (Bowie & Ward Reference BOWIE and WARD2004, Ehleringer & Marshall Reference EHLERINGER, MARSHALL, Press and Graves1995) and at the same time increase water uptake by the host plant. This process may lead to the reduction in soil moisture beneath infected hosts (Spasojevic & Suding Reference SPASOJEVIC and SUDING2011). In addition, we observed that nitrate N was the predominant form of inorganic N across all species, an indication of the absence of soil moisture suppression on nitrification (Paul & Clark Reference PAUL and CLARK1989).
Potential N mineralization and nitrification
In the organic soil, N mineralization and nitrification rates were 1.8% and 40% greater beneath trees infected by E. ngamicum than non-infected A. karroo trees, respectively. This difference may be attributed to enriched E. ngamicum litter, and such litter results in high rates of decomposition and N mineralization (Melillo et al. Reference MELILLO, ABER and MURATORE1982). However, N mineralization rates reported here are lower than the 105% and 174% increase reported with root hemiparasite infection in plots with 30 and 60 parasites m−2, respectively (Bardgett et al. Reference BARDGETT, SMITH, SHIEL, PEACOCK, SIMKIN, QUIRK and HOBBS2006). In the mineral soil, N mineralization and nitrification were lower beneath trees infected by P. kalachariensis (56.2% and 61.5%, respectively) and V. verrucosum trees (43.6% and 48%, respectively) than beneath non-infected A. karroo trees. This might suggest slower nutrient release from P. kalachariensis and V. verrucosum litter compared with A. karroo litter. However, A. karroo litter contained more lignin than mistletoe litter. Soils that have alkaline pH, as in this study, generally support high oxidative enzyme potentials (Stursova et al. Reference STURSOVA, CRENSHAW and SINSABAUGH2006), which favour the breakdown of recalcitrant organic compounds such as contained in A. karroo litter. Thus, decomposition and nutrient release in A. karroo litter was possibly not limited by the lignin content.
N mineralization and nitrification decreased with soil depth beneath trees infected by E. ngamicum (1% and 5%, respectively) and non-infected A. karroo trees (50% and 28%, respectively). This suggests that either the N in the mineral soil is more labile than the N in the organic soil, or microbial N immobilization levels are lower in the mineral soil because of lower labile carbon availability. However, beneath trees infected by P. kalachariensis, N mineralization and nitrification increased with soil depth by 20% and 22%, respectively. The nitrification fraction also increased with soil depth beneath trees infected by P. kalachariensis (14%) and V. verrucosum (46%) and beneath non-infected A. karroo (53%) trees. This could probably be due to increase in substrate quantity with soil depth since the amount of carbon supplied by plants can determine the rate of mineral N accumulation (Knops et al. Reference KNOPS, BRADLEY and WEDIN2002), mainly by supporting soil microbial populations (Wardle Reference WARDLE1992). The increase in N mineralization and nitrification in October (onset of the rainy season) suggest that moisture was limiting, and possibly affected the activity of nitrifying bacteria through dehydration (Stark & Firestone Reference STARK and FIRESTONE1995). Xu et al. (Reference XU, LI, WANG, CHEN and CHENG2007) also reported that soil N transformation was usually sensitive to soil moisture in arid and semi-arid ecosystems.
Relationships between litter and soil properties
Soil N transformations were positively correlated to litterfall and litter N concentration, which is consistent with findings by Hobbie & Gough (Reference HOBBIE and GOUGH2002). This is because high litter N results in faster decomposition rates (Scott & Binkley Reference SCOTT and BINKLEY1997) and nutrient release rates (Berg Reference BERG1986), and so mineralization and nitrification rates. However, N mineralization was negatively correlated to lignin : N indicating the negative effects of lignin on N cycling (Hattenschwiler & Vitousek Reference HÄTTENSCHWILER and VITOUSEK2000, Scott & Binkley Reference SCOTT and BINKLEY1997). High litter lignin and/or polyphenol concentration may reduce litter decay rates by either toxic effects on micro-organisms or by retarding microbial breakdown of organic matter (Hattenschwiler & Vitousek Reference HÄTTENSCHWILER and VITOUSEK2000). In addition, the nitrification fraction was also negatively correlated to lignin and lignin : N indicating that the amount of mineralized N that was nitrified was strongly controlled by the amount of lignin in litter.
Soil N concentration was negatively correlated to soil N transformations, which may be attributed to the deposition of poor-quality litter as soil N increases (van der Krift & Berendse Reference VAN DER KRIFT and BERENDSE2001). Scott & Binkley (1997) found the effects of lignin on N mineralization to be similar between the organic and mineral layers in North American forest sites. Conversely, we found that the negative effects of lignin on N cycling were only significant in the mineral soil possibly due to a decline in substrate quality with soil depth (Mlambo et al. Reference MLAMBO, MWENJE and NYATHI2007). In the mineral soil, condensed tannin concentrations were negatively correlated with soil N transformations probably due to the inhibitory role of tannins in decomposition processes (Hattenschwiler & Vitousek Reference HÄTTENSCHWILER and VITOUSEK2000). Tannins reduce rates of mineralization or decomposition by affecting the activity of enzymes (Joanisse et al. Reference JOANISSE, BRADLEY, PRESTON and MUNSON2007) or through interactions with mineral soil fractions (Horner et al. Reference HORNER, GOSZ and CATES1988). In addition, tannin-related phenolic compounds can interact with nitrite, produced during nitrification, to form more recalcitrant organic forms resistant to decomposition (El Azhar et al. Reference EL AZHAR, VERHE, PROOT, SANDRA and VERSTRAETE1986).
Previous studies have shown that polyphenol–protein complexes formed during senescence or in the soil are resistant to most decomposing organisms (Gallardo & Merino Reference GALLARDO and MERINO1992, Hattenschwiler & Vitousek Reference HÄTTENSCHWILER and VITOUSEK2000), and thus reduce rates of N mineralization. This could possibly explain the negative correlation between folin-reactive phenolics and both N mineralization and nitrification fraction. However, in the organic soil horizon, N transformations were positively correlated with litter phenolics, in response to the high N mineralization, nitrification and phenolics associated with E. ngamicum. This could possibly be attributed to the influence of polyphenol quality rather than quantity since the resistance of polyphenol–protein complexes to decomposition depends on the specific quality of polyphenols (Handley Reference HANDLEY1961). Therefore the compositional effect of the phenolics may have been independent from the concentrations. However, most evidence on the effects of phenolic compounds on N-cycling processes was obtained largely from artificial experiments (Hattenschwiler & Vitousek Reference HÄTTENSCHWILER and VITOUSEK2000). Although, systematic measurements of quantitative and qualitative polyphenol inputs were not done, we provide data from a natural setting, and could argue that general conclusions relevant to natural conditions can be drawn from this study.
Implications
The enhanced cycling of N in the presence of mistletoe litter could alter the spatial distribution of nutrients leading to shifts in species abundance and diversity, while an increase in nutrients may enable the co-existence of more nutrient-demanding plant species. For example, the presence of hemiparasites has been found to enhance plant productivity, species diversity and microbial activity and cause a shift in microbial composition (Bardgett et al. Reference BARDGETT, SMITH, SHIEL, PEACOCK, SIMKIN, QUIRK and HOBBS2006, March Reference MARCH2007, Quested et al. Reference QUESTED, PRESS and CALLAGHAN2003a). Thus, based on our findings mistletoe infection may have consequences for plant productivity, species composition and microbial activity in the semi-arid savanna. There remain many exciting questions on community-level effects of mistletoe infection (see Watson Reference WATSON2009), and this suggests further research directions in order to understand the broader role of mistletoes in the savanna.
Conclusions
As reported for other ecosystems (Ameloot et al. Reference AMELOOT, VERLINDEN, BOECKX, VERHEYEN and HERMY2008, March & Watson Reference MARCH and WATSON2007, Reference MARCH and WATSON2010; Quested et al. Reference QUESTED, PRESS, CALLAGHAN and CORNELISSEN2002, Reference QUESTED, PRESS and CALLAGHAN2003b; Spasojevic & Suding Reference SPASOJEVIC and SUDING2011), our results showed that mistletoes, especially E. ngamicum, can influence N cycling in the savanna. Further, the effects of mistletoes on N cycling are species-specific as our results showed independent variation in N cycling properties among species, and litter quality was the main factor causing differences in N cycling among the study species. However, results of this study of measurements made in small single-species plots cannot be used to determine the characteristics of the N cycle in stands where mistletoe litter mixtures occur. Compared with single-species litters, mixtures of litters from different plant species often show different decomposition and nutrient release patterns (Wardle et al. Reference WARDLE, BONNER and NICHOLSON1997). Thus, effects of litter mixing in the soil may not be obvious in single-species stands, and suggest possible future research directions.
ACKNOWLEDGEMENTS
The study was supported by the National University of Science and Technology Research Board (grant RB/11/10). The authors are grateful to Alford Magwizi for his assistance in the field and to the anonymous reviewers for their attention to the script.