Introduction
Changes of patterns of atmospheric circulation, both short-term and long-term, have marked effects on the chemical composition of the snowpack at glaciers. Release of ions during the early stages of snowmelt can have detrimental ecological and environmental effects. By measuring the total seasonal input and output of a specific ion, it is possible to assess the drainage time for meltwater from different parts of the glacier, including the upper parts of the accumulation area which are snow-covered in all seasons. As part of a large-scale research programme, the Okstindan Glacier Project, studies of the effects of changing climatic conditions on the composition of the snowpack and meltwater emerging from the Norwegian glacier Austre Okstindbreen are being undertaken. Here, we report the results of part of the programme which aimed to determine large-scale (catchment) ionic balances, rather than dealing with detailed single-site observations. The study made use of NaCl as a conservative, natural tracer of the movement of snow meltwater through the glacio-hydrological system. We report the total input/output relations of Na+ and, particularly, Cl– in 1995. The NaCl mass balance was used to determine rates of water movement through the drainage system at Austre Okstindbreen.
The ionic sources in a glacierized catchment are supplied as either wet or dry deposition in snow or rain which falls within the catchment, or they originate from subsurface chemical weathering. Water discharging from glaciers includes ice meltwater, snow meltwater and liquid precipitation. The chemical composition of the water varies as the proportions of these components change through the melt season (May–September).
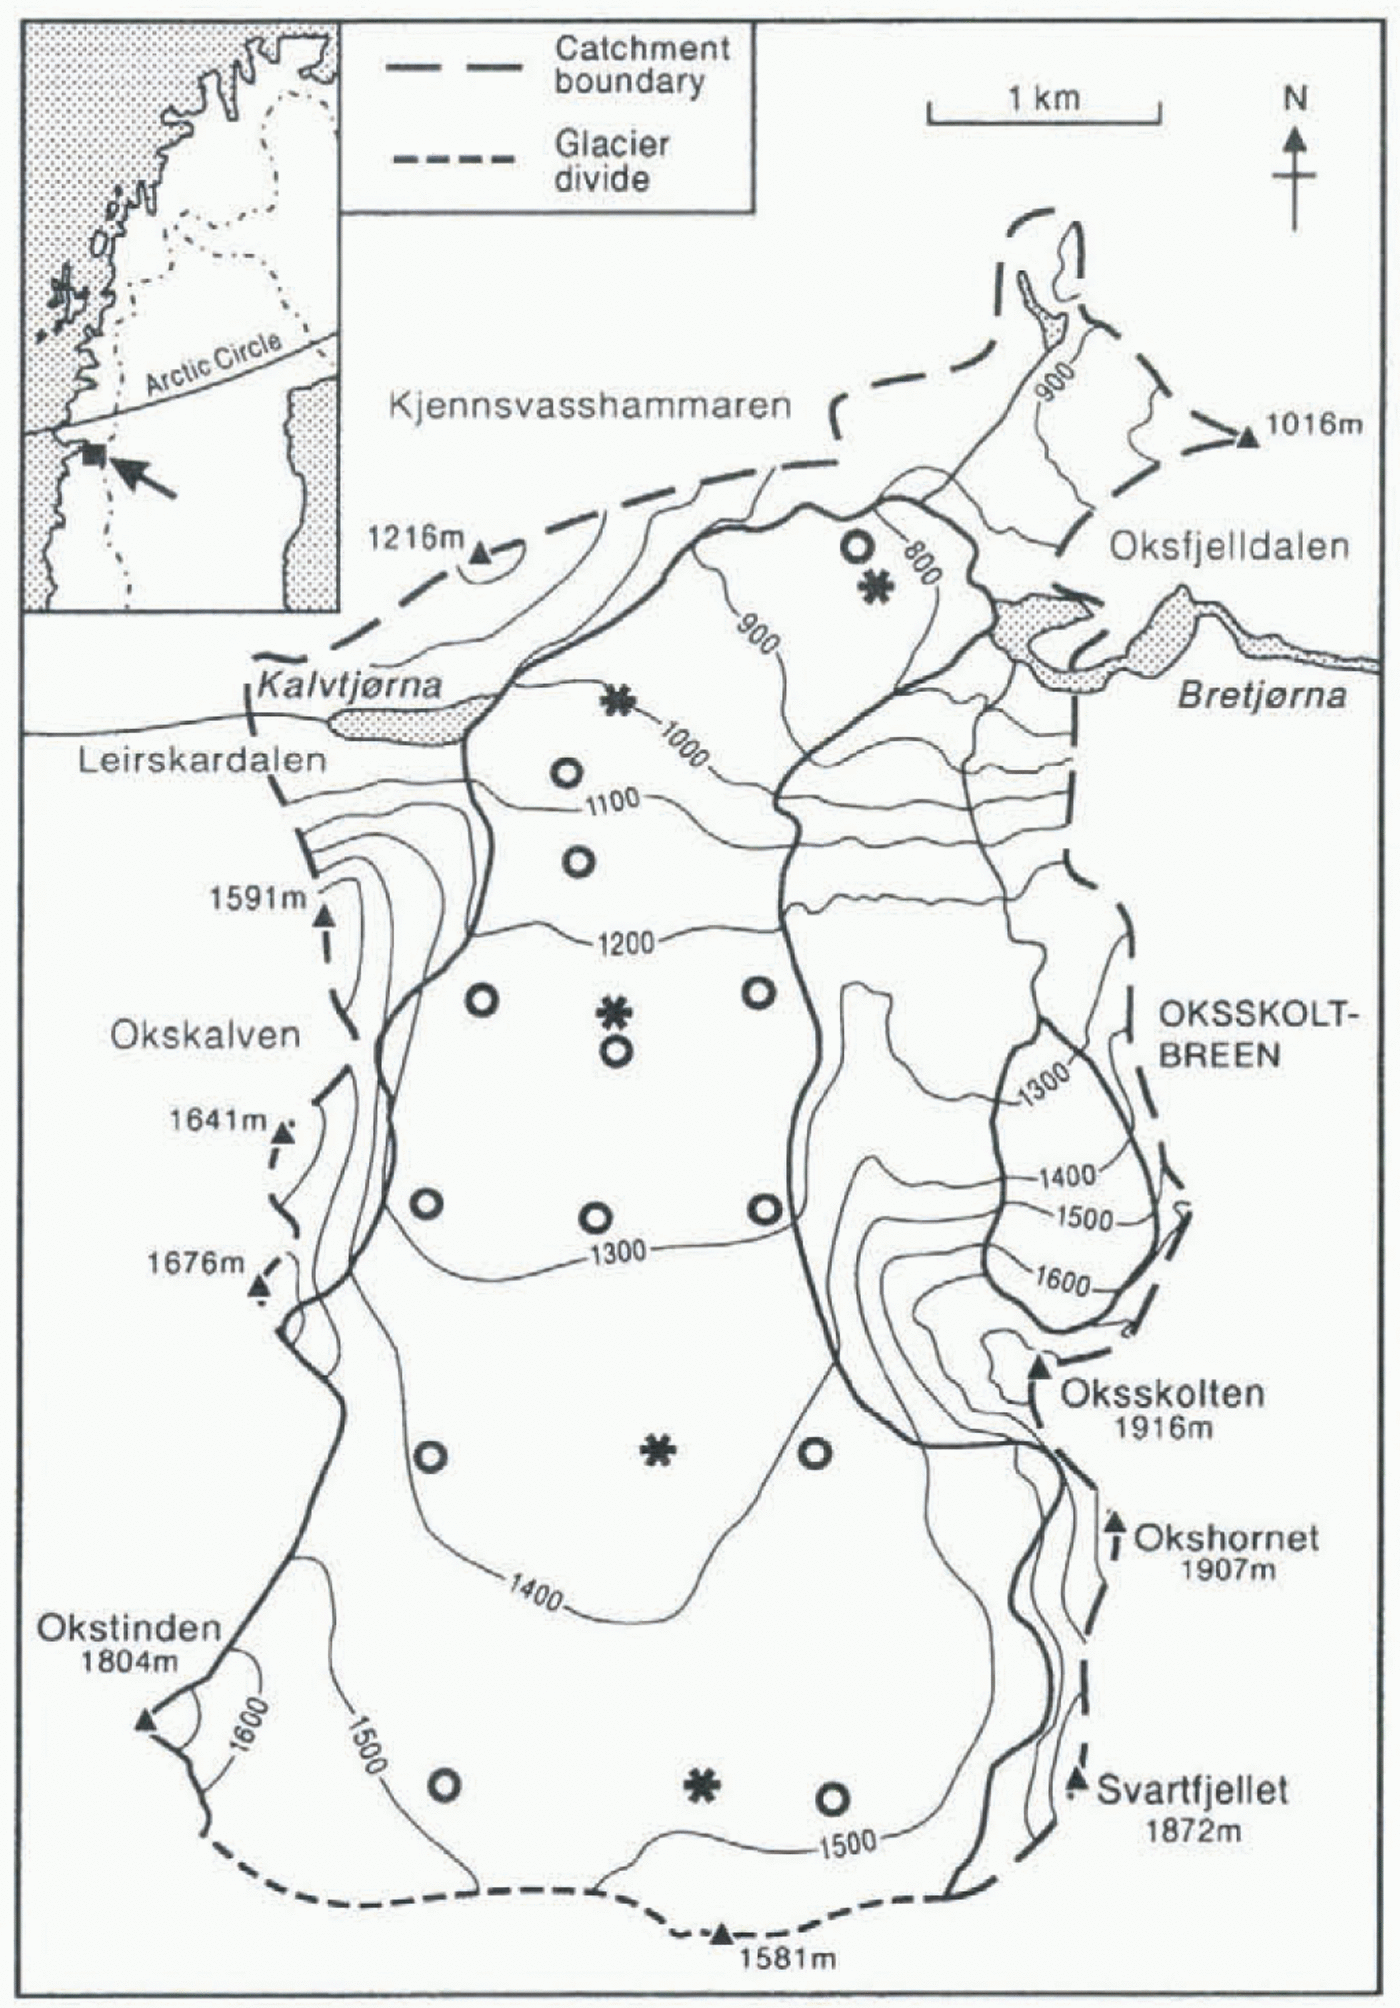
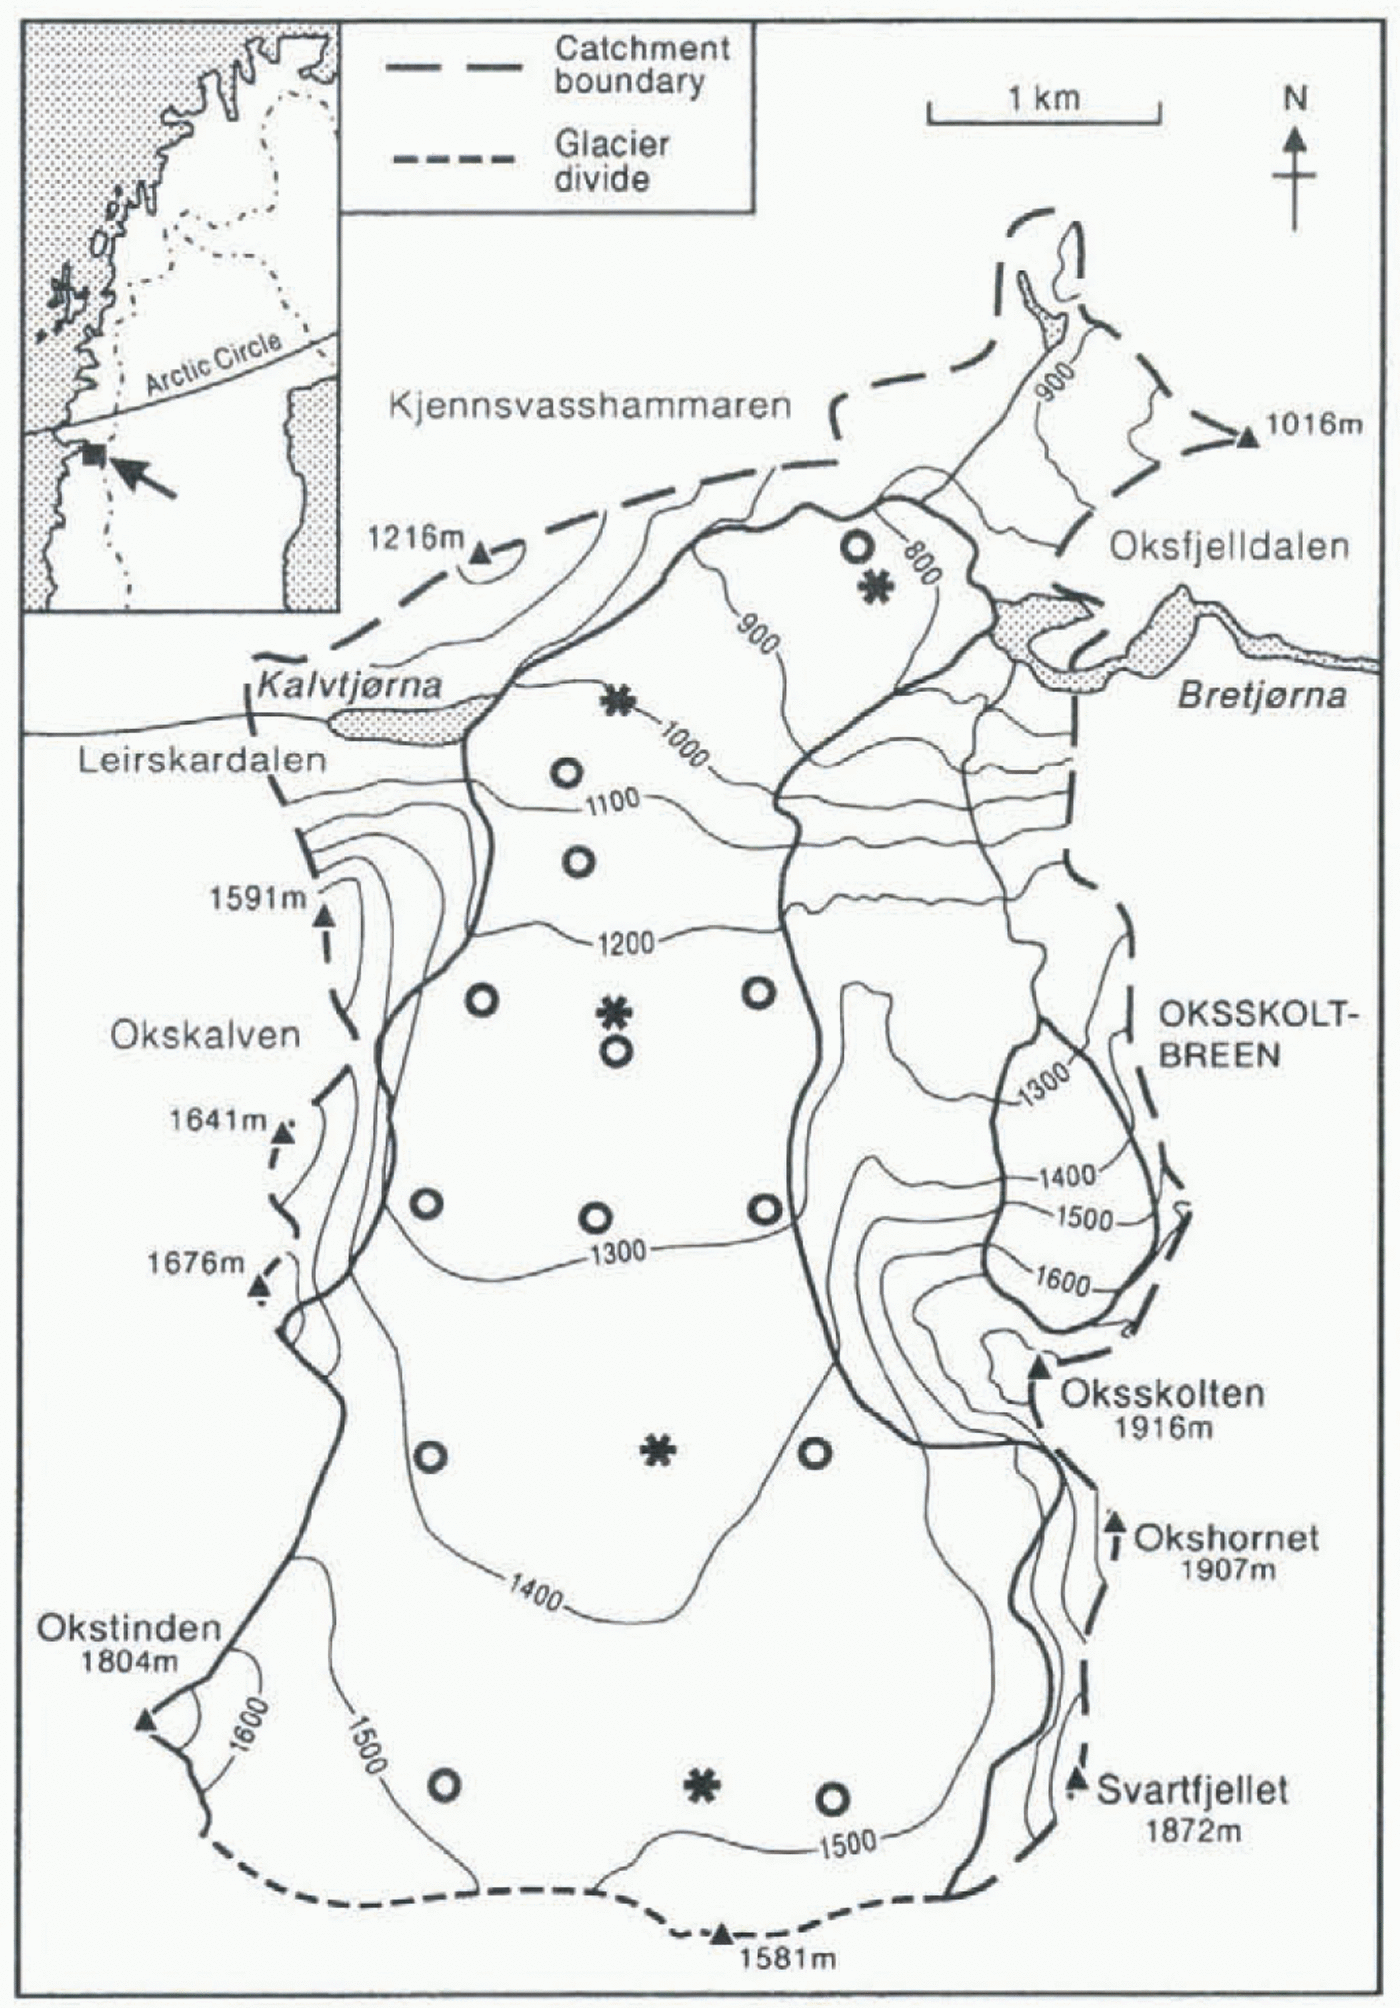
In 1995, the total seasonal balances of the inputs and outputs of seven ions were determined at Austre Okstindbreen, the largest glacier (14 km2) of the Okstindan area, Norway, at 66°01’ N, 14°18’ E, 40 km south of the Arctic Circle (Fig. 1). More than 1400 snow and water samples were collected from the 22.6 km2 catchment, which includes a second, much smaller glacier, Oksskoltbreen (1km2). The total glacierized area is 66% of the catchment. Nearly all the meltwater from above 1200 m drains in and under Austre Okstindbreen. The mean equilibrium-line altitude at the glacier is around 1250 m.
The proximity of the Okstindan area to the Atlantic Ocean results in high sea-salt concentrations (Na+, Cl–) in precipitation there. As it is believed that no chloride ions are released from subglacial chemical weathering of a catchment which consists of garnetiferous mica schist of Caledonian age, the annual (October–September) input of this ion should equal the total output draining from the catchment.
Sample Collection And Estimated Errors
Ionic inputs from winter (October 1994–May 1995) precipitation, and the passage of ions through the snowpack during the following summer, were determined by analyses of 700 snow samples collected from five pits between March and August 1995. The pits were located on the glacier at 825, 1000, 1230, 1350 and 1470 m (Fig. 1). During the pre-melt phase in late April–early May, snow samples were collected from the five pits and from 13 cores, in order to obtain data relating to the total winter chemical input to the whole catchment. All pits and cores included the full depth of the winter-accumulated snowpack at the sample site. On resampling at a site, snow which had fallen or drifted into the pit was removed, and then the pit was extended by about I m laterally before samples were collected, to ensure that the samples were uncontaminated. Ionic variations within the snowpack at Austre Okstindbreen differ relatively little over short distances (Raben and Theakstone, 1993), and the error
The glacier Austre Okstindbreen and the catchment within which it lies. The positions of snow pits (asterisks) and cores (circles) used in 1995 are marked.
caused by resampling at about 1 m from the site used during the preceding visit is considered to have a minor effect (<10%) on the calculated total quantity of ions in a 6–7 m deep snowpack. During sampling, the easily identifiable 1994 summer surface was used as a reference horizon, and the depth/density profile above it was recorded. The estimated error of the calculated water-equivalent depth of the snowpack is <5%; errors of calculated water loss from the pack are ±3%. Temporal patterns of changing water-equivalent thickness of the pack at the 1350 m site were similar to those at the 1470 m pit, which represents a large proportion of the catchment area.
The total input of ions was calculated from the premelt sample data and the winter accumulation on the glacier, which was measured as part of an annual mass-balance study (Knudsen, 1995). A 10 or 20 cm sampling interval was used at each site, to facilitate investigations of ionic elution throughout the melt season. The changing thickness, liquid water content, temperature and density of the pack were monitored throughout the entire field season, permitting the drainage of ions to be related to lateral movement of meltwater in the snowpack. Summer precipitation (mostly rain) was sampled at a weather station within the catchment, at 850 m.
In order to determine the ionic output from the catchment, 700 water samples were collected from the only river draining it. Sample collection started on the first day of drainage, 26 May, and continued until 16 August. Between two and twelve samples were taken each day by an automatic sampler. Glacier river level was recorded from late
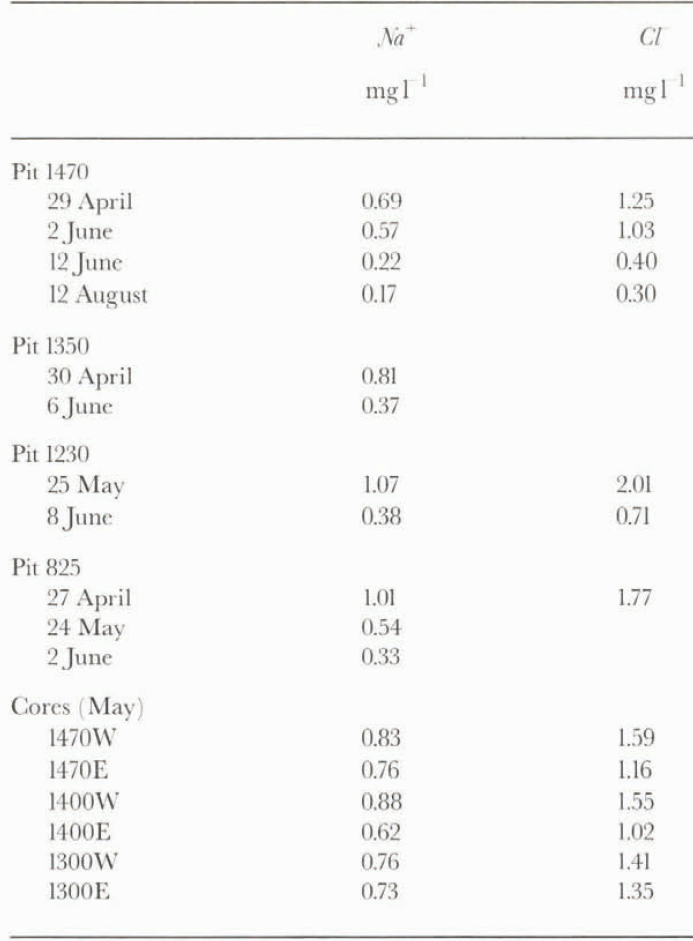
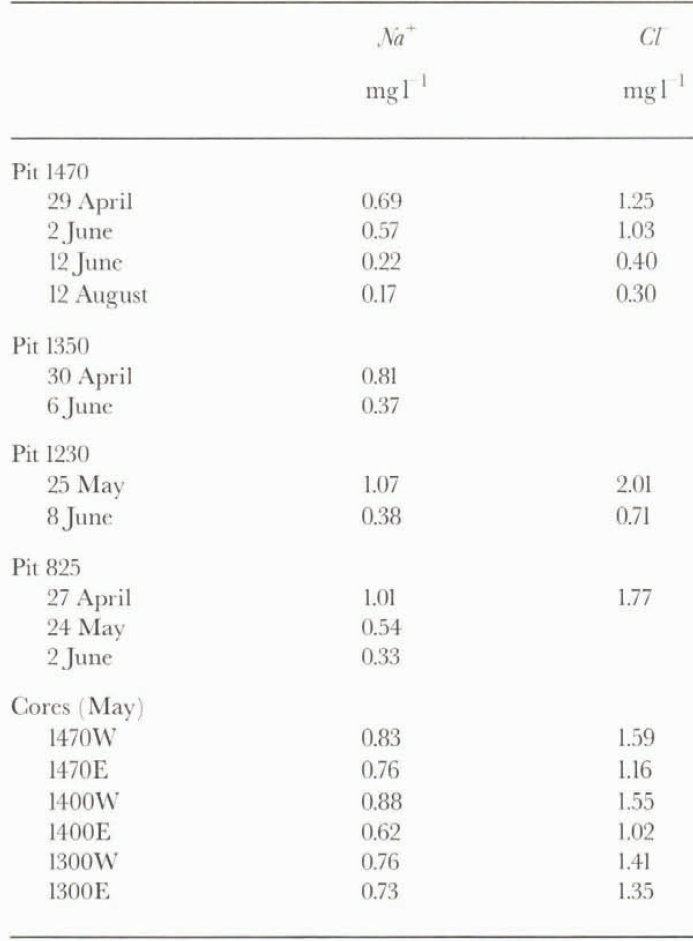
Mean concentrations of Na+ and C1– in four pits and the six cores from the highest part of the Austre Okstindbreen catchment in 1995. (Cl– concentrations were not determined on some occasions.) Values are not corrected for precipitation inputs between 29 April and 12 August
May until late September, and discharge was calculated from an established rating curve; discharge values in general are believed to be correct to ±5%, but to only ±10% during the first 2–3 weeks of river flow, when ice jams gave rise to elevated water levels.
All samples were analyzed for Na+ by Atomic Absorption Spectrophotometry (AAS), and some 220 snow/rain samples and 250 meltwater samples were analyzsed for Cl– by ion chromatography. Meltwater samples were filtered, to remove particles finer than 0.45 mm, but very fine particles which contained Na+ would be included in the AAS data. Re-runs of a number of samples showed an error of ±5% for Na+, the detection limit being 0.001 mgl–1. For Cl– the error was ±5% with a detection limit of 0.05 mg1–1.
Ionic Inputs And Drainage Of Ions
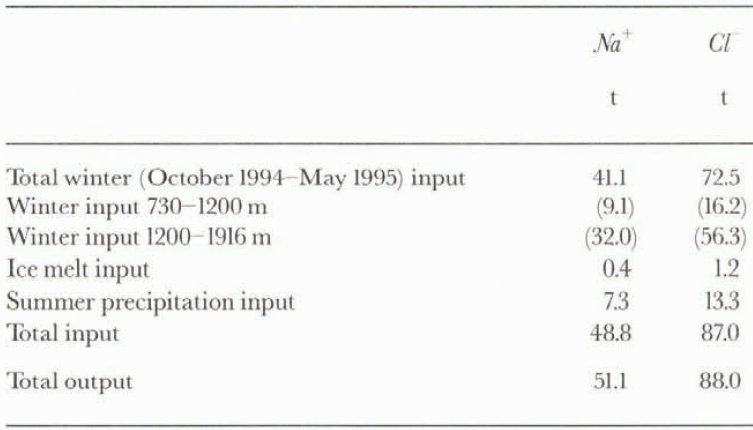
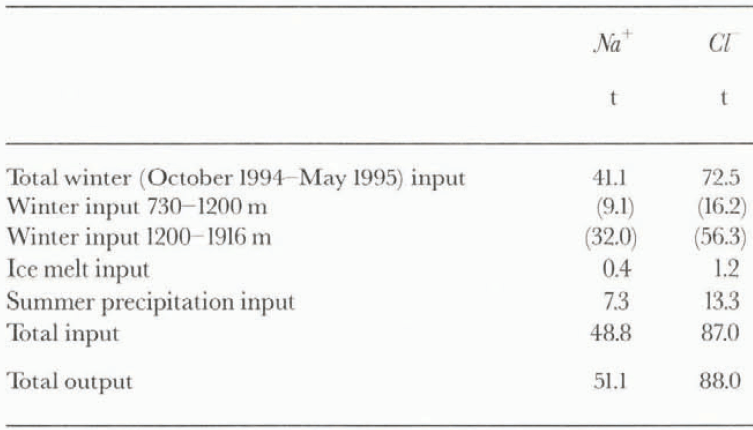
The temperature of the snowpack at all sites was below 0°C when samples were collected in late April (table 1); no meltwater had drained from the pack. Volume calculations of the total winter input of ions to the catchment were based on the measured winter accumulation on the glacier (Knudsen, 1995); it was assumed that an equivalent amount had fallen on the non-glacierized area. The calculated total winter input of C1– was 72.5 t (table 2).
Precipitation in early May fell as snow above 1000 m, but as rain at lower elevations, and some meltwater and ions drained from the snowpack at pit 825 (table 1). Snow fell over most of the catchment during a colder period which followed (9–19 May). Melting then began, averaging 5 cm w.e. d–1 between 23 May and 7 June. The snowpack was isothermal (0°C) at 1470 and 1350 m, on 2 and 6 June
Ionic inputs to, and outputs from, the Austre Okstindhreen catchment, 1995. Values in brackets indicate the inputs within different altitudinal zones
respectively. The thickness of the pack at pit 1470 increased by 10%, to 3.45 m w.e., between 29 April and 2 June, but the mean concentrations of Na+ and Cl– decreased by 17% and 18%, respectively (table 1). The liquid water content in the upper 3.5 m of the pack on 2 June was 3–16%.
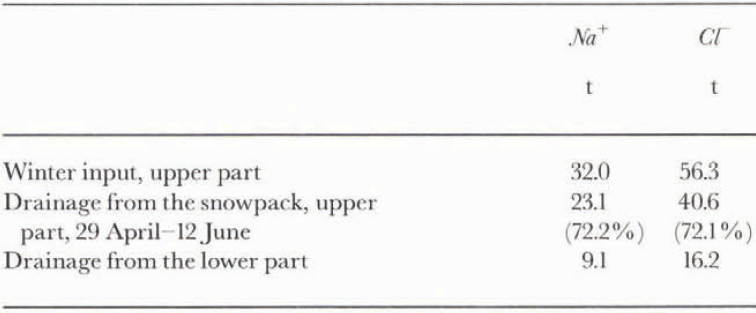
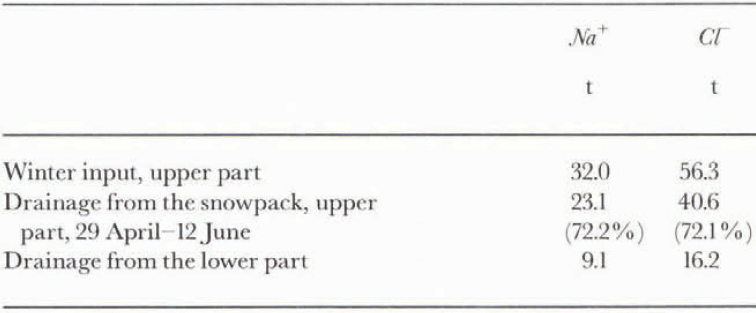
On 12 June, 12% of the 2 June snowpack at pit 1470 had melted (0.41 m w.e., or 6.6 x 10⁶ m3 water), but 72% of the ions which had accumulated at the site by that date had drained into the underlying firn (table 3). 40.6 t of Cl–, equivalent to 56% of the total Cl– accumulated within the catchment during winter, had passed out of the snow on the upper part (1200–1916 m). This loss indicated an average concentration of C1– in the meltwater of 6.2 mg l–1, or five times higher than the average concentration in the snowpack; this agrees well with research elsewhere (Davies and others, 1987).
Unsettled weather in July brought both rain and snow, which supplied Na+ and C1– to the pack. Precipitation totalled 0.55 m between 12 June and 12 August. The average concentration of ions in the snow remaining at pit 1470 on 12 August was only about 25% lower than that of 12 June (table 1), but ionic balance calculations suggested that 80–90% of the winter-accumulated ions had drained from the snow. This is in good agreement with the results of previous studies at the glacier, in 1991 (Raben and Theakstone, 1993).
Ice melt contributed a very minor amount (<2%) to the total input of ions to the glacier (table 2). Summer precipitation sampled at the weather station at 850 m contained much lower concentrations of Na+ and Cl– than those present in the winter snow: typical concentrations were only 45% of those in the snow. Thus, despite the substantial precipitation of snow and rain in the catchment during the summer, the season’s input of ions was not high in relation to the winter input
Input and drainage of ions from the upper (1200–1916 m) and lower (730–1200 m) parts of the Austre Okstindbreen catchment in 1995. (Percentages in brackets)
(table 2). The output of ions from the glacier was dominated by those originating from winter precipitation.
The total input of Cl– from winter precipitation, summer precipitation and ice melt was 87 t (table 2). Of this, 40.6 t had been lost from the upper parts of the catchment by 12 June (table 3), i.e. 47% of the whole seasonal Cl– input was removed with the first 12% of meltwater.
Output Of Ions From The Catchment
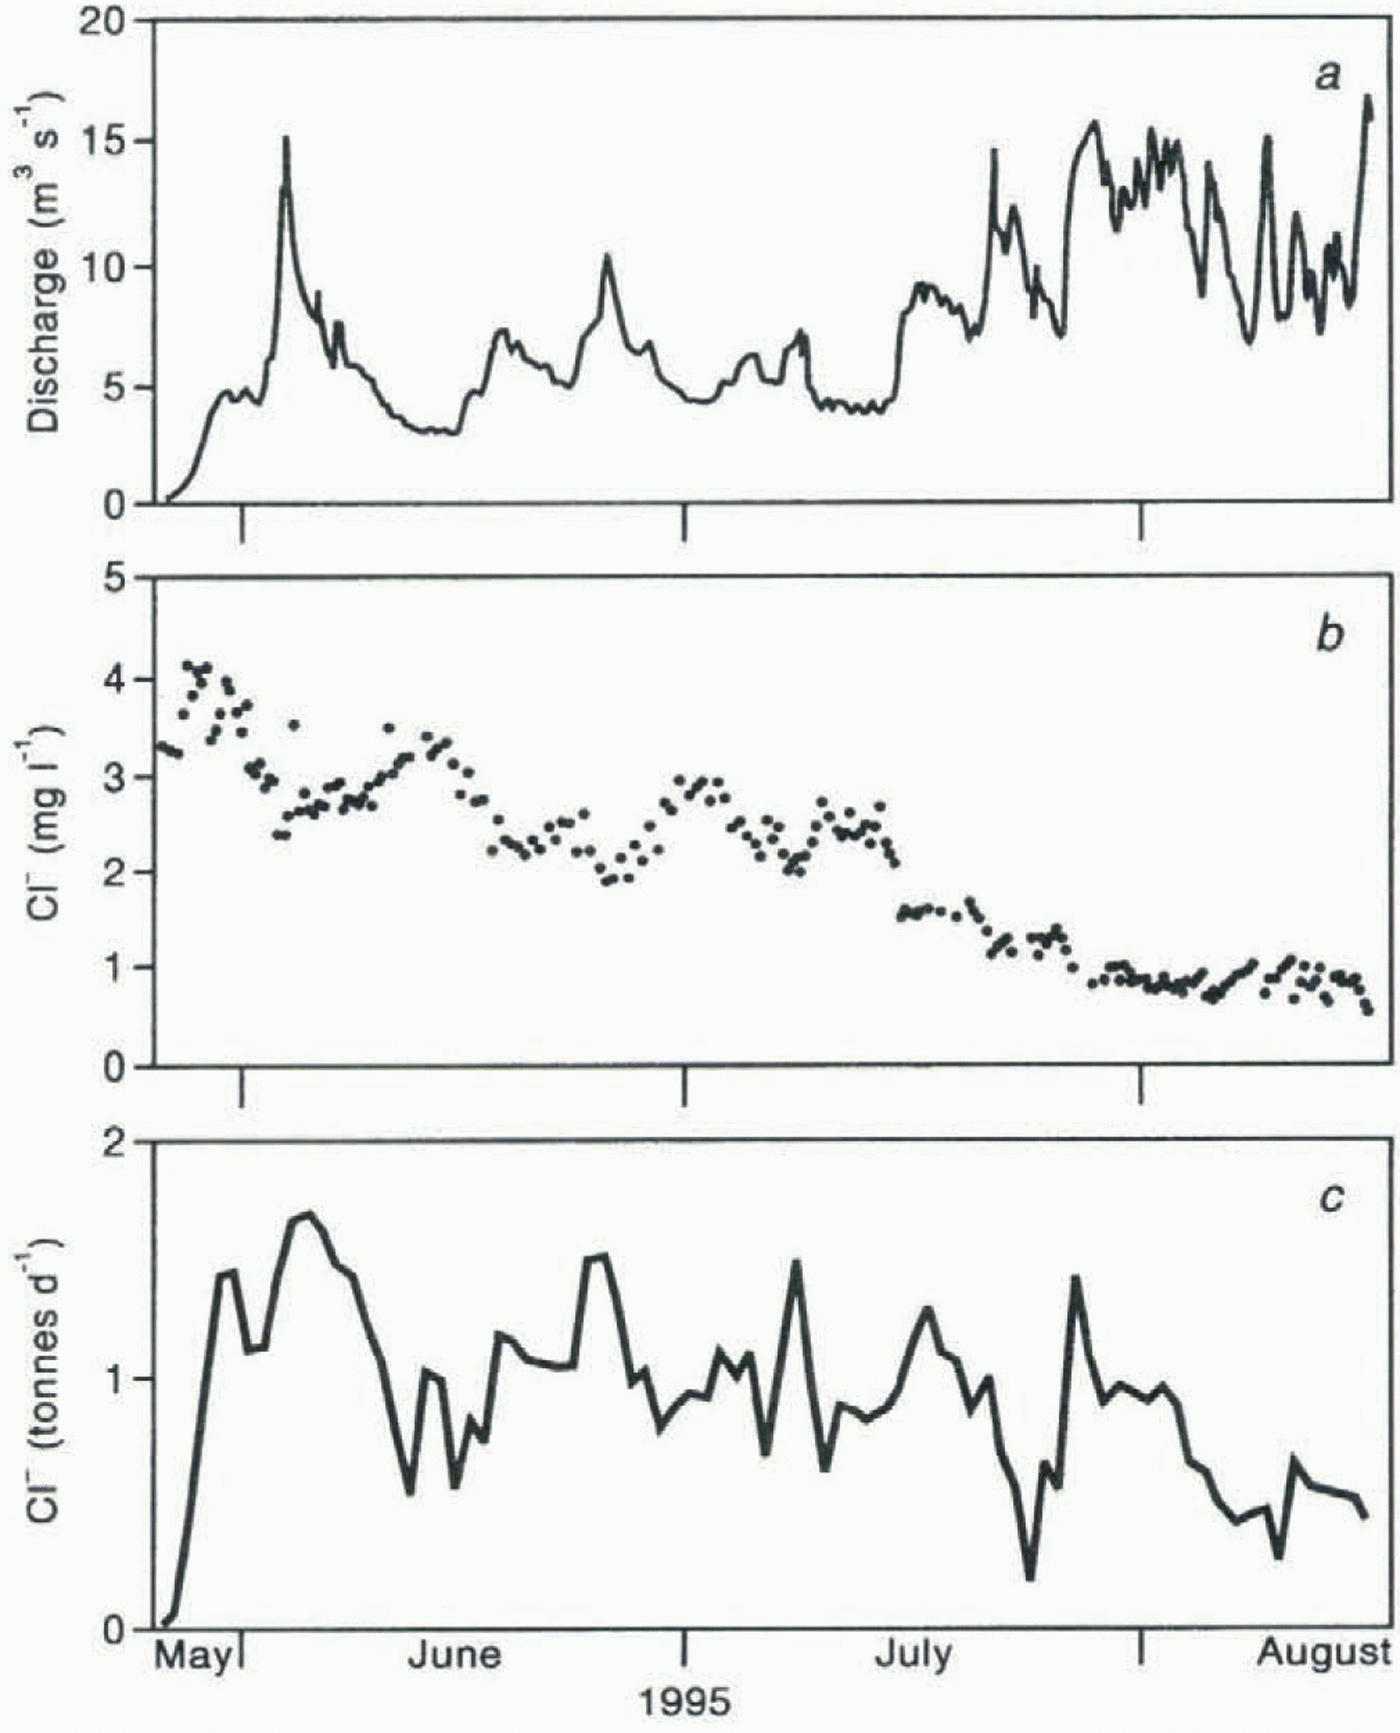
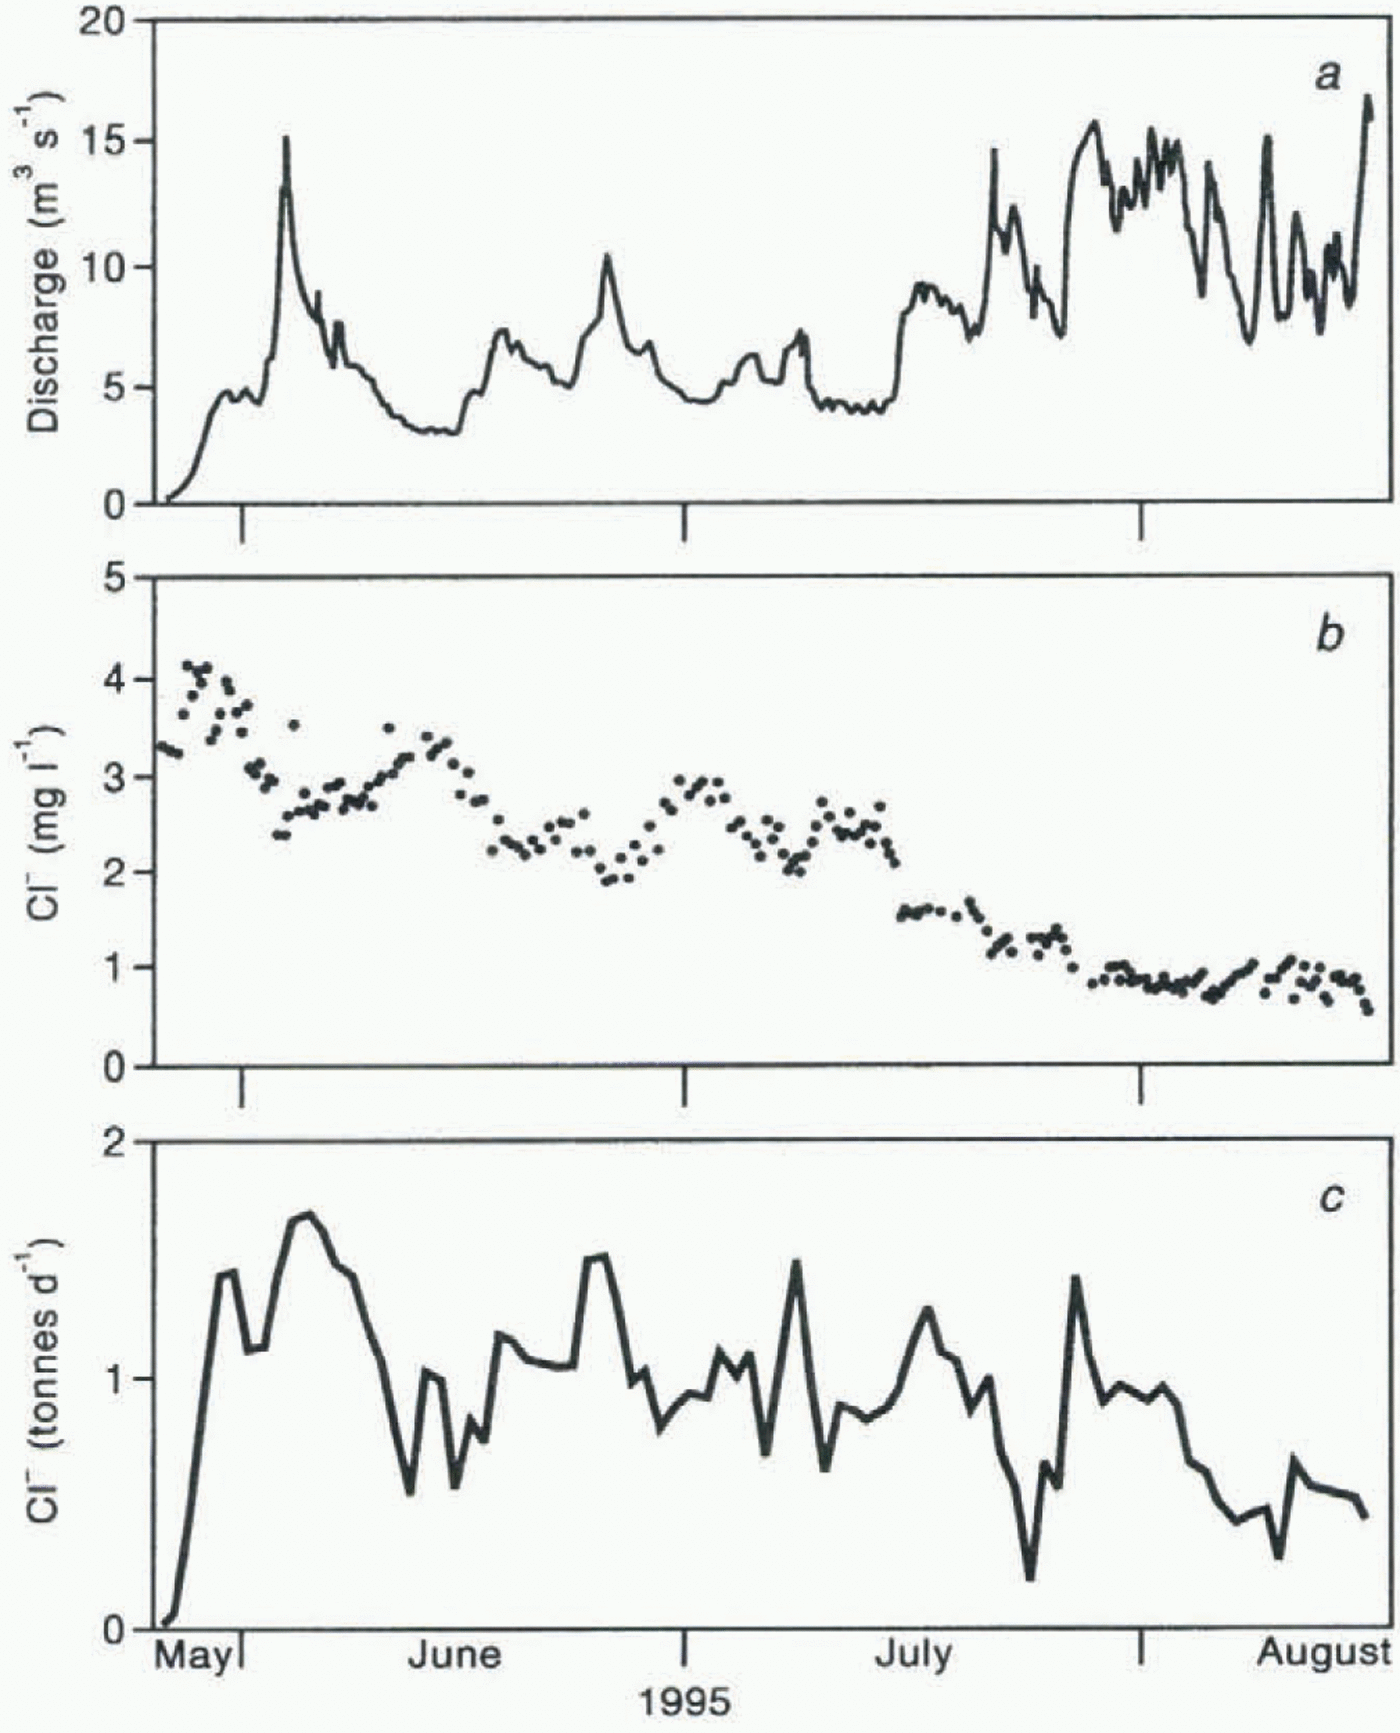
Drainage of water from the glacier began on 26 May. During the following days discharge increased, and on 3 June, as 78 mm of rain fell over the catchment, it rose to 15 m3 s–1 (Fig. 2a). Concentrations of Cl– and Na+ in the first meltwater draining from the glacier in late May were relatively high. A slight decrease to a more-or-less steady level for a long period followed. Concentrations then decreased in the last part of July (Fig. 2b). Throughout the summer, no very high peak concentrations of C1– and Na+ occurred in the river water, indicating that these ions were draining more-or-less steadily from a principal source. An inverse relation between discharge and both C1– and Na+ was observed, suggesting that the source which supplied the Cl– and Na+ was dominant in the base-flow component of the bulk meltwater.
The total output (table 2) and the total daily load of each of the ions leaving the catchment were calculated, using river discharge and the specific concentration oi each ion. Subtraction of the precipitation input of C1– from the daily load, assuming a 48 h drainage time for the precipitation
(a) Glacier river discharge at Austre Okstindbreen, May–August 1995; (b) C1– concentrations in the river, May–August 1995; (c) Calculated daily load of C1– in the river which resulted from snowmelt, May–August 1995. (The input from summer precipitation has been subtracted from the total measured load.)
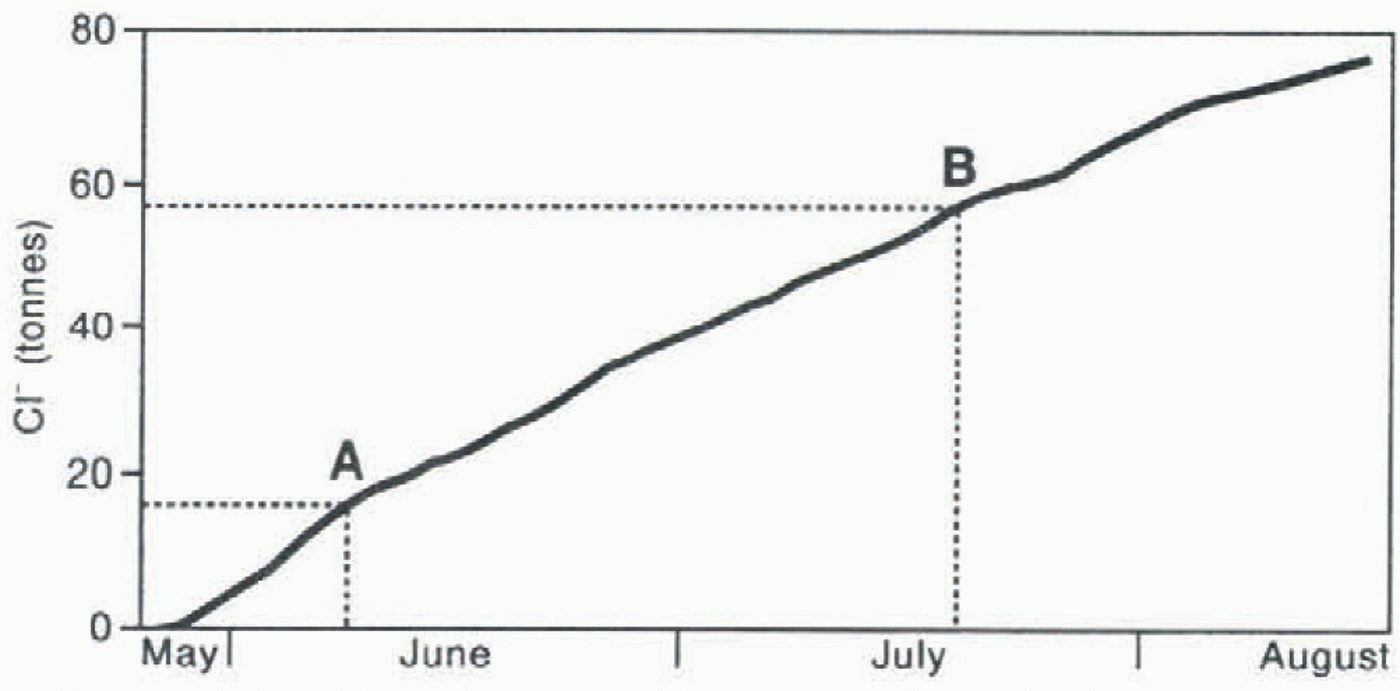
Accumulated load of C1– in the river draining the Austre Okstindbreen catchment, May–August 1995. (See text for further explanation.)
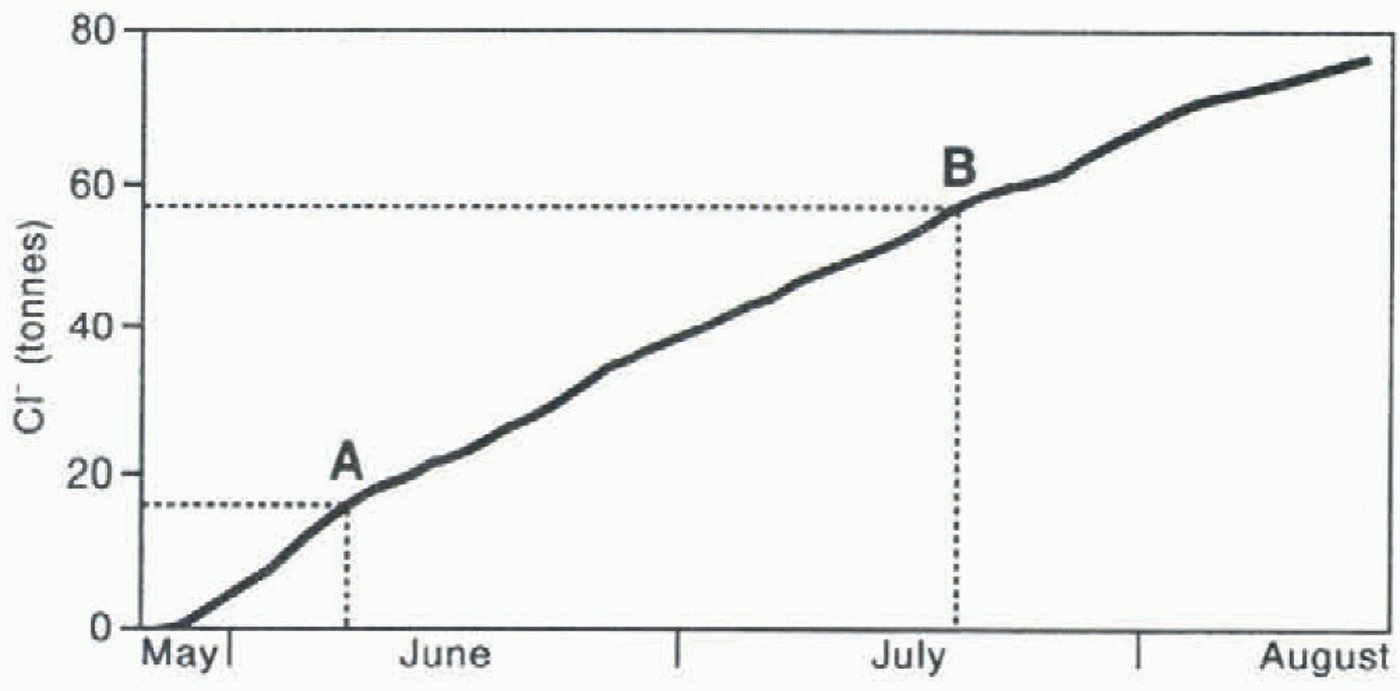
input, yielded the net load supplied by the drainage of ions from the snowpack (Fig. 2c). The daily load varied, but a more-or-less constant level did occur from mid-June to late July. Summing daily net loads produced a plot of the accumulated load of ions (Fig. 3).
Discussion
The ratio of Cl– and Na+ ions in both inputs to, and outputs from, the Austre Okstindbreen catchment (tables 1 and 2) suggests that nearly all the material originated from seasalt in wet and dry deposition. (The Cl–/Na+ ratio in sea water is 1.80).
Melting begins in the lower part of the catchment before it starts at higher elevations, and the melt rate is faster at these lower sites. Meltwater passes more rapidly through the glacier where the snow is underlain by ice than where there is a substantial thickness of firn between the snow and the ice. Thus, ions which have accumulated in the lower part of the catchment are the first to leave the glacier during the melt season. By early June, a substantial part of the winter’s snow had melted from the lower part of the catchment, yielding an accumulated load of 16.2 t of Cl– to the glacier river. Assuming that the load is the first to drain from the catchment, the ions would have left by 9 June (A in Fig. 3). By 12 June, 72% (40.6 t) of the winter-accumulated Cl– had left the snowpack in the upper part of the catchment and had entered the underlying firn and glacier (table 3). This contributed to the net load of ions in the glacier river during the following weeks. The accumulated net Cl– load reached about 57 t in late July (B in Fig. 3). This, therefore, is the earliest time by which those ions which had been removed from the snowpack in the upper part of the catchment on or before 12 June could have left the glacier in the river. Thus, it is clear that the time taken for the first meltwater to pass from the upper parts of the glacier to the point at which the river emerges is very long: at least 6 weeks, equivalent to a maximum velocity of 100 m d–1. Ions continued to be removed from the glacier in the river during the last part of July and August. By 16 August, the accumulated net load of C1– had reached 75 t (Fig. 3).
Some ions remained in the residual snowpack on 12 August (table 1). Despite the close relationship of the total input and total output of ions from the catchment in 1994–95 (table 2), it is clear that melting of the 1994–95 winter snowpack, together with 1995 summer precipitation, could not account for the total load of ions removed from the catchment by the glacier river in 1995. The most likely source of the additional ions in the river is water which was stored within or beneath the glacier during the 1994–95 winter. Meltwater which forms at the surface of the upper part of the catchment in late summer may not reach the glacier river before the internal drainage system is closed down at the beginning of winter, because of the slow drainage velocity of meltwater (Lang and others, 1977). Some ions therefore are stored through the winter and released only when the drainage system opens up in the following year. The concentration of ions in such stored water is likely to be low because most of the ions are removed from the snowpack well before the end of the melt season. Previous studies of the chemistry of the snowpack at Austre Okstindbreen have indicated that between-year differences of ionic concentrations are not large, and it is therefore evident that year-to-year variations of ionic concentrations in the stored water are likely to be relatively small.
Tf water which was stored within the glacier through the 1994–95 winter did contribute to river discharge and ionic load early in the 1995 melt season, the date by which 72% of the ions from the upper part of the catchment had appeared in the glacier river would be later than suggested in Figure 3. Some of the over-wintered water and ions would have emerged during the earliest stage of water flow from the glacier, and point A in Figure 3 would move further into June.
Conclusion
Some 72% of the Na+ and Cl– ions left the Austre Okstindbreen snowpack in 1995 with the first 12% of the meltwater generated at the surface. However, as revealed by input and output measurements of C1–, the transit time for the first meltwater formed at the surface of the accumulation area was very long, with a mean velocity of only 100 m d–1. The relatively continuous nature of the passage of C1– through the glacier, and the relatively uniform load in the glacier river, also indicate that, once the ions have left the snowpack, their rate of supply to the glacier river is more regular. The observations of the ionic concentrations in the snowpack and the ionic load in the glacier river indicate that, early in the melt season, water which has been stored within or beneath the glacier through the winter is released, resulting in an addition to the river’s ionic load.
Acknowledgements
The studies at Okstindan in 1995 were supported by grants from the European Union (ERBCHBICT941279), the U.K. Natural Environment Research Council (GR3/8373) and the Leverhulme Trust. N.T. Knudsen provided the mass-balance data, and M. B. Knudsen and O. B. Petersen assisted with the fieldwork.