I. INTRODUCTION
The removal of dyes from wastewater has attracted attention because dye effluents from the coloring, food, and textile industries can cause severe damage to the aquatic ecosystem and human health. Reference Gao, Zeng, Sun, Zou, Chen and Shao1,Reference Lei, Dai, Zhou and Zhang2 Various dye removal techniques include adsorption, flocculation, advanced oxidation processes, photodegradation, and biodegradation. Reference Li, Liu, Jing, Ling and Li3–Reference Szygula, Guibal, Palacín, Ruiz and Sastre7 An alternative technique is photocatalytic degradation, which is an efficient, inexpensive, and clean method. Reference Saleh and Gupta8,Reference Lu, Yan, Wang, Liu, Song and Jiang9 Researches showed that the nanostructure materials of TiO2, ZnO, CdS–TiO2, etc., are very good photocatalysts, which have been widely applied in environmental pollution removal and photocatalytic hydrogen generation. Reference Chen, Liu and Huang10–Reference Li, Luo, Yang, He, Chen, Lin, Zhu and Li13 Up to now, TiO2 is the most widely used photocatalyst, but its band gap often limits its use of solar irradiation. Reference Zhou, Du, Hu, Yin, Li, Yu, Wang, Wang, Liu, Wang and Zhang14,Reference Gao, Li, Sun and Ng15 The Ag/Au doped composite nanocatalysts enhance the photocatalytic activity due to a better separation of photogenerated charge carriers and improves the oxygen reduction, Reference Deng, Zhang, Zou, Shi, Liang, Li, Fu and Wang16,Reference Sun, Wei and Li17 while the cost is too high. Recently, several semiconductor materials have been studied for photoactivity enhancement, such as spinel-type ferrite (AB2O4), Reference Mahmoodi18 perovskite-type oxide (ABO3), Reference Fu, Niu, Tao, Song, Mao, Zhang, Chen and Wang19 and other transition metal oxides. Reference Song and Zhang20,Reference Miwa, Kaneco, Katsumata, Suzuki, Ohta, Verma and Sugihara21 However, most of these are limited by narrow band gaps, biological toxicity, or low separation rates between photogenerated electrons and holes.
Cerium dioxide (CeO2) is a widely used photocatalyst because of its high chemical stability, low biological toxicity, and large oxygen storage capacity. Reference Ameen, Akhtar, Seo and Shin22 However, the application of CeO2 photocatalysts is limited by its relatively low catalytic activity because of a ∼3.2 eV band gap. Reference Channei, Inceesungvorn, Wetchakun, Phanichphant, Nakaruk, Koshy and Sorrell23 Combinations of CeO2 with other metal oxides were investigated to lower the band gap and enhance its photoactivity. Reference Li, Zhang, Lv, Wang, Zhang and Pan24,Reference Hu, Zhou, Wang and Zhang25 Doping transition metal ions of variable valence into the CeO2 lattice is considered a promising method. Doping with metal ions, such as Fe, Cu, Mn, Co, or Zn improves the optical properties of CeO2. Reference Channei, Inceesungvorn, Wetchakun, Phanichphant, Nakaruk, Koshy and Sorrell23,Reference Hu, Zhu, Jiang, Chen and Wu26–Reference Santos, Folly and Macêdo29 The doped ions substitute for Ce ions, or enter the interstices of the crystal lattice, which leads to the creation of donor or acceptor levels between the valence and conduction bands. This improves the separation rate of photogenerated electrons and holes and therefore enhances their photoactivity. Reference Wang, Quan and Lin30 For example, Fe-doped CeO2 particles had a decrease in band gap of 0.3 eV relative to pure CeO2, and both formic and oxalic acids were almost totally degraded under visible light irradiation Reference Channei, Inceesungvorn, Wetchakun, Phanichphant, Nakaruk, Koshy and Sorrell23 ; the absorption spectra peak of CeO2 shifted from the ultraviolet to the visible light region after being doped with Mn ions Reference Xia, Hu, Chen, Wan, He and Tian27 ; and, in Arul's research, Co-doped CeO2 nanocubes had a higher photocatalytic efficiency than undoped CeO2 for the degradation of the azo dye, acid orange 7. Reference Arul, Mangalaraj, Chen, Ponpandian and Viswanathan28 Further, the 1.50 mol% Fe-doped CeO2 showed an active property for methyl orange degradation, with less than 10% of photoactivity decreased after being reused 10 times, which indicated that the photocatalytic performance of doped CeO2 is state. Reference Channei, Inceesungvorn, Wetchakun, Ukritnukun, Nattestad, Chen and Phanichphant31 Although different catalysts were widely investigated in wastewater treatment, the photocatalytic property comparison between transition metal ion doped CeO2 photocatalysts has not been performed, and the ideal percentage of doped ions has not been confirmed, especially the effect of oxygen vacancy on the photocatalytic activity.
We investigated the photocatalytic performance of CeO2 nanoparticles that were doped with Fe, Cu, Mn, or Zn ions. The improvements of the photocatalytic properties between these doped ions were compared, and the surface area, pore structure, and oxygen vacancies were considered. The nanocatalysts were synthesized using a coprecipitation method and were characterized by x-ray diffraction (XRD), scanning and transmission electron microscopies (SEM and TEM), Brunauer–Emmett–Teller (BET) isotherm methods, and Raman spectroscopy. The model refractory organic dye pollutant Rhodamine B (RhB), which contains two diethylamino groups on either side of the xanthene ring, was chosen as the target pollutant. UV–Vis spectrometry and liquid chromatography–mass spectrometry (LC/MS) were used to analyze the course of the degradation and the dye products.
II. EXPERIMENTAL
A. Synthesis of the photocatalysts
The transition metal ion doped nanoCeO2 catalysts were prepared using coprecipitation followed by a thermal treatment. A stoichiometric amount of Ce(NO3)3·6H2O and a transition metal salt were dissolved in 500 mL of deionized water, where the concentration of the metal ion was approximately 0.025 mol/L. The solution was mixed using magnetic stirring for approximately 30 min. Then, with continued stirring, 600 mL of 0.1 mol/L aqueous NaOH was added at a flow rate of 1.0 mL/min using a peristaltic pump. The resulting precipitate was filtered, washed several times with deionized water and ethanol, and then dried at 100 °C for 10 h. The dried precipitate was calcined at 350 °C for 2 h, and then the temperature was quickly increased to 600 °C and the product was calcined for an additional 30 min. It was then allowed to cool to ambient temperature.
B. Characterization of the photocatalysts
The crystal structures of the prepared nanocatalysts were determined using an x-ray diffractometer (Rigaku D/Mmax2500 PC, Japan) using Cu Kα radiation (λ = 1.54 Å) at a scanning rate of 6°/min over a 2θ range from 20° to 80°. The morphologies and nanostructures of prepared photocatalysts were observed using field emission SEM (JEOL, JSM-7001F) and TEM (JEOL, JEM-2100). Nitrogen adsorption–desorption isotherms were used to measure their specific surface areas and pore structures, and these values were calculated from the isotherms using the BET and Barrett–Joyner–Halenda methods using the NOVA 2000e instrument (Quantachrome, USA). Raman spectra were collected over the range from 50–3400 cm−1 using a 633 nm infrared laser (Thermo Fisher DXR, USA).
C. Determination of the activity of the photocatalysts
The photocatalytic activities of the nanocatalysts were evaluated using the degradation of aqueous RhB under UV irradiation. First, a 0.2 g sample of a catalyst was added to 200 mL of a 5 mg/L RhB solution, which was mixed by magnetic stirring for approximately 1 h in the dark to reach adsorption/desorption equilibrium. After this, the photodegradation process was initiated by exposing the sample to UV irradiation. During the degradation process, the temperature was held constant at 25 ± 1 °C using a water recirculator, and the airflow rate was maintained at 0.5 L/min using an air pump. Approximately, 4 mL aliquots of the suspension were removed at given time intervals and separated by centrifugation at 12,000 rpm. The absorbance of the RhB solution was determined using a spectrophotometer at 552 nm. The photocatalytic degradation efficiency, E, of the catalyst was calculated using the formula: E = (C 0 − C t )/C 0 × 100%, where C 0 and C t are the initial concentration and the concentration after irradiation time t of the RhB solution, respectively. Reused catalysts were regenerated by keeping at 350 °C for 2 h. The intermediate products of the RhB decomposition were analyzed using LC/MS (Thermo Fisher LXQ, USA) at a flow rate of 0.2 mL/min. Positive ion mode was used and the mobile phase was methanol–water (65:35, v/v). Eluted compounds were detected using a UV detector at 550 nm.
III. RESULTS
A. Catalyst characterization
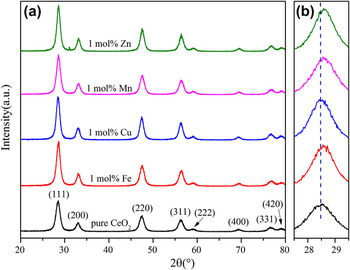
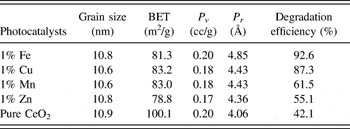
Figure 1 shows the XRD patterns of the transition metal ion doped CeO2 nanocatalysts. Only the diffraction peaks for cubic CeO2 (JCPDS 34-0394) were observed, which indicated that the metal ions were doped into the CeO2 lattice. The location of diffraction peaks shifted to the right slightly might be attributed to the ionic radius of the doped metals being smaller than that of Ce4+. Reference Xia, Hu, Chen, Wan, He and Tian27 The average grain sizes of the CeO2 crystals were estimated using the Scherrer equation for the (111) plane and is shown in Table I. The grain sizes of the doped CeO2 nanocatalysts were <11.0 nm and they exhibited a decreasing trend.
XRD patterns of the pure and doped CeO2 nanocatalysts.

The characterization parameters of specific surface areas (BET), pore volume (P v ), pore radius (P r ), and dye degradation efficiency of the nanocatalysts.

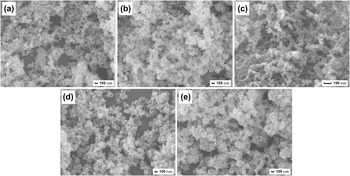
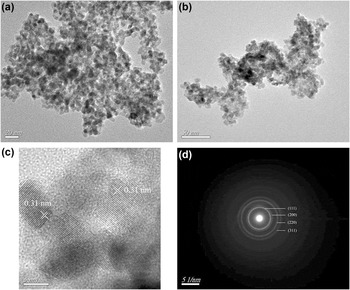
The micromorphologies of the nanocatalysts are presented in Fig. 2. The nanocatalysts have a mesoporous structure with particle sizes from 15 to 20 nm. No significant changes are observed after the transition metal ions were doped into the lattice. Figure 3 shows the TEM images of (a) CeO2 and (b) 1 mol% Fe doped CeO2. In close agreement with the XRD analysis (Table I), the particles have spherical structures with an average particle size of ∼15 nm. This demonstrated that they were nanoscale catalysts. The lattice fringes are calculated with a spacing of about 0.31 nm, similar results were reported in Refs. Reference Hu, Zhou, Wang and Zhang25 and Reference Liyanage, Perera, Tan, Chabal and Balkus32, which is attributed to the (111) planes of CeO2 (JCPDS PDF: 34-0394). Additionally, the metal ion doped CeO2 has an observable mesoporous structure and high pore volume, which could provide many active sites for dye adsorption.
SEM morphologies of (a) pure CeO2, and CeO2 doped with 1 mol% (b) Fe, (c) Cu, (d) Mn, and (e) Zn.

TEM images of (a) pure and (b, c) 1 mol% Fe doped CeO2. (d) SAED pattern of 1 mol% Fe doped CeO2.

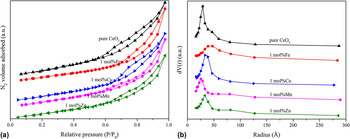
The nitrogen adsorption/desorption isotherms of the different metal ion doped CeO2 nanocatalysts are shown in Fig. 4(a). The isotherms could be classified as a Type-V shape, which is the characteristic of porous materials. Reference Yan, Blanford, Holland, Smyrl and Stein33 The isotherms show an almost linear section over the low-pressure portion, whereas the isotherms change to a large hysteresis loop at a high relative pressure. This demonstrated that there were mesopores in the catalysts. The calculated specific surface areas, pore volumes, and average pore radii are summarized in Table I. The doped transition metal ions decreased the specific surface area of the CeO2 nanocatalyst by approximately 20%. Figure 4(b) shows the pore distributions of the samples. The dominant pore radius ranged from 25 to 75 Å, which confirms that these materials had a mesoporous structure with a high pore volume. This is consistent with the SEM and TEM observations. In addition, the 1 mol% Fe doped-CeO2 shows the largest pore volume and size among the CeO2-based nanocatalysts. This should improve its adsorption ability and accelerate the mass transfer of reactants.
(a) Nitrogen adsorption–desorption isotherms and (b) pore sizes distribution of the photocatalysts.

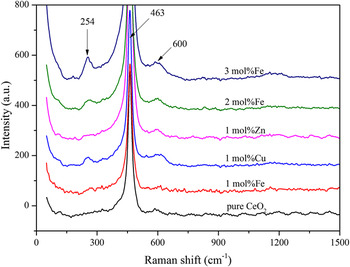
Figure 5 shows the Raman spectra of the transition metal ion doped CeO2 nanocatalysts. The strong peak positioned at 463 cm−1 is attributed to the vibrational mode of Ce-O8. Reference Santos, Folly and Macêdo29,Reference Radović, Mitrović, Golubović, Fruth, Preda, Šćepanović and Popović34 The vibrational modes at approximately 600 cm−1 are attributed to oxygen vacancy defects. Reference Channei, Inceesungvorn, Wetchakun, Phanichphant, Nakaruk, Koshy and Sorrell23,Reference Brito, Santos, Duque and Maêdo35 Interestingly, even in undoped CeO2 samples, an intrinsically low concentration of oxygen vacancies is detected, which is attributed to the existence of Ce3+ and sample defects. Reference Chen, Shen, Wang and Zhang36 The 1 mol% Fe doped samples show a very low concentration of oxygen vacancy. But the 1 mol% Cu, and 2 and 3 mol% Fe doped samples had another vibrational mode at 254 cm−1 corresponding to Cu–O or Fe–O vibration modes. Reference Brito, Santos, Duque and Maêdo35 A similar phenomenon was observed in the research of Radović, where a FeO phase can be detected when 5 mol% Fe ions were doped into CeO2. Reference Radović, Mitrović, Golubović, Fruth, Preda, Šćepanović and Popović34 Because the radii of doped ions were smaller than Ce4+, the lattice parameters will be changed. This limited the concentration of doped ions that could enter the ceria lattice and resulted in an agglomeration of doped ions to form a metal oxide phase at high doping concentrations.
Raman spectra of the pure and doped CeO2 photocatalysts.

B. Photocatalytic activity and RhB degradation
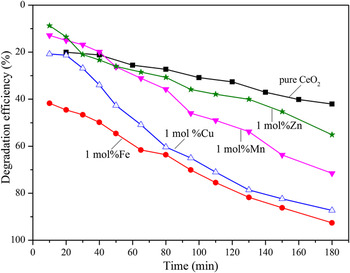
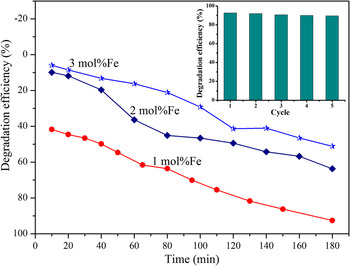
Figure 6 shows the degradation efficiency of the different photocatalysts as a function of UV irradiation time (dark experiments demonstrated that the adsorption of RhB onto the nanoCeO2 catalysts was negligible). As shown in Table I, after 180 min of irradiation, the RhB concentration decreased ∼42.1% over pure CeO2 nanoparticles. However, its photocatalytic activity was largely enhanced when it was doped with transition metal ions. The degradation efficiency increased to 92.6, 87.3, 61.5, and 55.1% when doped with 1 mol% of Fe, Cu, Mn, and Zn, respectively. The 1 mol% Fe-doped CeO2 photocatalyst had the best photocatalytic performance and its UV–Vis absorption spectra at various irradiation times are presented in Fig. 7. We found that the absorption peak of the dye solution decreased quickly during the first 10 min, and ∼50% of the RhB was removed after 45 min. To explore the proper percentage of transition metal ions doping amount, the degradation efficiencies of RhB in the presence of CeO2 doped with different concentrations of Fe are shown in Fig. 8, which demonstrates that the optimum Fe doping was 1 mol%. Similar results have been found in Channei's study, which showed that 1.5 mol% Fe-doped CeO2 film with a bind energy of 2.65 eV had the optimal photocatalytic activities for methyl orange degradation, and with further doping levels, the photocatalytic activities become worse. Reference Channei, Inceesungvorn, Wetchakun, Ukritnukun, Nattestad, Chen and Phanichphant31
Photocatalytic activities of pure and doped CeO2 during RhB degradation under UV irradiation.

UV–Vis absorption of RhB during the photocatalytic degradation over 1 mol% Fe-doped CeO2 as a function of time.

Photocatalytic activities of CeO2 doped with different concentrations of Fe in RhB degradation under UV irradiation, relationship of RhB degradation efficiency and cycle times using 1 mol% Fe-doped CeO2 (inset picture).

Because the specific surface areas (shown in Table I) of the catalysts were similar, exception of the pure CeO2, the specific surface area was not the main factor determining photocatalytic activity. The pore structure and volume, especially the active size on the catalyst surface or the internal crystal structure might contribute to the photodegradation process. Because with the more number of pores and large pore volume of catalyst, the adsorption ability and mass transfer of reactants are improved, which enhanced the photocatalytic activity of CeO2. Another reason of the above phenomenon was attributed to two aspects: on the one hand, the doped transition metal ions resulted in a decrease of band gap and delayed the electron–hole recombination, thereby increasing the lifetime of the electron–hole separation; on the other hand, high concentration of oxygen vacancy will lead to the deep traps, these deep traps again would allow fast electron–hole recombination. Reference Liyanage, Perera, Tan, Chabal and Balkus32 So the different kinds of transition metal ions lead to a different concentration of oxygen vacancy, which might prevent the form of electron–hole.
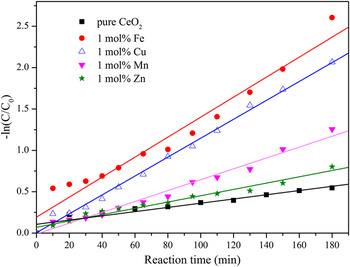
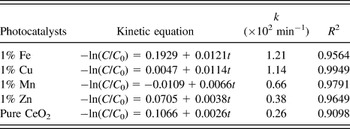
To understand the photocatalytic degradation process of RhB, a kinetic analysis was performed, and a linear plot of −ln(C/C 0) versus the irradiation time t is shown in Fig. 9. We found that the photocatalytic degradation process of aqueous RhB solution by the various doped CeO2 obeys pseudo-first-order kinetics because the correlation coefficient values (R 2) for all the samples were >0.9. Similar results are found in the literature. Reference Xu, Li, Sun, Xia, Wu, Ye and Zhang37 The 1 mol% Fe-doped catalyst had the highest photocatalytic degradation rate of 0.0121 min−1. The photocatalytic degradation rate of 1 mol% Fe-doped catalyst was 1.1, 1.8, 3.2, and 4.7 times greater than those of the catalysts doped with 1 mol% of Cu, Mn, Zn, and pure CeO2, respectively. The pseudo-first-order kinetic equation, kinetic constants, and relative coefficients are summarized in Table II. The degradation rate of 0.0121 min−1 is 2 times than that of Channei's report, a degradation rate of 0.006 min−1 for methyl orange by 1.5 mol% Fe-doped CeO2. Reference Channei, Inceesungvorn, Wetchakun, Ukritnukun, Nattestad, Chen and Phanichphant31 The photostability of the 1 mol% Fe doped CeO2 catalyst was examined by repeated experiment. After 5 cycles, the RhB photodegradation efficiency was still kept at about 90%, which revealed the catalyst displayed a good stability (inset picture in Fig. 8).
Pseudo-first-order kinetics plots for the degradation of RhB under UV irradiation for different photocatalysts.

The first order kinetic equation, kinetic constants (k), and relative coefficient (R 2) for the degradation of RhB under UV-light irradiation for different samples.

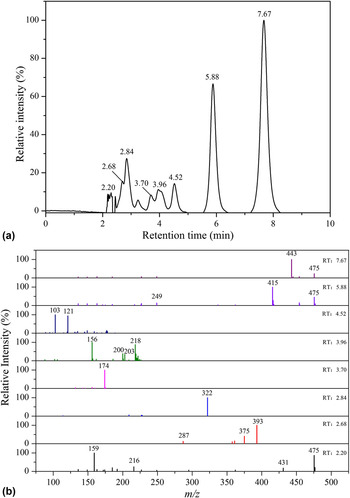
LC/MS was used to detect the intermediates of the RhB degradation. The photodegradation products of RhB after UV irradiation for 180 min over a 1 mol% Fe-doped CeO2 catalyst are shown in Fig. 10. Eight peaks were observed in LC/MS chromatogram with retention times of 2.20, 2.68, 2.84, 3.70, 3.96, 4.52, 5.88, and 7.67 min. The electrospray ionization (ESI) mass spectra of these peaks are shown in Fig. 10(b). Mass signals recorded at m/z = 475, m/z = 443, and m/z = 415 indicate the existence of RhB and its N-de-ethylated intermediates during the photodegradation process, which can be verified from the UV results. These RhB dye molecules would be totally removed after the reaction is complete. The mass signals recorded at m/z = 443 and m/z = 415 correspond to RhB and N,N-diethyl-N-ethylrhodamine (DER), which agrees with the results of previous research. Reference Xu, Li, Sun, Xia, Wu, Ye and Zhang37,Reference He, Sun, Yang, Ding, He and Wang38 The mass signal recorded at m/z = 322 corresponds to the intermediate where RhB lost its benzoic acid moiety. Reference Li, Ma, Lei and Zhao39 Upon further UV irradiation, the ethyl and amino groups are totally removed from these intermediates, corresponding to mass signals at m/z = 174 and m/z = 159. In addition, benzoic acid (m/z = 121) and propanedioic acid (m/z = 103) are detected at a retention time of 4.52 min, whereas products with formula weights <50 cannot be detected using LC/MS. After continuous oxidation and long reaction times all the intermediates would become colorless low- or nontoxic products, including CO2, H2O, and inorganic salts. The RhB degradation process can be expressed simply like this: under light illumination, the photoexcited electron generated and moved to the conduction band of CeO2. Then the photoexcited electrons combined with the surface oxygen or H2O to produce a large amount of reactive oxyradicals, such as superoxide radical ion O2 and hydroxyl radical ˙OH over the surface of CeO2. Reference Ameen, Akhtar, Seo and Shin22,Reference Channei, Inceesungvorn, Wetchakun, Ukritnukun, Nattestad, Chen and Phanichphant31 These oxyradicals reacted with RhB molecules and finally oxidized the dyes into CO2 and H2O by passing through the number of intermediates described previously. Further, the doped CeO2 nanocatalysts, especially the Fe doped CeO2, might produce large number of oxyradicals on the surface of catalyst by an easy electron–hole separation, which might significantly improve the photodegradation ability of CeO2 and converted the RhB into less harmful minerals.
(a) LC/MS spectra of the main products after photodegradation of RhB over 1 mol% Fe-doped CeO2 for 180 min and (b) ESI mass spectra of these intermediates.

IV. DISCUSSIONS
Decreasing the band gap of CeO2 by introducing chemical impurities is the main method for photoactivity improvement, which not only enhance the absorption of visible light but also enhance the separation efficiency of photo-generated electron–hole pairs. Reference Li, Yu, Low, Fang, Xiao and Chen40 However, the oxygen vacancy concentration is another important aspect for photoactivity. When a part of Ce4+ ions of CeO2 is substituted by di- or trivalent ions, such as Fe3+, Cu2+, Mn2+/3+, or Zn2+ ions, oxygen vacancies are formed to ensure the charge neutrality of the CeO2 crystals. In pure CeO2, an intrinsically low concentration of oxygen vacancies has been detected, as shown in Fig. 5, which is attributed to the existence of Ce3+ in the CeO2 lattice and sample defects caused by small size effects. Reference Chen, Shen, Wang and Zhang36 In the transition metal ion doped samples, Cu, Mn, and Zn ions are usually divalent in CeO2, Reference Xia, Hu, Chen, Wan, He and Tian27 whereas Fe ions are trivalent. Reference Radović, Mitrović, Golubović, Fruth, Preda, Šćepanović and Popović34 This results in an abundance of oxygen vacancies. The concentration of oxygen vacancies was not significantly increased when only 1 mol% of Fe was doped. This might be due to the existence of Fe4+, or the replacement of Ce3+ by Fe3+, which could effectively decrease the fraction of Ce3+ in the CeO2 nanocrystals. The existence of Fe3+/Fe4+ couple in Fe doped CeO2 has also been detected in Channei's. Reference Liyanage, Perera, Tan, Chabal and Balkus32 Thus, the number of oxygen vacancies increased with an increase of Fe ion concentration, and the samples doped with 1 mol% of Fe ions had a lower concentration of oxygen vacancies than the other samples.
The separation of electron–hole pairs is closely related to the amount of oxygen vacancies present in the catalyst. Reference Liyanage, Perera, Tan, Chabal and Balkus32 As discussed above and in the literature, Reference Xia, Hu, Chen, Wan, He and Tian27,Reference Radović, Mitrović, Golubović, Fruth, Preda, Šćepanović and Popović34 divalent Cu, Mn, and Zn ions result in a high concentration of oxygen vacancies, which was demonstrated in the Raman spectra. Fe ions are trivalent or tetravalent in CeO2, which resulted in a relatively low concentration of oxygen vacancies and improved the separation of the photogenerated electrons and holes. Therefore, the 1 mol% Fe-doped catalyst showed a higher photoactivity than the Cu, Mn, and Zn doped samples. While the number of oxygen vacancies increases with increasing amounts of Fe, when the amount of doping concentration is high, more oxygen vacancies are generated. Too many oxygen vacancies will come together to form deep traps and result in a fast electron–hole recombination, which may be the reason for higher band gaps observed for high Fe doping concentrations. So the photocatalytic activity of CeO2 decreased upon further increasing the Fe content to 2 or 3 mol%. Thereby the oxygen vacancies at low doping levels improve the photocatalytic activity of CeO2, but at higher doping levels, it becomes worse.
V. CONCLUSIONS
Transition metal ion (Fe, Cu, Mn, and Zn) doped CeO2 nanocatalysts were successfully prepared by a coprecipitation method, and the photocatalytic activity of CeO2 was enhanced after doping. The spherical nanocatalysts had a mesoporous structure with an average particle size of ∼15 nm, and the active size on the catalyst surface and the internal crystal structure were the main factors affecting the photocatalytic activity. However, increased numbers of oxygen vacancies decreased the catalytic activity. The 1 mol% Fe-doped CeO2 was the most active catalyst owing to the separation of electron–hole easier and a very low concentration of oxygen vacancies, and ∼92.6% of the RhB was degraded after 3 h of irradiation. The catalyst activities were in the order: 1 mol% of Fe > Cu > Mn > Zn > pure CeO2. The degradation of RhB obeyed a pseudo-first-order kinetic process, which involved a stepwise oxidation. Over time, RhB could be fully oxidized to water, carbon dioxide, and inorganic salts.
ACKNOWLEDGMENTS
This work was financially supported by the National Natural Science Foundation of China (Grant No. 51274106, 51474113, 51474037), the Natural Science Foundation of Jiangsu Provincial Higher Education of China (Grant No. 12KJA430001), the Science and Technology Support Program of Jiangsu Province of China (Grant No. BE2012143, BE2013071), the Jiangsu Province's Postgraduate Cultivation and Innovation Project of China (Grant CXZZ13-0662, KYLX-1030, SJZZ-0132).