Introduction
Formal approval of the jahnsite group by the Commission on New Minerals, Nomenclature and Classification (CNMNC) of the International Mineralogical Society (IMA) has been reported recently by Kampf et al. (Reference Kampf, Alves, Kasatkin and Skoda2019). The general formula for jahnsite-group minerals is XM1(M2)2(M3)2(H2O)8(OH)2(PO4)4. The formula was first proposed by Moore and Ito (Reference Moore and Ito1978) who noted that for different jahnsite species the cation size in the metal atom sites consistently increased in the order M3<M2<M1<X. On this basis they proposed a nomenclature scheme whereby the minerals are separated into the jahnsite and whiteite series based on dominant Fe3+ and Al3+, respectively, in the M3 sites and then different minerals in the two series are distinguished by the suffix –(XM1M2), giving the dominant cations in these three sites. Kampf et al. (Reference Kampf, Alves, Kasatkin and Skoda2019) reported that since 1978, crystal structure refinements for all but one new species have been consistent with this nomenclature scheme. They recommended that the scheme be used in the case where site assignments from structure refinements were not possible due to poor single-crystal diffracting quality, which is common for jahnsite-group minerals. Kampf et al. (Reference Kampf, Alves, Kasatkin and Skoda2019) then used the scheme to define and name the first jahnsite-group mineral containing dominant Zn as jahnsite-(MnMnZn).
In a recent study of secondary Zn-bearing phosphate minerals associated with alteration of phosphophyllite at the Hagendorf-Süd pegmatite, Bavaria, we identified a potentially new jahnsite-group mineral with a high Zn content (Grey et al., Reference Grey, Keck, MacRae, Glenn, Mumme, Kampf and Cashion2018). Crystals of the mineral comprised sub-parallel bundles of laths and gave very poor quality single-crystal diffraction patterns so it was not possible to establish the site-ordering of the Zn from a structure refinement. Application of the jahnsite-group nomenclature scheme (Kampf et al., Reference Kampf, Alves, Kasatkin and Skoda2019), however, allowed the mineral to be defined and named as jahnsite-(CaMnZn). The mineral and name were approved by the CNMNC-IMA (IMA2019-073, Grey et al., Reference Grey, Keck, Kampf, MacRae, Cashion and Glenn2019a). The holotype sample is housed in the mineralogical collections at Museum Victoria, registration number M55028. Crystals from the holotype are deposited as cotypes in the collections of the Natural History Museum of Los Angeles County, 900 Exposition Boulevard, Los Angeles, CA 90007, USA, catalogue number 73927.
Occurrence and paragenesis
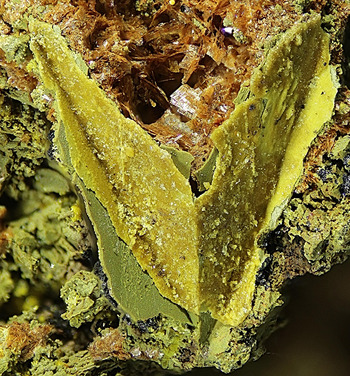
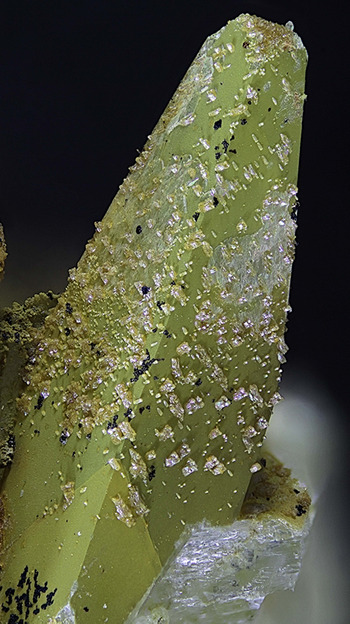
Jahnsite-(CaMnZn) was found in specimens collected by one of the authors (EK) from the 67 metre level of the pegmatite mine at Hagendorf-Süd, Oberpfalz, Bavaria, Germany (49°39′1″N, 12°27′35″E). The mineral forms thin crusts (Fig. 1) and epitactic growths (Fig. 2) on altered phosphophyllite crystals in an oxidised 30 × 40 × 50 cm nodule of former triphylite that has been replaced by phosphophyllite and minor apatite. The jahnsite crystals are often covered with a thin orange–yellow film of Zn-bearing santabarbaraite or green mitridatite. Other secondary minerals associated with jahnsite-(CaMnZn) in the altered triphylite nodule include apatite, chalcophanite, hopeite, jahnsite-(CaMnMn), Zn-bearing laueite, scholzite/parascholzite, parahopeite, schmidite, stewartite, vivianite, whitmoreite/earlshannonite and zincostrunzite. Jahnsite-(CaMnZn) is a secondary ferric iron phosphate mineral that has probably been formed by supergene alteration of phosphophyllite. In Mücke's (Reference Mücke1981) paragenesis classification of Hagendorf Süd minerals, jahnsite-(CaMnZn) is located in table I (rockbridge-free subparageneses) under paragenesis IC (decomposition of phosphophyllite). A discussion of the secondary Zn-bearing phosphate minerals associated with alteration of phosphophyllite at Hagendorf-Süd is given by Grey et al. (Reference Grey, Keck, MacRae, Glenn, Mumme, Kampf and Cashion2018).
Yellow crust of zinc-bearing jahnsite minerals on twinned, heavily corroded phosphophyllite. Associated minerals include green mitridatite and red schmidite. FOV is 3 mm. Photo V. Betz. Specimen stored at Museums Victoria under the registration number M55028.

Crystals containing jahnsite-(CaMnZn) on the surface of phosphophyllite, with a green surface film of mitridatite. FOV is 8 mm. Photo V. Betz. Specimen stored at Museums Victoria under the registration number M55028.

Physical and optical properties
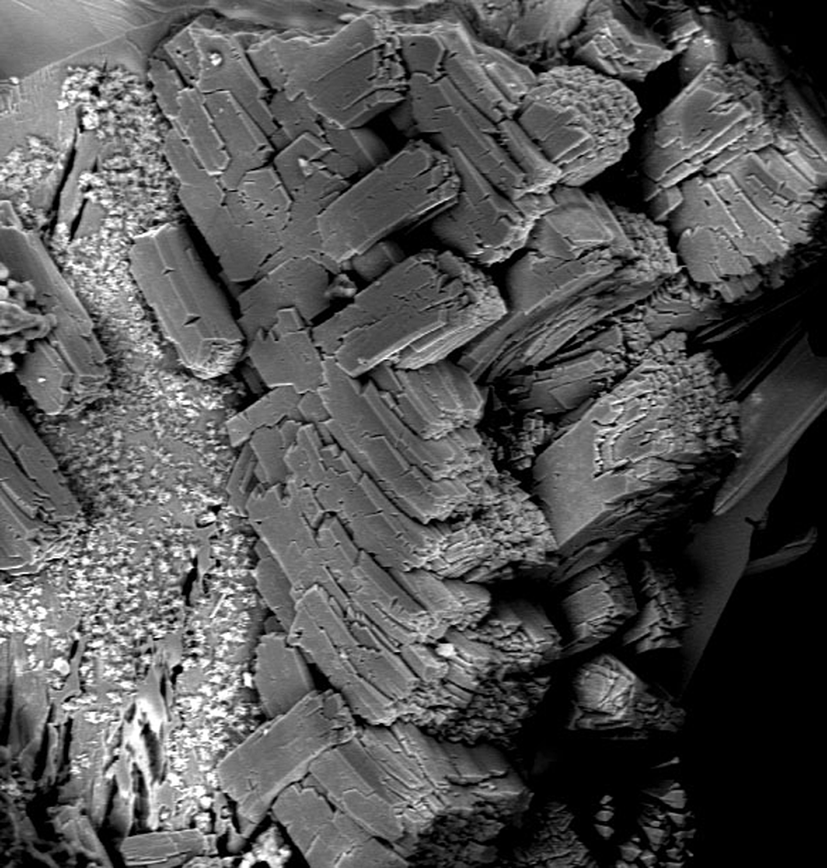
Epitactic overgrowths of jahnsite-(CaMnZn) on altered phosphophyllite comprise two almost orthogonal orientations of brown to brownish-yellow blocky crystals up to 100 μm long (Fig. 3). A structural basis for orthogonal orientation of jahnsite crystals growing on phosphophyllite has been given by Grey et al. (Reference Grey, Keck, MacRae, Glenn, Mumme, Kampf and Cashion2018). The underside of thin crusts comprised orthogonal orientations of smaller rectangular laths with sub-10 μm dimensions (figure 5 in Grey et al., Reference Grey, Keck, MacRae, Glenn, Mumme, Kampf and Cashion2018). Subparallel blades were also observed occasionally. The laths are elongated on [100] and flattened on {001} with good cleavage on {001}. The calculated density is 2.87 g cm–3 based on the empirical formula and cell parameters from powder X-ray diffraction (PXRD).
BSE image of blocky jahnsite-(CaMnZn)-containing crystals on the surface of phosphophyllite. White specks are mitridatite. FOV is 0.3 mm. Specimen stored at Museums Victoria under the registration number M55028.

Optical measurements on individual jahnsite-(CaMnZn) crystals showed that the crystals are biaxial (–), with α = 1.675(2), β = 1.686(2) and γ = 1.691(2) (white light). The calculated 2V is 68°. Dispersion could not be observed, and the optical orientation is Z = b. Pleochroism was imperceptible. The Gladstone–Dale compatibility index (Mandarino, Reference Mandarino2007) is 0.022 (excellent) based on the empirical formula.
Mössbauer spectroscopy
The Mössbauer spectrum for jahnsite-(CaMnZn)-bearing yellow crusts was taken using a conventional constant acceleration drive (Wissel) with a symmetrical sawtooth waveform collecting into 1024 channels unfolded. The source of 57Co in rhodium was maintained at room temperature. The sample was obtained by careful removal of yellow surface crusts (thickness 0.1–0.5 mm) from altered phosphophyllite crystals. A thin air-gap was often present between the crust and the crystal due to leaching of phosphophyllite at the interface and this assisted in the detachment of the crusts. Individual crusts were checked for phase purity by PXRD. As discussed in the chemical composition section, the crusts contain equal amounts of two jahnsite phases with different Zn contents. By combining numerous crusts a sample mass of 5 mg was accumulated for the Mössbauer experiment. Preliminary Mössbauer results were reported by Grey et al. (Reference Grey, Keck, MacRae, Glenn, Mumme, Kampf and Cashion2018). We have subsequently re-run the spectrum using a new source to obtain better counting statistics.
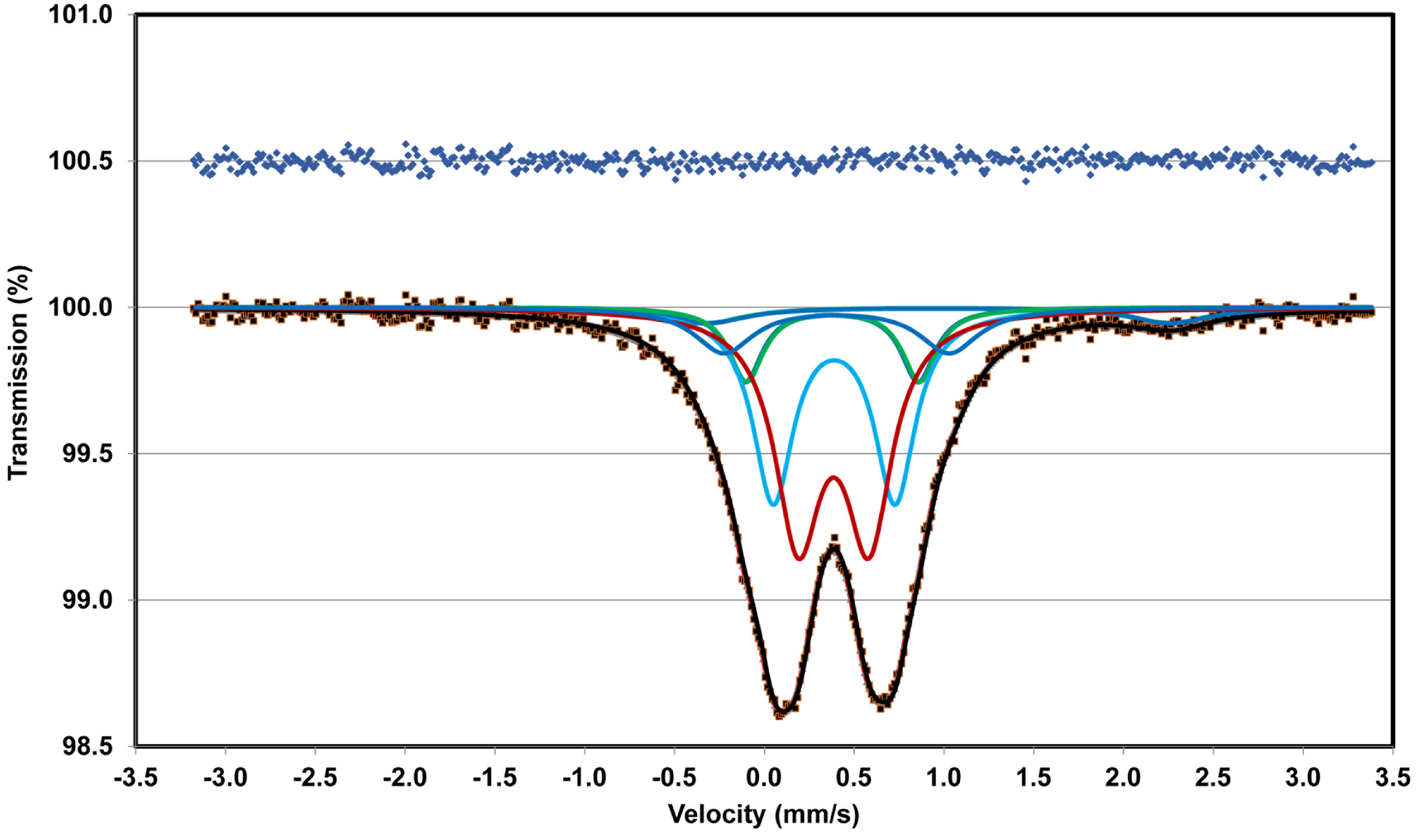
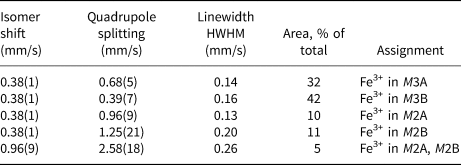
As discussed by Hochleitner and Fehr (Reference Hochleitner and Fehr2010) the jahnsite structure contains four octahedral sites that can be occupied by the small Fe3+ cation (two M2 and two M3 sites). Fits to the spectrum were made using one to four ferric doublets plus a ferrous doublet. The best fit, with a χ2 of 0.643 was obtained using four ferric doublets with Lorentzian lineshapes. Fitting of the new spectrum with the program RECOIL (developed by Lagarec and Rancourt, Reference Lagarec and Rancourt1998). gave the fit shown in Fig. 4, and the parameters reported in Table 1. The crystallochemical assignments are tentative, because of the presence of two jahnsite phases, but are consistent with those reported for keckite by Hochleitner and Fehr (Reference Hochleitner and Fehr2010) based on increasing distortion of the M2 and M3 sites in the order M3A<M3B<M2A<M2B (these correspond to the sites Fe1<Fe2<Mg1<Mg2 used by Hochleitner and Fehr). The primary objective of the Mössbauer experiment was to obtain the ratio of ferrous to ferric iron for incorporation into the empirical formula and this required the best-possible fit to the integrated areas of the doublet envelopes for Fe2+ and Fe3+. The proportions of Fe2+ and Fe3+ obtained from the fitting are 5% and 95% of the total iron content, respectively, and in the calculation of the empirical formula it was assumed that the small amount of Fe2+ was evenly distributed between the two jahnsite phases.
Fitted Mössbauer spectrum for jahnsite-(CaMnZn)-bearing crusts removed from altered phosphophyllite. Blue dots correspond to difference between observed and calculated spectra. Individual doublet contributions shown in blue and red colours.

Mössbauer parameters (mm/s) for jahnsite-(CaMnZn)-bearing crusts.

Infrared spectroscopy
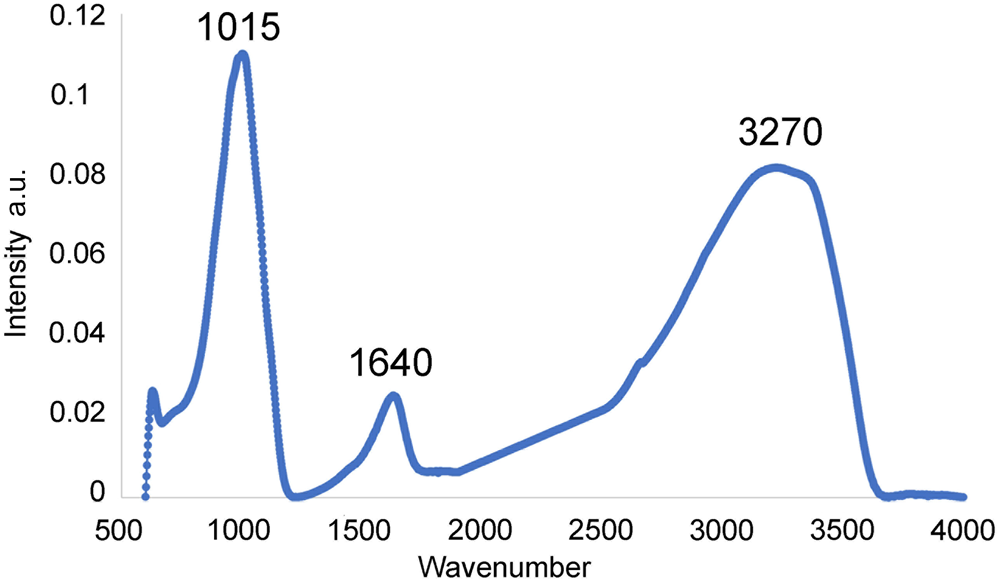
Attenuated total reflection infrared spectroscopy on jahnsite-(CaMnZn)-bearing yellow crusts was conducted using a Bruker Equinox IFS55 spectrometer fitted with Judson MCT detector and Specac diamond ATR. Fifty co-added scans were employed at a spectral resolution of 4 cm–1. The infrared spectrum is shown in Fig. 5. In the OH-stretching region, a broad band centred at 3270 cm–1 is attributed to water molecules and strongly hydrogen-bonded hydroxyl ions. There is a corresponding band corresponding to H–O–H bending vibrations for water molecules at 1640 cm–1. Only a single, broad band corresponding to (PO4)3– stretching vibrations is observed, centred at 1015 cm–1. This corresponds to the average of the 1069 cm–1 antisymmetric stretching and the 970 cm–1 symmetric stretching bands that were resolved in the Raman spectrum for jahnsite-(MnMnZn) (Kampf et al., Reference Kampf, Alves, Kasatkin and Skoda2019).
Infrared spectrum of jahnsite-(CaMnZn)-bearing crusts.

Chemical composition
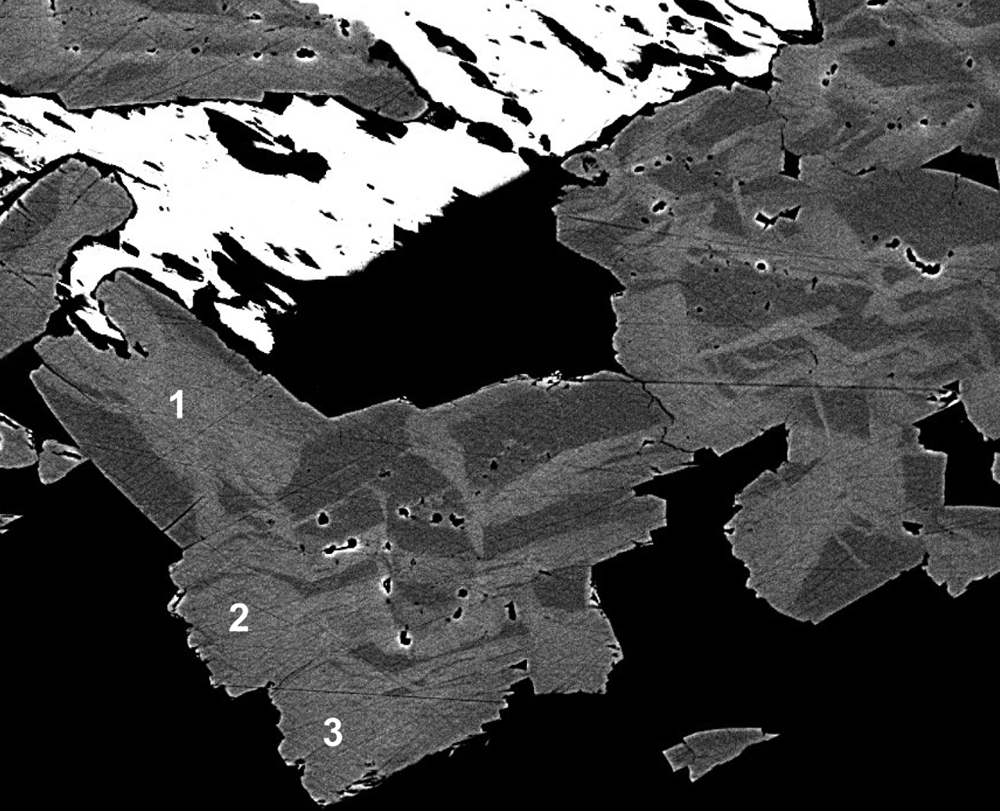
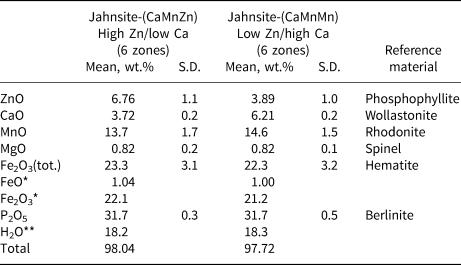
Sectioned and polished crystals displayed a two-phase mottled texture in scanning electron microscope back-scattered electron (BSE) images due to step-changes in the Zn and Ca contents. The crystals have approximately equal area fractions of the two compositions, which occur on a scale of ~50 μm as shown in Fig. 6. Electron microprobe analyses (EMPA) were made on regions of both compositions. The EMPA were made using wavelength-dispersive spectrometry on a JEOL JXA 8500F Hyperprobe operated at an accelerating voltage of 15 kV and a beam current of 4 nA. The beam was defocused to 5 μm. The analytical results were reported by Grey et al. (Reference Grey, Keck, MacRae, Glenn, Mumme, Kampf and Cashion2018). The analyses are reproduced in Table 2 with a small correction to the FeO and Fe2O3 values based on the new Mössbauer fit. The water content is from the crystal structure for jahnsite-group minerals with 26 anions per formula unit. The atomic proportions for the two zoned regions are:
High Zn: Ca0.59Mn1.72Mg0.18Zn0.74Fe2+0.13Fe3+2.47P3.98O26H17.97
Low Zn: Ca0.98Mn1.82Mg0.18Zn0.42Fe2+0.12Fe3+2.36P3.97O26H18.03.
Sectioned and polished crystals from the sample shown in Fig. 3. The white phase = phosphophyllite; light grey = jahnsite-(CaMnZn); and dark grey = jahnsite-(CaMnMn). Crystals labelled 1 to 3 are predominantly jahnsite-(CaMnZn). FOV is 250 μm.

EMP results (wt.%) for jahnsite-(CaMnZn) and jahnsite-(CaMnMn).

*FeO/Fe2O3 from Mössbauer. **H2O from structure. S.D. – standard deviation.
Applying the IMA-approved (Kampf et al., Reference Kampf, Alves, Kasatkin and Skoda2019) site assignment procedure to these formulae gives: for the high-Zn and low-Zn compositional zones, respectively:
(Ca0.59Mn0.24)Σ0.83Mn(Zn0.74Mn2+0.48Mg0.18Fe2+0.13Fe3+0.47)Σ2 Fe3+2(P0.995O4)4(OH)2.03(H2O)7.97
(Ca0.98)Mn0.90(Zn0.42Mn2+0.92Mg0.18Fe2+0.12Fe3+0.36)Σ2 Fe3+2(P0.99O4)4(OH)1.97(H2O)8.03.
The low-Zn compositional zones correspond to jahnsite-(CaMnMn), Grice et al. (Reference Grice, Dunn and Ramik1990). The high-Zn zones correspond to jahnsite-(CaMnZn). The sectioned crystals labelled 1 to 3 in Fig. 6 are predominantly jahnsite-(CaMnZn). The simplified formula is (Ca,Mn)Mn[(Zn,Mn2+,Mg,Fe2+),Fe3+]2Fe3+2(PO4)4(OH)2⋅8H2O.
The ideal formula for jahnsite-(CaMnZn) is CaMn2+Zn2Fe3+2(PO4)4(OH)2⋅8H2O which requires MnO 7.92, CaO 6.26, ZnO 18.18, Fe2O3 17.83, P2O5 31.71, H2O 18.10, total 100 wt.%.
Crystallography
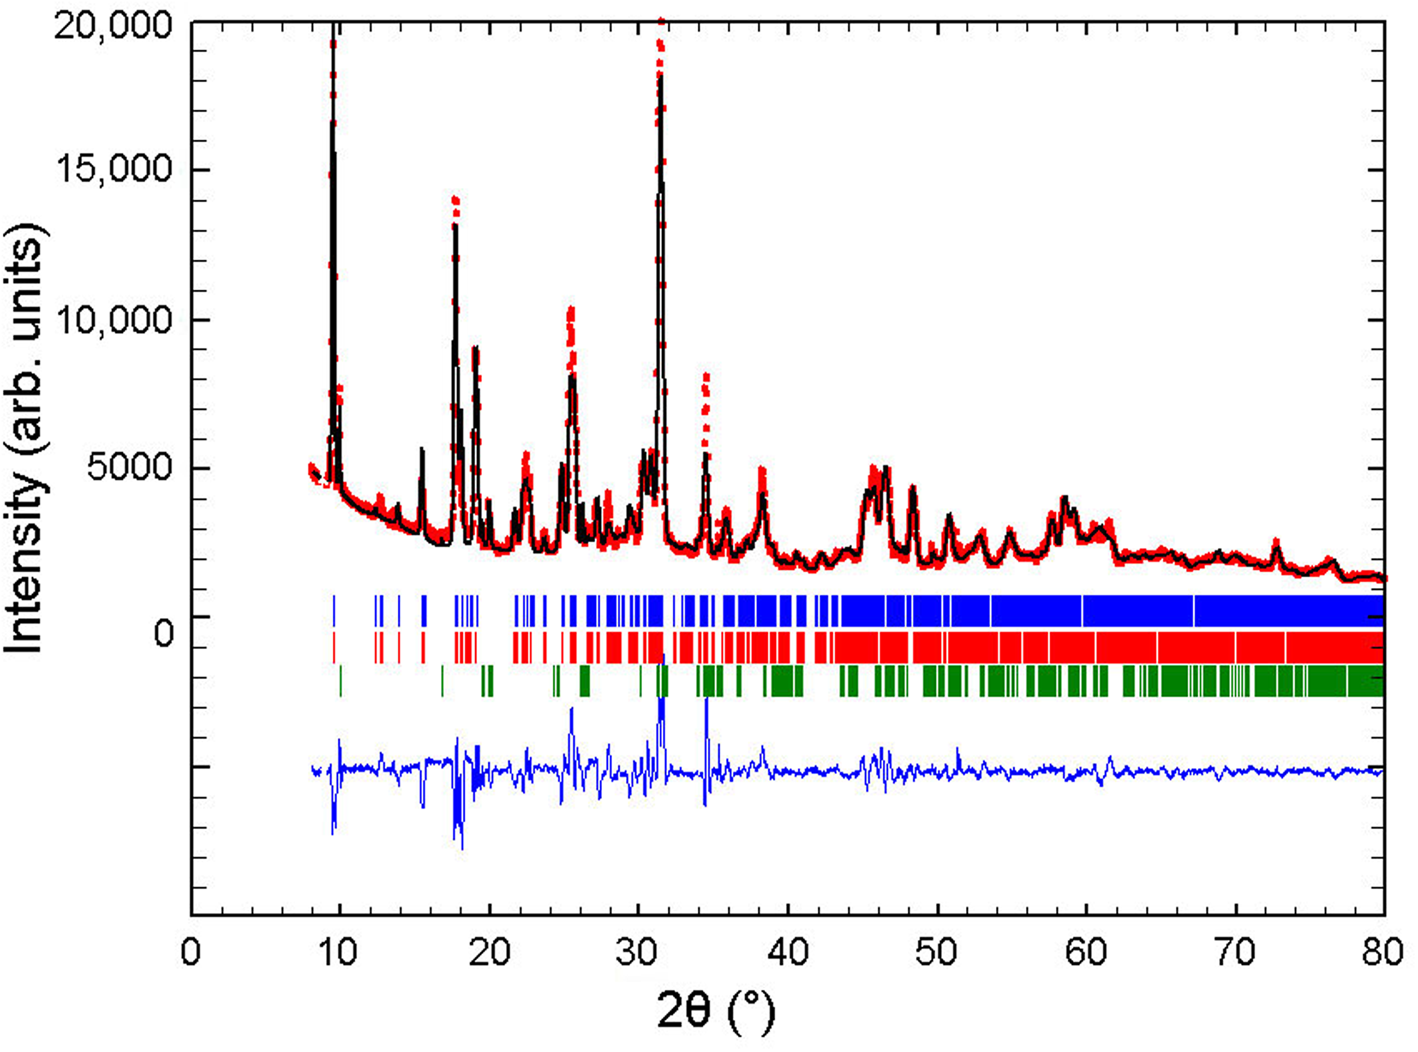
As seen in Fig. 3, the crystals of the new mineral comprise sub-parallel bundles of laths and were not suitable for single-crystal studies. PXRD patterns obtained on different samples of yellow crusts and surface aggregates displayed a consistent feature of splitting of the (00l) reflections (shown in figure 6 of Grey et al., Reference Grey, Keck, MacRae, Glenn, Mumme, Kampf and Cashion2018). The heights of the split components are the same, suggesting that the splitting is due to different c axis lengths for the high-Zn and low-Zn compositions, as there are approximately equal volumes of the two compositions. In order to obtain refined unit-cell parameters for the two compositions, a PXRD data set was obtained in the two-theta range 5 to 80° using a Bruker D8 diffractometer and CuKα radiation and refined using the Rietveld program FULLPROF (Rodriguez-Carvajal, Reference Rodriguez-Carvajal1990).
A three-phase Rietveld input file was prepared containing two separate jahnsite phases and phosphophyllite which was present as a minor impurity phase. The atomic coordinates for jahnsite-(CaMnMg) from Moore and Araki (Reference Moore and Araki1974) were used for both jahnsite phases, with replacement of Mg by Zn in the two M2 sites. The structural parameters were not refined. The refined profile parameters included 24 backgrounds, a zero shift, scales, pseudo-Voigt peak-shape parameters, and two (V and W) Cagliotti width parameters (Cagliotti et al., Reference Cagliotti, Paoletti and Ricca1958). The width and shape parameters for the three phases were constrained to be equal during refinement. The a, b and β cell parameters for the two jahnsite phases were also constrained to be equal, while the c parameters were refined independently. The refinement converged at Rp = 6.7% and Rwp = 9.4%. The Rietveld plot is given in Fig. 7. Application of the quantitative phase analysis function in Fullprof gave the phase composition 46.5(7)% jahnsite-1 + 46.8(7)% jahnsite-2 + 6.7(3)% phosphophyllite.
Rietveld observed (red points) and calculated (black line) PXRD pattern for phases in the yellow crust removed from altered phosphophyllite. Short bars show the positions of Bragg reflections for two jahnsite phases (blue and red) and minor phosphophyllite (green).

The refined cell parameters for the two jahnsite phases are: jahnsite-1: a = 15.059(1), b = 7.1885(6), c = 9.960(2) Å and β = 111.239(8)°; jahnsite-2: a = 15.059(1), b = 7.1885(6), c = 10.031(2) Å and β = 111.239(8)°
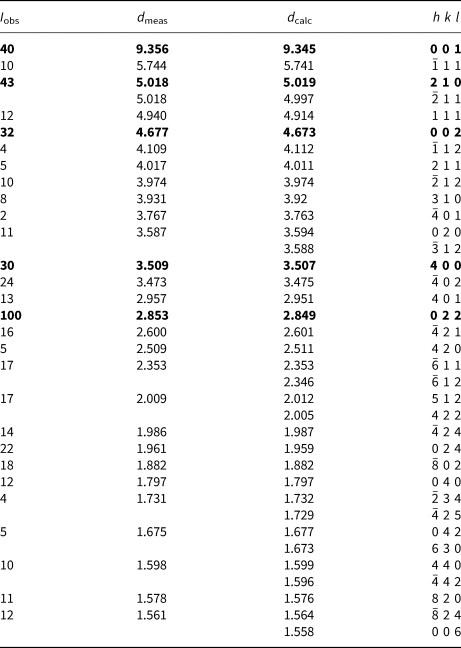
The cell with the larger c parameter closely matches that reported for jahnsite-(MnMnZn) containing dominant Zn in the M2 site (Kampf et al., Reference Kampf, Alves, Kasatkin and Skoda2019), whereas the smaller c parameter is close to the value of 9.966 Å reported for jahnsite-(CaMnMn) by Grice et al. (Reference Grice, Dunn and Ramik1990), and on this basis the larger c-parameter cell is assigned to jahnsite-(CaMnZn). The indexed PXRD pattern for jahnsite-(CaMnZn) is given in Table 3.
Powder X-ray data for jahnsite-(CaMnZn) (d in Å).

The strongest lines are given in bold.
Discussion
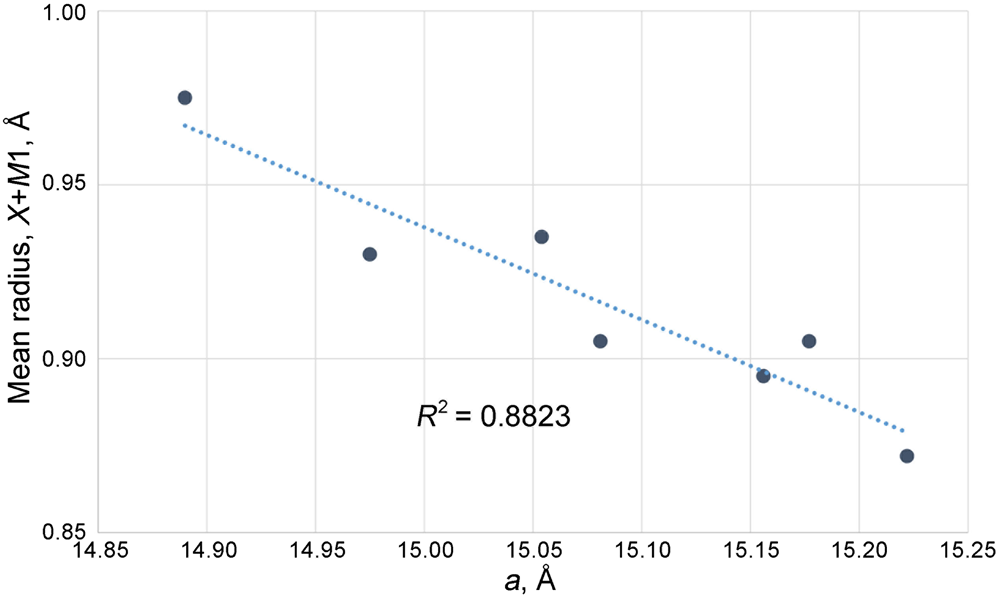
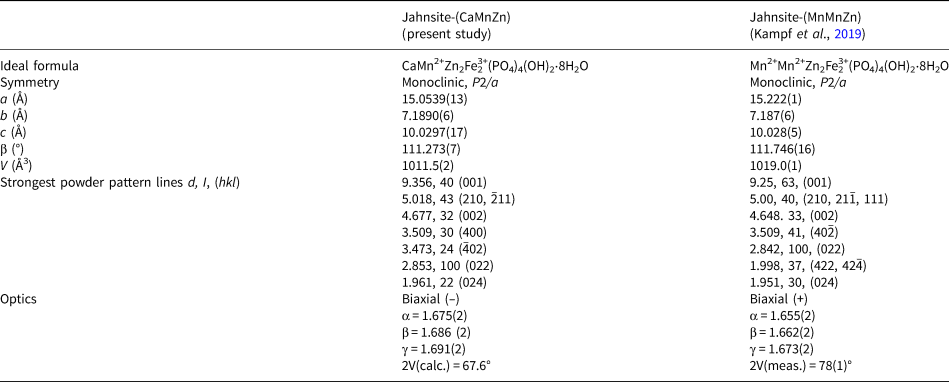
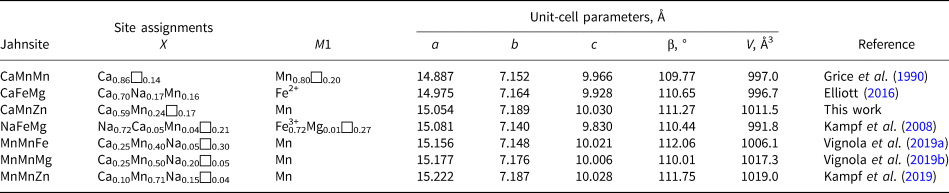
Jahnsite-(CaMnZn) is the second jahnsite-group member to be reported with dominant zinc in the M2 site. A comparison of the properties of jahnsite-(CaMnZn) and jahnsite-(MnMnZn) is given in Table 4. The new mineral has a smaller cell volume, despite having a larger cation in the X site. The smaller volume is due predominantly to a smaller a parameter for jahnsite-(CaMnZn). This counter-intuitive result is consistent with recent single-crystal studies on jahnsite-group members including jahnsite-(MnMnFe) (Vignola et al., Reference Vignola, Hatert, Rotiroti, Nestola, Risplendente and Vanini2019a), jahnsite-(MnMnMg) (Vignola et al., Reference Vignola, Hatert, Baijot, Rotiroti, Risplendente and Varvello2019b) and jahnsite-(CaFeMg) (Elliott, Reference Elliott2016), as well as earlier studies on jahnsite-(NaFeMg) (Kampf et al., Reference Kampf, Steele and Loomis2008) and jahnsite-(CaMnMn) (Grice et al., Reference Grice, Dunn and Ramik1990). The results from these studies, given in Table 5 display a negative correlation between the magnitude of a and the size of the cations occupying the X and M1 sites. In Fig. 8 a is plotted against the average of the ionic radii (Shannon, Reference Shannon1976) of the cations in the X and M1 sites. A clear inverse correlation is obtained with R 2 = 0.88. The correlation extends to the geometric isomer mineral segelerite, Ca2Mg2Fe3+2(PO4)4(OH)2⋅8H2O, where the X and M1 sites are equivalent and both occupied by the large Ca2+. For this mineral a has the smallest value of 14.77 Å (Grey et al., Reference Grey, Mumme, Downes, Grguric and Gable2019b).
Plot of average ionic radius of cations occupying the X and M1 sites, versus the unit cell parameter a, for jahnsite-group minerals.

Comparison of jahnsite-(CaMnZn) with jahnsite-(MnMnZn).

Site assignments for the X and M1 sites, and unit-cell parameters for jahnsite-group minerals.

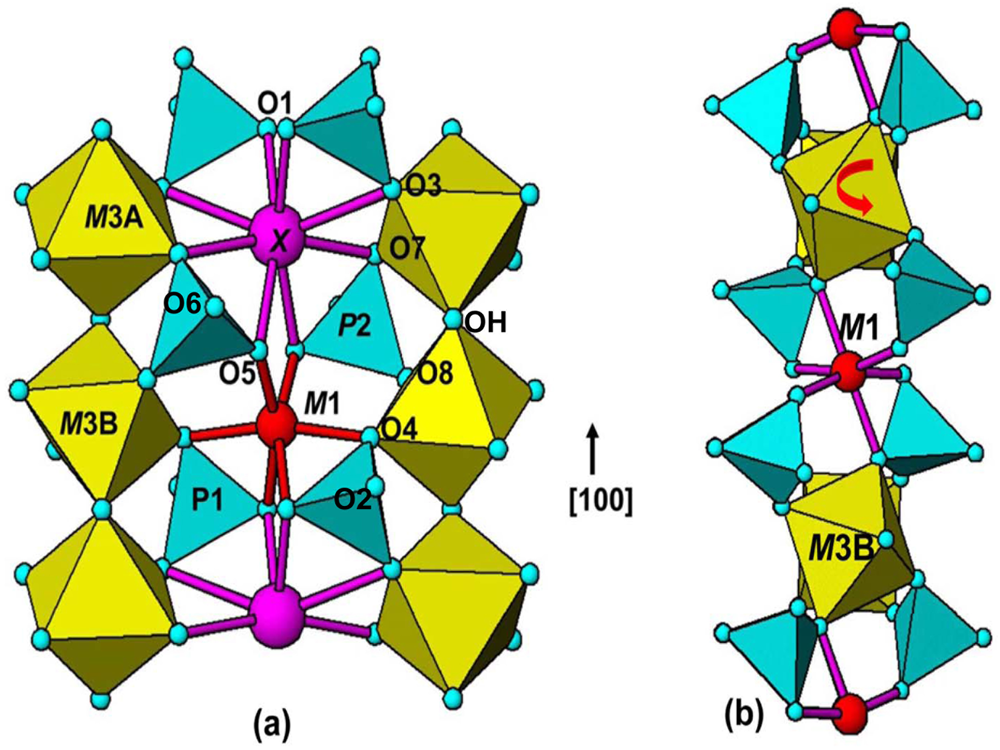
This unusual observation can be explained in terms of rotation of the octahedra centred at the M3 sites. In jahnsite-group minerals the incorporation of different size cations at the X and M1 sites is accommodated by rotation around [010] of the octahedra centred at the M3 sites, as discussed by Grey et al. (Reference Grey, Mumme, Downes, Grguric and Gable2019b) and illustrated in Fig. 9. Octahedra centred at the M3 sites form corner-shared chains along the 7 Å (= b) axis. There are two independent M3 sites, labelled M3A and M3B in Fig. 9a. Cations at the M3A and M3B sites are at the same level along b as cations at the X and M1 sites, respectively. The cation at X has square-antiprismatic coordination and shares edges O3–O7 with the octahedra at M3A. When X is occupied by a large cation such as Ca2+ in jahnsite-(CaFeMg) (Elliott, Reference Elliott2016) the M3A octahedra are only slightly (~5°) rotated about [010] and the distances X–O3 (2.78 Å) and X–O7 (2.50 Å) differ by less than 0.3 Å. In contrast, with a smaller cation like Fe2+ at the M1 site in jahnsite-(CaFeMg), the associated octahedron centred at M3B undergoes a larger [010] rotation of ~15° and the distances to M1 associated with the shared edge O4–O8 deviate by more than 1.2 Å with M1–O4 = 2.13 Å and M1–O8 = 3.37 Å, so M1 achieves octahedral coordination as shown in Fig. 9. In jahnsite-(NaFeMg) (Kampf et al., Reference Kampf, Steele and Loomis2008), the M3B octahedron undergoes a larger rotation of ~20° (Grey et al., Reference Grey, Mumme, Downes, Grguric and Gable2019b) to give octahedral coordination about the small Fe3+ cation. In jahnsite-(MnMnMg) and jahnsite-(MnMnFe) (Vignola et al., Reference Vignola, Hatert, Rotiroti, Nestola, Risplendente and Vanini2019a,Reference Vignola, Hatert, Baijot, Rotiroti, Risplendente and Varvellob) where Mn2+, significantly smaller than Na+ and Ca2+, is located at the X site as well as the M1 site, the octahedra centred at M3A and M3B both undergo rotations of similar magnitude but in the opposite sense, to give octahedral coordination at both sites.
(a) (001) section through the jahnsite structure showing coordination of X and M1. (b) Projection along [010] showing rotation of the octahedron centred at M3B to give octahedral coordination about atom at site M1.

Based on this background the negative correlation between a and the mean size of the cations at X and M1 can be explained. For zero rotation of the M3 octahedra, the length of a is twice the sum of the M3 octahedral edge plus the length of the square antiprism. For Fe3+ in M3 and Ca2+ in X (or M1), a = 2 × (2.8 + 4.5) = 14.6 Å. At the maximum rotation angle of the M3-centred octahedra of 45°, linear chains of corner-connected M3-centred and M1-(or X-) centred octahedra are directed along [100]. The length of a in this case, for Fe3+ in both octahedra is 2 × (4.0 + 4.0) = 16.0 Å. Thus, at any intermediate rotation angle, a will be longer than at zero rotation. Figure 9b shows the case of a rotation angle of ~20°.
The large rotation of the octahedron at M3B to give the small octahedron around M1 when it is occupied by Fe3+ as in jahnsite-(NaFeMg) involves a large expansion along a, and so the X site has to contain a large cation to fit with this expansion. Na+ is considerably larger than Ca2+ and is the dominant X-site cation in jahnsite-(NaFeMg), but the structure is probably highly strained even with Na+ at X. The common occurrence of jahnsite crystals as tiny subparallel laths and the presence of vacancies at X and M1 (see Table 5) may be a reflection of this strain.
The structural flexibility of jahnsite-group minerals to accommodate cations of quite different sizes in the X and M1 sites is due to the octahedra centred at M3A and M3B being able to undergo independent large rotations about [010] with associated tilting of the connected PO4 tetrahedra. This raises the possibility of discovery of new jahnsite species with even smaller cations than Mn2+ at the X site, and with larger cations at the M1 site. Very careful single-crystal studies on good quality crystals will be required to determine if exceptions to the current nomenclature based on decreasing cation sizes in X>M1>M2 are rare or more common.
Acknowledgements
We acknowledge the Diffraction Laboratory at CSIRO Mineral Resources, Clayton, for use of their Panalytical Empyrean powder XRD diffractometer. Thanks to Cameron Davidson for EMP sample preparation and to Finlay Shanks at the School of Chemistry, Monash University, for the infrared spectrum.