Introduction
Land use intensification imposes selection regimes that influence the composition and structure of biotic communities (Echeverría-Londoño et al. Reference Echeverría-Londoño, Newbold, Hudson, Contu, Hill, Lysenko, Arbeláez-Cortés, Armbrecht, Boekhout, Cabra-García, Dominguez-Haydar, Nates-Parra, Gutiérrez-Lamus, Higuera, Isaacs-Cubides, López-Quintero, Martinez, Miranda-Esquivel, Navarro-Iriarte, Noriega, Otavo, Parra-H, Poveda, Ramirez-Pinilla, Rey-Velasco, Rosselli, Smith-Pardo, Urbina-Cardona and Purvis2016). Species that are able to adapt, or even prosper, in anthropogenic landscapes, are subject to environmental filters that lead to changes in the frequency of phenotypes across populations (Alberti et al. Reference Alberti, Marzluff and Hunt2017). That is, human environments might promote directional selection processes that alter the ecomorphological traits of the species (e.g., Puckett et al. Reference Puckett, Sherratt, Combs, Carlen, Harcourt-Smith and Munshi-South2020), i.e., morphological traits that covariate with the environment and are relevant for species adaptation (Wainwright & Reilly Reference Wainwright and Reilly1994). This pattern has been increasingly documented in several vertebrates such as lizards (Lazić et al. Reference Lazić, Kaliontzopoulou, Carretero and Crnobrnja-Isailović2013, Hall & Warner Reference Hall and Warner2017, Putman & Tippie Reference Putman and Tippie2020), small non-volant mammals (Snell-Rood & Wick Reference Snell-Rood and Wick2013, Puckett et al. Reference Puckett, Sherratt, Combs, Carlen, Harcourt-Smith and Munshi-South2020), bats (Tomassini et al. Reference Tomassini, Colangelo, Agnelli, Jones and Russo2014), birds (Liker et al. Reference Liker, Papp, Bókony and Lendvai2008, Caizergues et al. Reference Caizergues, Charmantier, Lambrechts, Perret, Demeyrier, Lucas and Grégoire2021), and medium-sized carnivores (Parsons et al. Reference Parsons, Rigg, Conith, Kitchener, Harris and Zhu2020). Nevertheless, most studies focused on comparing populations between discrete categories of land use intensification, for example, urban vs. rural, ignoring the role of landscape emergent properties and the spatial scales that better correlate with phenotypic changes of fauna (Strubbe et al. Reference Strubbe, Salleh Hudin, Teyssier, Vantieghem, Aerts and Lens2020). This is known as the scale of effect, a conceptual framework developed to study the spatial extent to which landscape variables better predict biological responses (Martin & Fahrig Reference Martin and Fahrig2012, Miguet et al. Reference Miguet, Jackson, Jackson, Martin and Fahrig2016).
New World bats of the family Phyllostomidae constitute an ideal model to study landscape transformation effects on species’ phenotype, since it includes several species that are tolerant to habitat transformation (Meyer et al. Reference Meyer, Struebig, Willing, Voigt and Kingston2016, Farneda et al. Reference Farneda, Meyer and Grelle2020), and they are highly variable in ecomorphological traits that drive their adaptation to environmental change (Soriano Reference Soriano2000, Farneda et al. Reference Farneda, Rocha, López-Baucells, Groenenberg, Silva, Palmeirim, Bobrowiec and Meyer2015). Physical constraints on phyllostomids’ wing morphology and body size impose aero-dynamical restrictions to exploit open or cluttered environments (Farneda et al. Reference Farneda, Rocha, López-Baucells, Groenenberg, Silva, Palmeirim, Bobrowiec and Meyer2015, Wordley et al. Reference Wordley, Sankaran, Mudappa and Altringham2017). That is, phyllostomid species with low wing aspect ratio and low wing loading are adapted to slow and manoeuvrable flight in structurally complex habitats with dense vegetation (Marinello & Bernard Reference Marinello and Bernard2014). Consequently, they are expected to be highly sensitive to habitat loss and disruption. Alternatively, bats with high wing aspect ratio and high wing loading can fly at a high speed and are aerodynamically efficient in open areas (Norberg & Rayner Reference Norberg and Rayner1987, Marinello & Bernard Reference Marinello and Bernard2014). Thus, they are thought to be better adapted to survive in deforested landscapes (Wordley et al. Reference Wordley, Sankaran, Mudappa and Altringham2017). These theoretical predictions have been empirically corroborated in several Neotropical locations (e.g., Meyer & Kalko Reference Meyer and Kalko2008, Jung & Kalko Reference Jung and Kalko2010, Farneda et al. Reference Farneda, Rocha, López-Baucells, Groenenberg, Silva, Palmeirim, Bobrowiec and Meyer2015, Ramírez-Mejía et al. Reference Ramírez-Mejía, Urbina-Cardona and Sánchez2020). However, most studies focused on the phyllostomid trait responses at the assemblage or trophic guild level (Gonçalves et al. Reference Gonçalves, Fischer and Dirzo2017, Brändel et al. Reference Brändel, Hiller, Halczok, Kerth, Page and Tschapka2020, Farneda et al. Reference Farneda, Meyer and Grelle2020) and overlook the potential intraspecific consequences of landscape transformation on bats’ ecomorphological traits.
Individuals within a phyllostomid population maximize the use of the space by adapting intraspecific foraging movements depending on food location and environment variability (see Kerches-Rogeri et al. Reference Kerches-Rogeri, Niebuhr, Muylaert and Mello2020). Therefore, bats of a population inhabiting a spatially heterogeneous landscape, such as those created by humans, might face different environmental pressures on their ecomorphological traits that determine their space use compared to those living in wild environments. Few works have attempted to explore the relation between intraspecific ecomorphological traits of phyllostomids and environmental gradients at large geographical scales (see Marchán-Rivadeneira et al. Reference Marchán-Rivadeneira, Larsen, Phillips, Strauss and Baker2012, Stevens et al. Reference Stevens, Johnson and Mcculloch2016), and none have explicitly incorporated landscape effects such as habitat amount or deforestation. Thus, we studied how landscape transformation—the process of natural cover replacement—and spatial scale modulate the intraspecific variation of the ecomorphological traits of a phyllostomid bat. We used as a model the flat-faced fruit-eating bat, Artibeus planirostris (Spix Reference Spix1823), a common phyllostomid species in human-altered environments in the Neotropics (Jara-Servín et al. Reference Jara-Servín, Saldaña-Vázquez and Schondube2016, Saldaña-Vázquez & Schondube Reference Saldaña-Vázquez and Schondube2016). This fruit bat is relatively large, weighing 40 – 69 g (Hollis Reference Hollis2005), feeding in the canopy on fruiting trees with asynchronous, massive, and short duration production, e.g., Ficus spp. (Soriano Reference Soriano2000). This bat regularly roosts in the foliage and changes shelter according to fruiting trees availability; thus, its home range is expected to be large and variable (Soriano Reference Soriano2000, Hollis Reference Hollis2005).
In this work, we tested the hypothesis that forest replacement leads to the environmental filtering of inter-individual variation in bats’ phenotypes based on their flight performance. Therefore, we predict that non-forested areas, such as anthropogenic grasslands and urban areas, will positively affect the average body mass and wing traits of A. planirostris, since those traits correlate with the bats’ ability to exploit open environments (Jung & Threlfall Reference Jung, Threlfall, Voigt and Kingston2016, Meyer et al. Reference Meyer, Struebig, Willing, Voigt and Kingston2016). In addition, since large Artibeus species tend to thrive in Neotropical anthropogenic areas (Saldaña-Vázquez & Schondube Reference Saldaña-Vázquez and Schondube2016), we expect that the abundance of A. planirostris will be positively affected by forest loss. Nightly foraging movements of Artibeus lituratus—a close relative of, and morphologically similar species to, A. planirostris—in deforested areas range from ∼600 to ∼2000 m (1158.8 ± 598.6 m, see Table 1 in Trevelin et al. Reference Trevelin, Silveira, Port-Carvalho, Homem and Cruz-Neto2013). Accordingly, we expect A. planirostris’ abundance to be affected by landscape transformation at 500 m and 2000 m. However, since the average foraging movement of A. lituratus is estimated at around 1000 m (Trevelin et al. Reference Trevelin, Silveira, Port-Carvalho, Homem and Cruz-Neto2013), we expect that the landscape effect will be particularly strong at this intermediate scale. Finally, if landscape transformation modulates the abundance of A. planirostris at particular spatial scales, which has been reported for closely related species (see Gorresen et al. Reference Gorresen, Willing and Strauss2005, Pinto & Keitt Reference Pinto and Keitt2008, Farneda et al. Reference Farneda, Rocha, López-Baucells, Groenenberg, Silva, Palmeirim, Bobrowiec and Meyer2015), this probably reflects on the selection of certain phenotypes under different environmental scenarios (Bolnick et al. Reference Bolnick, Svanbäck, Fordyce, Yang, Davis, Hulsey and Forister2003). Hence, we predict that landscape predictors at a similar spatial scale will mainly explain abundance and ecomorphological traits.
Best-fitted generalized linear mixed effect models explaining changes in Artibeus planirostris abundance and its ecomorphological traits in an urban–rural landscape of the Colombian Orinoquia. Bold numbers of t-statistics denote that the parameter is significantly different from zero. Bold numbers of F-statistics denote that the parameter significantly (p<0.05) reduced the model’s deviance. M: male, F: female

Methods
Study area
We tested our hypotheses on an urban–rural gradient on the Andean piedmont of the Llanos Orientales of Colombia, in the most densely populated and urbanized zone in the Colombian Orinoco, the Villavicencio municipality. The Andes piedmont is a transition area between the Orinoco savannahs and Andean ecosystems (Rangel et al. Reference Rangel, Lowy and Aguilar1997), and it has experienced profound anthropogenic land cover changes since the early 1950s (Etter et al. Reference Etter, McAlpine and Possingham2008, Correa Ayram et al. Reference Correa Ayram, Etter, Díaz-Timoté, Rodríguez Buriticá, Ramírez and Corzo2020). Currently, the landscape of this region is a mosaic of a continuous urban core, scattered suburban settlements, forest remnants, and agricultural systems embedded in an extensive anthropogenic grassland matrix (Romero-Ruiz et al. Reference Romero-Ruiz, Flantua, Tansey and Berrio2012, Sánchez-Cuervo et al. Reference Sánchez-Cuervo, Aide, Clark and Etter2012). The rainy season occurs between April and October, whereas the low precipitation season takes place between November and March with an annual mean rainfall of ∼2,600 mm (Bernal et al. Reference Bernal, Peña, Díaz and Obando2013). The natural vegetation has been described as a rainforest with a strong influence of the Andean piedmont, mixed with wetlands and savannahs (Bates Reference Bates1948, Blydenstein Reference Blydenstein1967, Rangel et al. Reference Rangel, Lowy and Aguilar1997).
Bat sampling
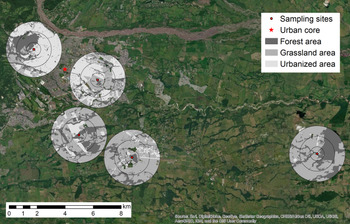
Along Villavicencio’s urban–rural gradient, we made a non-random selection of five sites to maximize the variability of predictor variables while reducing the spatial autocorrelation among landscape units, LU (Figure 1). Hereafter, LU refers to a set of concentric circles—see details in land use classification—in which we measured landscape composition and structure; and site refer to the sampling units (i.e., mist nets) located at the centroid of each LU (Figure 1). We chose sites that had enough tree cover to place mist nets to capture bats (the canopy cover above mist nets at all sites was >80%), and a linear separation of at least 4.3 km (mean ± SD, 6.6 ± 4.4 km) between nearest sampling sites to avoid LUs overlap (Figure 1). We visited each site five times between January and July of 2016, those visits were evenly distributed through the season, setting two to three 12×3m mist nets during nights with moon illumination levels below 60% and favourable weather conditions (Rowse et al. Reference Rowse, Lewanzik, Stone, Harris, Jones, Voigt and Kingston2016). We used a rabbit tattoo to individually mark each bat with a unique numerical code (Powell & Proulx Reference Powell and Proulx2003) to guarantee the independence of bat captures. We placed the tattoo in the lower part of the plagiopatagium of the right wing. Sampling effort at each site ranged from 432 to 504 m2 nights−1, and the total sampling effort was 2,304 m2 nights−1.
Landscape units (LU) in an urban–rural landscape in Villavicencio, Colombian Orinoco basin. We sampled bats at the centroid of each concentric circle (sampling sites). Concentric circles at each LU set the limits of each spatial scale (0.5, 1.25, and 2 km of radius) in which landscape variables were measured.

Ecomorphological traits
We considered four morphological traits related to the bats’ flight performance: wing loading, wing aspect ratio, body mass, and forearm length. Wing loading and wing aspect ratio are mainly related to flight speed and manoeuvrability (Marinello & Bernard Reference Marinello and Bernard2014), whereas forearm length and body mass are mainly associated with phyllostomid flight speed (Morrison Reference Morrison1980, Winter Reference Winter1999). We used a 0.01 mm resolution caliper to measure forearm length following Díaz et al. (Reference Díaz, Solari, Aguirre, Aguiar and Barquez2016) and measured body mass using a digital balance of 0.1 g resolution. Wing loading and wing aspect ratio were measured from a photograph of the left wing fully extended in a ventral position against a paper with millimetre scale (Korine & Pinshow Reference Korine and Pinshow2004). These images were processed using ImageJ 1.6 (Abramoff et al. Reference Abramoff, Magalhaes and Ram2004) to measure wingspan and wing area as described by Norberg & Rayner (Reference Norberg and Rayner1987). Finally, we calculated the wing aspect ratio as the quotient of the wingspan squared and wing area and estimated wing loading dividing the body mass by the product of gravitational acceleration, 9.81 m·s−2, and wing area (Norberg & Rayner Reference Norberg and Rayner1987). We only measured morphological traits of adults and non-pregnant females.
Land use classification
We delimited concentric buffers of 0.5, 1.25, and 2 km (local, intermediate, and large spatial scales, respectively) of radius around the sampling sites to characterize landscape composition and structure (Miguet et al., Reference Miguet, Jackson, Jackson, Martin and Fahrig2016). These spatial scales were expected to encompass the minimum, maximum, and average foraging movements reported for another closely related Artibeus species (see Trevelin et al., Reference Trevelin, Silveira, Port-Carvalho, Homem and Cruz-Neto2013). We performed a classification on ArcGIS 10.1, using DigitalGlobe satellite images taken between 2014 and 2015 with a 2 m2 pixel−1 resolution (Google Earth 2016), to generate maps with three land uses: built area, anthropogenic grassland, and native forest (Figure 1). At each spatial scale, we measured the percentage of built-up areas, grassland, and forest cover, the number of forest patches, mean forest patch size, forest patch size standard deviation, and density of forest patches (Mendes et al., Reference Mendes, With, Signorelli and De Marco2016; Pinto & Keitt Reference Pinto and Keitt2008). We did not consider other land uses and landscape elements (e.g., crops, water bodies, or bare ground) in the analysis, because they covered less than 5% of each area at a 2 km radius, and they were not present in each LUs (Figure 1). After correlation analyses, we excluded landscape collinear variables and retained as predictors, grass cover at 0.5 and 2 km scales, and forest percentage at 0.5 and 1.25 km (Figure S1).
Data analyses
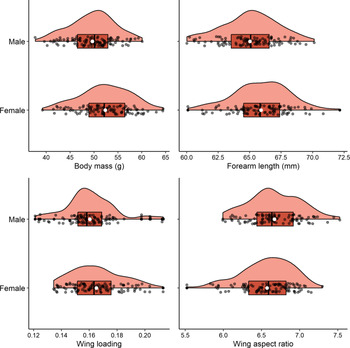
We performed Pearson’s correlations among landscape predictors to exclude highly correlated predictor variables from further analyses, that is, those with r > 0.7 (Quinn & Keough Reference Quinn and Keough2002). We used generalized linear mixed models (GLMM) to analyse changes in abundance and ecomorphological traits of A. planirostris as a function of landscape metrics. The first model included abundance (counts) of A. planirostris as the response variable, that is, the number of captures by sampling visit in each site, and the landscape variables at different scales as predictor variables. In subsequent models, we used as response variables the average value of each ecomorphological trait by sex, from the individuals captured in each landscape unit. As predictors, we used the landscape variables at several spatial scales and fixed the bats sex as an interaction term of all predictor variables to account for sexual dimorphism (Figure 2). We included the log-transformed number of captured individuals of each sex as an offset variable in these models, to consider the potential effect of the sample size on the estimation of the average value of morphological traits (Zuur et al. Reference Zuur, Ieno, Walker, Saveliev and Smith2009). In all models, we used the LU as a random term to account for potential spatial autocorrelation issues (Rhodes et al. Reference Rhodes, McAlpine, Zuur, Smith, Ieno, Zuur, Ieno, Walker, Saveliev and Smith2009). We evaluated the fit of A. planirostris abundance and morphological traits to normal, log-normal, gamma, Poisson, or negative binomial distributions—according to the case—using the package fitdistrplus of R 3.6.3 (Delignette-Muller & Dutang Reference Delignette-Muller and Dutang2015, R Core Team 2021). We used z-scores of non-correlated predictor variables to compare parameter importance in the model (Marquardt Reference Marquardt1980) and fitted all models using the lme4 package (Bates et al. Reference Bates, Maechler, Bolker and Walker2015). We estimated p-values of models’ parameters via Satterthwaite’s degrees of freedom method with the lmerTest package (Kuznetsova et al. Reference Kuznetsova, Brockhoff and Christensen2017) and calculated the conditional and marginal R2 of each model using the MuMin package (Bartón Reference Bartón2016). Finally, for model selection, we applied a likelihood ratio test (Lewis et al. Reference Lewis, Butler and Gilbert2011), and we validated the model fit using graphical analysis of residuals. We did data wrangling and plotted partial residuals of best-fitted models using R’s base functions and the packages dplyr, cowplot, and ggplot2 (Wickham Reference Wickham2016, Breheny & Burchett Reference Breheny and Burchett2017, Wilke Reference Wilke2019, Wickham et al. Reference Wickham, François, Henry and Müller2020).
Boxplots and density plots of Artibeus planirostris ecomorphological traits in an urban–rural landscape of the Colombian Orinoco basin. Black dotes: observations. White dotes: average value of the trait.

Results
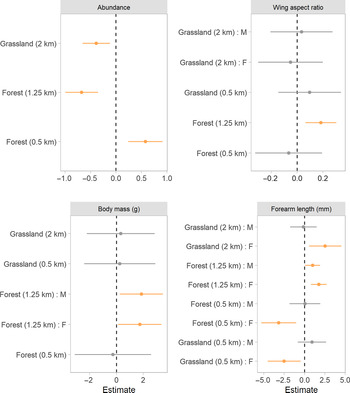
We captured 232 individuals of A. planirostris and measured the ecomorphological traits of 216 adult males and non-pregnant females (Figure 2). During the sampling, we recorded two recaptures in two LU, and both times, recaptured bats were found at their original LU. For additional details regarding sampling and the phyllostomid assemblage recorded, see Table S1. All response variables fitted a normal or log-normal distribution (link function = identity), and the correlation coefficients of morphological response variables were below 0.5 (Figure S2). The abundance of A. planirostris was explained by landscape predictors at all spatial scales (Figure 3). The percentage of forest at 1.25 km negatively affected the abundance and was the most important variable in the model, followed by forest at 0.5 km and grassland at 2 km (Figure 3, Table 1). The model explained 42.58% of the A. planirostris abundance (42.58% marginal R2 and 42.58% conditional R2). Residual analysis showed that the fitted models meet the normality assumptions (Figure S3).
Best-fitted generalized linear mixed effect models explaining changes in Artibeus planirostris abundance and ecomorphological traits, in an urban–rural landscape of the Colombian Orinoco basin. Orange coefficient (dots) and confidence interval (horizontal lines) indicate that the slope is statistically different from zero and the parameter significantly reduced the model’s deviance. M: male. F: female.

The best-fitted model explaining wing aspect ratio variation included grassland at 0.5 and 2 km, and forest at 0.5 and 1.25 km scales; however, only forest percentage at 1.25 km had a significant positive effect (Figure 3). This model explained 27.65% of the total variation (27.65% marginal R2 and 27.65% conditional R2). Forest percentage at the 1.25 km scale also explained changes in body mass (Figure 3). This predictor had a positive effect on both males and females (Figure 3). The model also included non-significant predictors and explained 20.82% of the total variation (20.82% marginal R2 and 20.82% conditional R2). Forearm length of A. planirostris was significantly affected by landscape variables at all spatial scales, and these effects were sex-dependent (Figure 3, Table 1). The forearm length was positively associated with forest percentage at 1.25 km, but the effect tended to be higher for females (Figure 3). Forest and grassland percentages at 0.5 km negatively affected the forearm length of females, whilst it did not show a significant relation for males (Figure 3). Similarly, the grass percentage at 2 km had a positive effect on females’ forearm length, but no effect for males (Figure 3). Forest percentage at 0.5 km was the most important variable in the model, followed by the grass percentage at 0.5 and 2 km scales, and the forest percentage at 1.25 km (Table 1). This model explained 32.76% of the total variation (32.76% marginal R2 and 32.76% conditional R2). Residuals of all fitted models of ecomorphological traits did not show deviations from the assumption of normality (Figures S4 – S6), except for wing loading and we did not further consider it.
Discussion
Our results support the hypothesis that forest replacement leads to environmental filtering of inter-individual variation of bats’ phenotypes, specifically the ecomorphological traits related to flight performance. Indeed, we found that landscape transformation operates at particular spatial scales to affect phenotype and the abundance of an urban-tolerant phyllostomid species. The data support two of the three predictions evaluated in this study. As expected, forest cover at 1.25 km was the most important predictor variable, negatively affecting A. planirostris abundance, and changes in abundance and ecomorphological traits were best predicted at the same spatial scale by the forest cover. Body mass, wing aspect ratio, and forearm length were positively related to forest cover at 1.25 km, which was contrary to our initial expectation (Figure 3 and Figure S7). Remarkably, effects of grassland and forest cover on forearm length varied depending on the spatial scale and its interaction with sex, reflecting the complexity of landscape effects on the inter-individual phenotype variation in A. planirostris.
Our results are in agreement with the general pattern that forest loss tends to increase the abundance of generalist phytophagous phyllostomids (Saldaña-Vázquez & Schondube Reference Saldaña-Vázquez and Schondube2016, Gonçalves et al. Reference Gonçalves, Fischer and Dirzo2017, Farneda et al. Reference Farneda, Meyer and Grelle2020). Bats of the Artibeus genus commonly feed on fruits of Ficus spp. and Cecropia spp. trees (e.g., Saldaña-Vázquez et al. Reference Saldaña-Vázquez, Sosa, Iñiguez-Dávalos and Schondube2013). These plants are common in the anthropogenic matrix of the landscape we studied and were reported as the main food items of A. planirostris in the same area (Ramírez-Mejía Reference Ramírez-Mejía2017). The spatial distribution of these food resources and the nightly foraging movements of the individual bats likely explain the abundance patterns that we found. In anthropogenic landscapes, the average nightly movement of A. lituratus is about 1158 m and may range between 418 and 2053 m (see Figure 1 and Table 1 in Trevelin et al. Reference Trevelin, Silveira, Port-Carvalho, Homem and Cruz-Neto2013). Hence, assuming that A. planirostris and A. lituratus have similar movement capabilities, as expected by their similar ecomorphological traits, this can explain the strong scale of effect at 1.25 km, since this spatial scale is likely to encompass A. planirostris average foraging range (Gorresen et al. Reference Gorresen, Willing and Strauss2005, Trevelin et al. Reference Trevelin, Silveira, Port-Carvalho, Homem and Cruz-Neto2013). We found a change in the direction of the effect of forest cover on the abundance from the 0.5 km to the 1.25 km scale. This suggests that at local scales A. planirostris requires enough forest cover to provide roosting sites and food resources (Mendes et al. Reference Mendes, With, Signorelli and De Marco2016), whereas at the larger extent the forest cover may reduce its opportunity to exploit available fruit resources in the deforested matrix (Torres et al. Reference Torres, Dos Anjos and Ferreira2018). Besides, the negative relationship with grass cover at the largest scale, 2 km, suggests a detrimental effect of extremely deforested landscapes on the abundance even for long-distance dispersal bats such as A. planirostris (Meyer et al. Reference Meyer, Struebig, Willing, Voigt and Kingston2016).
Changes in abundance and ecomorphological traits of A. planirostris were mostly predicted by the same landscape factors and spatial scales. This pattern probably arises since individuals’ abundance can reflect the variation in phenotype prevalence under different selection regimes, in our case landscape scenarios (Bolnick et al. Reference Bolnick, Svanbäck, Fordyce, Yang, Davis, Hulsey and Forister2003). Indeed, wing aspect ratio, body mass, and forearm length were positively affected by forest cover at 1.25 km regardless of the sex. These results seem counterintuitive—empirical evidence at the community level points to an opposite trend (Jung & Threlfall Reference Jung, Threlfall, Voigt and Kingston2016, Meyer et al. Reference Meyer, Struebig, Willing, Voigt and Kingston2016)—and it is likely the result of the particular structure of our urban–rural landscape. The forest area among the LUs at 1.25 km scales ranged from 14% to 42%, which, in most cases, corresponded to a few large forest patches. This particular spatial arrangement of natural habitats leads to a large percentage of non-forest area that is probably used by A. planirostris, in which case a large body and large-pointed wings may result advantageous (Norberg & Rayner Reference Norberg and Rayner1987). Indeed, there should be trade-offs that limit the individual specialization of A. planirostris to use open environments, without reducing its opportunity to exploit food and roosting resources in structurally complex forests (Bolnick et al. Reference Bolnick, Svanbäck, Fordyce, Yang, Davis, Hulsey and Forister2003). Thus, the positive relation between forest cover and flight performance traits may mask the underlying complexity of trade-offs regarding bats’ phenotypic response. This interpretation is speculative and deserves further exploration involving trait morphology data, a wider range of forest loss scenarios, and a direct evaluation of how bats differentially use multiple land cover types in anthropogenic landscapes.
Unlike other ecomorphological traits, both forest and grassland cover affected the female’s forearm length at all spatial scales of our analysis. Particularly, forest cover at 0.5 km showed the strongest negative effect. Pregnancy state and the transportation of newborn offspring might impose different aerodynamic challenges for female and male bats (Camargo & Oliveira Reference Camargo and Oliveira2012); that is, during particular reproductive stages, flight related-traits in phyllostomid bats may experience different intensity of selective pressures depending on the individual’s sex. Female A. planirostris individuals with short forearm lengths should have slower and more manoeuvrable flight than females with long forearms, which is advantageous in structural complex forested areas (Morrison Reference Morrison1980, Stockwell Reference Stockwell2001). Natural areas are likely fundamental for offspring shelter and access to more diverse food resources during the lactation period (Durant et al. Reference Durant, Hall, Cisneros, Hyland and Willig2013). On the contrary, the positive relation between female forearm lengths and grassland cover, at 2 km scale, could be due to the selection of an aerodynamic efficient flight in non-forest areas. The positive association of bats’ forearm length and flying speed has been extensively documented at the community level (Hayward & Russell Reference Hayward and Russell1964, Morrison Reference Morrison1980, Winter Reference Winter1999) and, similarly, might be crucial to overcome cleared environments while foraging in the anthropogenic matrix.
To our knowledge, our study evaluates for the first time the scale of effect that best predicts phenotypic changes of a phyllostomid species in an anthropogenic landscape. We suggest that incorporating the multivariate nature of wing morphology can bring more detailed and valuable insights to understand how flight-related ecomorphological traits of bats are shaped by landscape filtering, for example by using morphometric geometry (De Oliveira et al. Reference De Oliveira, Camargo, Hemprich-Bennett, Rodríguez-Herrera, Rossiter and Clare2020). Evidence from other phyllostomid species indicates that landscape transformation may impact the genetic diversity of populations depending on their movement capabilities (Meyer et al. Reference Meyer, Kalko and Kerth2009). This type of information joined with morphological data might shed light on how the response of A. planirostris is driven by natural phenotypic plasticity or, by contrast, is the result of microevolutionary processes associated with landscape anthropization (Alberti et al. Reference Alberti, Marzluff and Hunt2017). Further studies incorporating morphology and bat trophic interactions will undoubtedly broaden our understanding of the effects of morphological inter-individual variation with the species ecosystem function. Particularly, there might be differences in the diet of bats with different wing morphologies and, therefore deforestation may affect the role of bats as seed dispersers in Neotropical urban and rural areas (Bredt et al. Reference Bredt, Uieda and Pedro2012).
Supplementary material
To view supplementary material for this article, please visit https://doi.org/10.1017/S026646742100047X
Acknowledgments
Three anonymous reviewers made helpful comments that improved the manuscript. We would like to thank Natacha Chacoff, Tobías Rojas and Irene M. A. Bender for her constructive revision of the paper. We had discussions with Lilia Roa and María Ángela Echeverry-Galvis that enriched the project’s conceptual development. We are grateful to the members of the Grupo de Mamíferos Silvestres - Unillanos for their field assistance. During the preparation of the paper, Andrés F. Ramírez-Mejía was funded by a Ph.D. fellowship awarded by the Consejo Nacional de Investigaciones Científicas y Técnicas de Argentina (CONICET).
Authors contribution
FS acquired financial support. AFRM and FS conceived and conceptualized the initial idea. AFRM, NUC, and FS made the sampling design. AFRM and FS did the fieldwork. FS provided laboratory resources and field equipment to collect the data. AFRM, FS, and NUC analysed the data. AFRM wrote the first draft; FS and NUC critically reviewed and edited the manuscript.
Financial support
This work derives from the project ‘Diversidad funcional y servicios ecosistémicos de los murciélagos frugívoros e insectívoros en un paisaje de la Orinoquia’, funded by the Universidad de los Llanos (C03-F02-31-2015).
Competing interests
The authors declare none.
Ethical statement
We worked under permit 1313, of October 16, 2016, by the Colombian National Authority of Environmental Licenses (ANLA).