Introduction
The Italian red deer population has grown in size and has increased its geographical distribution during the past three decades, partly due to spontaneous recolonization by immigration of animals from Switzerland and Austria, and also re-introduction programmes (Mattioli et al., Reference Mattioli, Meneguzio, Brugnoli and Nicolosi2001). The estimated population size is 44,000 animals with 26% in the western and central portions of the Alps, 51% in the central-eastern Alps, 12% in the northern Appenine, 3% in the middle Appenine and 6% in Sardinia (Mustoni et al., Reference Mustoni, Pedrotti, Zanon and Tosi2002). The most numerous populations are in the Trento province, with an estimate of 7180 deer and a medium density of 2.08 individuals/100 ha.
Considering that only limited data on the helminth population of Italian red deer are available, the aim of the present study was to evaluate the composition of the abomasal nematode fauna in a protected area of the eastern Alps (Stelvio National Park), and to estimate parasite diversity in red deer populations living in different sectors of the park. The results contribute to the knowledge on the health of red deer in the Alps, and provide useful information on the management of ruminants in these areas.
Materials and methods
Study area
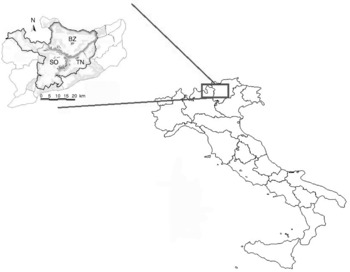
The Stelvio National Park covers an area of 134,620 ha in the centre of the Alpine ridge (fig. 1). The territory of the park borders on the Engadina National Park (Switzerland), Adamello-Brenta Natural Park and Orobie Regional Park in Italy and, together with the last two areas, forms one of the most important protected wilderness areas in southern Europe.
The location of Stelvio National Park with the three main geographical areas in north-eastern Italy: BZ, Bolzano; SO, Sondrio; TN, Trento.

Stelvio National Park is formed by areas from two regions (Lombardia, Trentino Alto Adige) and four provinces. The altitude varies from 650 to 3905 m above sea level, and has typical features of protected alpine areas; up to 73% of the area is over 2000 m above sea level, while only 9% is less than 1500 m above sea level. Up to 44% of the area occurs at high altitude, 29% comprises alpine pastures, 26% is covered by wooded areas and 4% by agricultural activity and cut fields. Red deer are widespread in the park, with around 7500 deer being estimated to be present, thus representing 30% of the Italian alpine population. Deer densities differ for each area because of different territorial features. The Bolzano sector, composed mainly of a few valleys, is less favourable for red deer because of a lower ratio of pasture:woods, a lower fir:wood ecotone index, and the shortage of slopes facing south assuring a shorter persistence of snow and a significant increase in the food supply during the winter. Red deer densities in the park, based on estimates made in 2000 (Pedrotti & Fraquelli, Reference Pedrotti and Fraquelli2001) ranged from 3 to 11 red deer/km2 (with 3–8 in the Bolzano (BZ), 5 in the Sondrio (SO), and 11 in the Trento (TN) sectors).
Sample collection
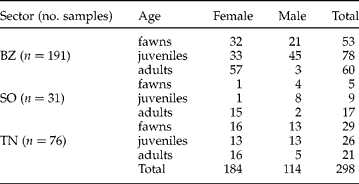
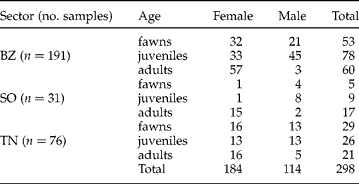
From 1997 to 2000, abomasa from 298 red deer were collected from BZ (Media Venosta-Martello Valley), SO (Valfurva, Sondalo, and in the management unit of Valdidentro, Livigno, Val Viola) and TN (Alta Val di Sole) sectors (table 1; fig. 1). Movement of red deer between these valleys is thought to be unlikely and we refer to these locations as separate populations (Pedrotti & Fraquelli, Reference Pedrotti and Fraquelli2001). Data were analysed according to sampling areas and groups of deer referred to as BZ (n = 191), SO (n = 31) and TN (n = 76). All deer (184 females and 114 males) were culled from September throughout December and 20 deer were found dead. Host age was determined by tooth eruption/wear and they were grouped into three age-classes: fawns (Fa; first winter), juveniles (J; second to third winter) and adults (A). The following measurements were made: mandible length (ML), weight (W), perikidney fat weight (P) and kidney weight (K). To evaluate host fitness and body condition, the kidney fat index was calculated (KFI = (P/K) × 100), after Riney (Reference Riney1955).
The numbers of red deer examined from the three sectors of the Stelvio National Park: Bolzano (BZ), Sondrio (SO) and Trento (TN).
Collection of nematodes
The species composition and abundance of abomasal trichostrongyle nematodes were analysed. Adult worms were collected by dissection of abomasa and filtration of the ingesta on metallic sieves (MAFF, 1986) and 10% of poured contents was examined. Extracted adult worms in the fraction were identified and counted. Male worms were identified according to Drózdz (Reference Drózdz1965) and the nomenclature used is that proposed by Drózdz (1965) and Durette-Desset (Reference Durette-Desset1982), modified according to Stevenson et al. (Reference Stevenson, Gasser and Chilton1996). The counted nematodes in the content fraction were recalculated to the total volume of the abomasum. The total number of abomasal nematodes (males and females) and the number of individuals for each species, based on the taxonomy of adult male worms, were recorded. The sex ratio of nematodes was expressed as the proportion of females of all worms, using the formula: sex ratio = ΣF/(ΣF+ΣM), where ΣF (females) and ΣM (males) are the summed intensities of each gender in a host sample.
Data analysis
Nematode distribution across the host population was studied using a negative binomial distribution, as reported previously by Rizzoli et al. (Reference Rizzoli, Grenfell, Heesterbeek and Dobson2002), Shaw & Dobson (Reference Shaw and Dobson1995) and Shaw et al. (Reference Shaw, Grenfell and Dobson1998). The parameters of a negative binomial distribution are the mean, N (total number of hosts) and the Kappa index. The Kappa index is an inverse measure of aggregation based on the variance (s 2) to mean (m) ratio. An aggregated distribution is characterised by a variance to mean ratio greater than unity (Hudson et al., Reference Hudson, Rizzoli, Grenfell, Heesterbeek and Dobson2002). There are several methods to calculate the Kappa index but the simplest is the moment estimate of k = m 2/(s 2 − m). This k estimate, calculated with the mean, depends on sample size, especially for small samples. A better estimate of k, partially correcting for sample size (n), is the corrected moment estimate of k = (m 2 − (s 2/n))/s 2 − m. The best estimate of Kappa is obtained by applying maximum-likelihood techniques (Pacala & Dobson, Reference Pacala and Dobson1988). Therefore the association between parasite burdens and geographical areas (sectors) of the hosts was studied by the negative binomial regression calculating maximum likelihood estimate of Kappa. In order to examine if age and year of sampling could be confounders, a negative binomial regression model was adjusted for these variables.
The association between parasite prevalence and areas (sectors) was studied by logistic regression analysis. All analyses were performed using the software R: a language and environment for statistical computing (R Foundation for Statistical Computing, Vienna, Austria; URL http://www.R-project.org).
Ecological indexes
Ecological indexes (mean abundance, mean intensity, prevalence) were calculated for each species of nematode when possible (Bush et al., Reference Bush, Lafferty, Jeffrey and Shostak1997). The number of species collected represents a very simple index to value species richness. However, it cannot explain the distribution of species within the area, as it gives equal weight to all taxa (Oindo et al., 2001). Thus, we decided to use other measures to value species richness and diversity in our nematode communities, namely heterogeneity indices, as they consider both the number of species collected and nematode abundance in each area.
For each group of red deer, the following diversity indexes were calculated (Magurran, Reference Magurran1988) as follows.
A dominance measure using Simpson's index:  , where p = n i/N corresponds to the proportion of individuals in the species i (n i is the worm burden of species i and N is the total worm burden). This index calculates the probability that two randomly selected individuals in the community belong to the same category, and ranges from 0 to 1.0.
The diversity index of Shannon: H′ = (Σp i log2p i, which assumes that individuals are randomly sampled.
Evenness of the abundance of species for Shannon's index: E H′ = H′/ln S. This parameter measures the equitability of distribution for individuals of the same species and ranges from 0 and 1.
Richness, using Menhinick's richness index: R = S/√N, where S is the number of species recorded within a province, while N is the total worm burden in the same area.
Results
Two hundred and eighty-four of 298 red deer examined were infected with one or more nematode species (prevalence 95.3%; 95% confidence interval (CI): 92–97%). A total of 128,310 nematodes were collected, with a mean abundance and mean intensity of 430.6 and 451.8, respectively. The total prevalence of female and male nematodes was 92.6% (95% CI: 88.9–95.2%) and 86.2% (95% CI: 81.7–89.8%), respectively. The total number of female (91.550) and male (36.890) nematodes indicates a significantly female-biased overall sex ratio (0.71), ranging from 0 to 1 (median: 0.73). No differences in the sex ratio were observed from different geographical sectors (Kruskal–Wallis test: P>0.05).
The recorded species or morphotypes belonged to the Nematoda: Marshallagia marshalli morph marshalli, Teladorsagia circumcincta morph circumcincta, Ostertagia leptospicularis morph leptospicularis, O. leptospicularis morph kolchida, Spiculopteragia spiculoptera morph spiculoptera, Spiculopteragia spiculoptera morph mathevossiani, Haemonchus contortus and Trichostrongylus axei. The most commonly observed nematodes were S. spiculoptera morph spiculoptera (prevalence 79.5%, 95% CI: 74.4–83.9%) and O. leptospicularis morph leptospicularis (prevalence 40.9%, 95% CI: 35.3–46.8%); while the minor morphs S. spiculoptera morph mathevossiani and O. leptospicularis morph kolchida occurred at lower percentages (31.9%, 95% CI: 26.7–37.5% and 18.8%, 95% CI: 14.6–23.8%, respectively). T. circumcincta morph circumcincta, M. marshalli morph marshalli and H. contortus were rarer (prevalence 1%, 95% CI: 0–3.2%; 1.3%, 95% CI: 0–3.6% and 1.3%, 95% CI: 0–3.6%, respectively).
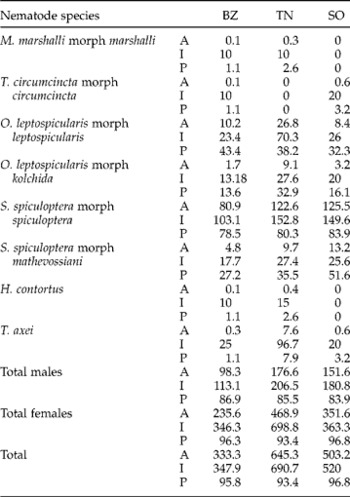
The total prevalence values for the Bolzano (95.8%, CI: 91.6–98%), Trento (93.4%, CI: 84.7–97.6%) and Sondrio (96.8%, CI: 81.5–99.8%) areas of the park indicate that the majority of red deer are infected (table 2).
Ecological indexes of intestinal nematodes in 298 red deer from Bolzano (BZ), Trento (TN), Sondrio (SO). A, mean abundance; I, mean intensity; P, prevalence.

Association between parasites and sectors
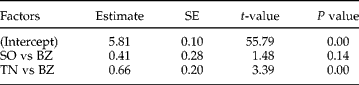
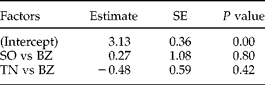
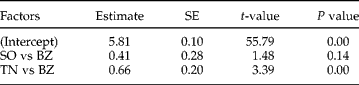
Deviance analysis of the negative binomial regression model shows that the geographical area is significantly related to worm burden (P = 0.0016). The mean worm burden in deer from the TN area was twice as great as that in deer from BZ (P < 0.001) (exponential (exp.) 0.66), while the mean worm burden of SO deer was 1.5 greater than that in BZ (exp. 0.41), although this was not statistically significant (table 3).
Negative binomial regression model relative to geographical areas and worm burden; BZ, Bolzano; SO, Sondrio; TN, Trento; SE, standard error.
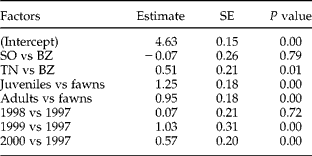
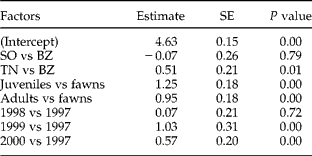
In table 4 the results of the binomial regression model adjusted for host age classes and for year of sampling are shown. Adjusting for other variables such as sex, weight, kidney fat index and mandible length did not improve the model. Deviance analysis of the adjusted model showed that host age and year of sampling were significantly related to worm burden. The worm burden of deer belonging to the TN area was 1.6 times greater than BZ deer (exp. 0.51), while in SO the mean burden was smaller than that of BZ (0.93 fold) (exp. − 0.07). Since the standard error values referred to the regression coefficients were high, the model appears unstable.
Negative binomial regression model after adjustment for age of deer and year of sampling; BZ, Bolzano; SO, Sondrio; TN, Trento; SE, standard error.
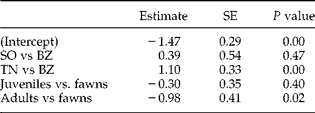
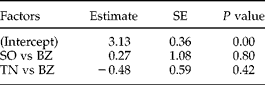
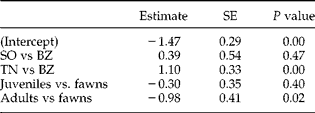
Prevalences of hosts with nematodes were greater in SO (odds ratio (OR) = 1.31; 95% CI: 0.16–10.85) and smaller in TN (OR = 0.62; 95% CI: 0.20–1.96) sectors with respect to BZ, but these differences were not statistically significant (table 5), and accounting for other variables did not improve the model. The logistic regression model fitted to each parasite species, adjusted for host age classes, showed that the prevalence of O. leptospicularis morph kolchida in TN was threefold higher than that observed in BZ (P < 0.01) (exp. 1.10), while the prevalence in SO was 1.4-fold greater (exp. 0.39), although this was not statistically significant (table 6).
Logistic regression model relative to the geographical area and prevalence of nematodes; BZ, Bolzano; SO, Sondrio; TN, Trento; SE, standard error.
Logistic regression model for Ostertagia leptospicularis morph kolchida after adjustment for host age relative to the geographical area and prevalence of nematodes; BZ, Bolzano; SO, Sondrio; TN, Trento; SE, standard error.
The diversity indices of nematode communities were calculated for each sector. The highest values of parasite cohabitation (maximum species number per host) and diversity (H′) occurred in red deer from TN. The greatest species richness (R) was recorded in the SO sector, where the highest value of dominance (D) was also observed (table 7).
Diversity indices of nematodes in red deer from BZ (Bolzano), TN (Trento) and SO (Sondrio).

Discussion
Parasitological data collected in the Stelvio National Park show that almost all red deer are infected by abomasal nematodes, with a female nematode-biased overall sex ratio. The distribution of trichostrongyle nematodes in hosts was aggregated. This type of distribution is common in nature (Poulin, Reference Poulin1998) and indicates that the majority of the parasitic population is concentrated in a minority of hosts.
In red deer from the Stelvio National Park, a good variety of abomasal helminths, both host specific and generalist, was found in all sectors, although some differences emerged in terms of the transmission of nematode species and their role in the communities. Whereas S. spiculoptera morph spiculoptera occurred with highest frequency and density (core species), nematodes such as H. contortus, M. marshalli morph marshalli, T. circumcincta morph circumcincta were much less frequent and only a small number of specimens were found (satellite species). Considering both abundance and prevalence values, S. spiculoptera morph spiculoptera, O. leptospicularis morph leptospicularis, S. spiculoptera morph mathevossiani, were dominant species (sensu Thul et al., Reference Thul, Forrester and Abercombie1985) in deer from all three sectors and appear to be strongly characteristic of these communities. These species, together with O. leptospicularis morph kolchida, are considered typical parasites of cervids.
Red deer share many of these nematodes with roe deer. However, a different hierarchical distribution of nematodes can be observed in both hosts, which may be related to their different species-specificity. In particular, O. leptospicularis morph leptospicularis appears more associated with roe deer, and in roe deer groups from the surrounding zones this nematode species was dominant. In the same areas, S. spiculoptera morph spiculoptera was the most frequently occurring in red deer, while the contribution of O. leptospicularis morph kolchida in the parasite communities was greater in roe deer than in red deer (Togni et al., Reference Togni, Manfredi, Di Cerbo, Zanzani, Gioppo, Piccolo, Bregoli and Trevisiol2004).
In the red deer under study, O. leptospicularis morph kolchida was dominant in TN and also contributed significantly to the nematode communities of SO and BZ, even if to a lesser degree than the dominant species, which were S. spiculoptera morphs spiculoptera R. mathevossiani and O. leptospicularis morph leptospicularis in both sectors. The instability at the hierarchical level of such species could be consequent to its polymorphic nature and therefore to the abundance of the major morph (O. leptospicularis) that has a higher worm burden in red deer from TN. Significant differences in the transmission of O. leptospicularis morph kolchida also emerged from the logistic regression model fitted for this species, where different variables, such as host sex, weight, kidney fat index and mandible length as confounders, were also considered in association between the prevalence of O. leptospicularis morph kolchida and various sectors.
The low prevalence value of T. circumcincta morph circumcincta found in SO (3.2%) is interesting as it is a typical dominant species in bovids (Zaffaroni et al., Reference Zaffaroni, Manfredi, Citterio, Sala, Piccolo and Lanfranchi2000). H. contortus and T. axei are generalist species of wild and domesticated ruminant populations and are associated with Bovinae and Caprinae grazing activity (Zaffaroni et al., Reference Zaffaroni, Fraquelli, Manfredi, Siboni, Lanfranchi, Sartori and Partel1996, Reference Zaffaroni, Manfredi, Citterio, Sala, Piccolo and Lanfranchi2000; Hoberg et al., Reference Hoberg, Lichtenfels and Gibbons2004). In the present study, we found that H. contortus did not contribute significantly to the red deer nematode communities, unlike T. axei in the SO and TN sectors. The presence of T. axei, together with T. circumcincta morph circumcincta, highlights the role of red deer as reservoirs for infection in domestic species, and their importance at the health level because of their potential pathogenic effects. On the other hand, from examination of the abomasal nematode community of red deer of Stelvio National Park, the dominance of S. spiculoptera morph spiculoptera over all the other nematodes species appears much stronger compared to red deer from surrounding areas, in which the importance index showed values only slightly higher than 10 (Togni et al., Reference Togni, Manfredi, Di Cerbo, Zanzani, Gioppo, Piccolo, Bregoli and Trevisiol2004).
At the community level, heterogeneity indices that take into account the total number of nematode species and worm abundance in each area, give a general picture of the diversity and richness of the helminth fauna in different host populations from the Stelvio National Park. The highest species diversity (H′) was observed in the central sector of the study area (TN) while the highest species richness and the highest value of dominance was seen in the western area (SO). In this case, the sampling method may have influenced the results. In wildlife investigations, sampling by chance is virtually impossible and samples obtained from hunted animals, as well as those collected from dead animals, are not always representative of the study populations. In the present study, the distribution of samples relative to host age and sex corresponded to those expected in the red deer population of BZ, and partially in that of TN. However, the sample population from SO was made up predominantly of adults and juveniles and hence the structure of this sampling could have some influence on parasitological data. On the other hand, previous studies in the same area have demonstrated that these categories of animals possess a greater richness and abundance of parasites compared to fawns (Manfredi et al., Reference Manfredi, Piccolo, Fraquelli and Perco2003).
Red deer densities were higher in TN (11 red deer per km2) than those calculated in SO and BZ (5 and 3–8 red deer per km2, respectively). Furthermore, the highest value of mean abundance (A) of nematodes was also observed in this area (TN: A = 645.26 versus BZ: A = 333.35 and versus SO: A = 503.23). The size of the home range depends both on individual behaviour and on the environmental characteristics of the habitat. For instance, the BZ sector is composed mainly of a few valleys and appears to be less favourable to red deer due to a lower pasture:wood ratio, a lower fir:wood ecotone index, and to the shortage of slopes facing south assuring a shorter persistence of snow and increase in the food supply in the winter. Here, studies on female red deer have identified different mean areas of home ranges for deer migrating (1907 ± 874 ha) or not (446 ± 202 ha) (Mustoni et al., Reference Mustoni, Pedrotti, Zanon and Tosi2002). It would have been interesting to evaluate the degree of parasitic infection in both migrating and non-migrating deer, to elucidate if host densities could be positively correlated with parasite burden. Unfortunately, no data on home range of the red deer were available.
Moreover, cattle seem to represent a source of disturbance for deer, causing distressful behaviour. C. elaphus is defined as an intermediate browser, preferring food poor in crude fibre with a high energetic value to that rich in cellulose with a low nutritional value. Red deer are also more adaptable than other ruminants such as roe deer. Consequently, red deer inhabit the same high-quality feeding areas as domestic animals (Mattiello et al., Reference Mattiello, Redaelli, Carenzi and Crimella2002). This behaviour is more typical of female deer, while males tend to prefer areas with low degrees of disturbance over feeding richness (Berretti & Motta, Reference Berretti and Motta2005). Nonetheless, data from a census of domestic cattle in the areas has shown that the Bovinae, Caprinae and Ovinae were abundant in all municipalities of the park sectors (TN, N = 5980; SO, N = 7892; BZ, N = 34,766). (data ISTAT, 2000 available at http://www.istat.it) Therefore, cross-infection between deer and domesticated ruminant populations with several nematodes, such as H. contortus and T. axei, is likely. Moreover, a survey of paratuberculosis in red deer of Stelvio National Park (Martello valley, BZ; Pacetti et al., Reference Pacetti, Belletti, Fabbi, Mutinelli and Genchi1994) points out the close relationship between wild and domestic ruminants in these areas.