Introduction
In the last two decades, worldwide researchers have designed and tested several types of electronic devices based on conducting polymers (CPs).[ Reference Das and Prusty 1 ] Some of these devices meet the demanding requirements of Organic Bioelectronics. The rise of this branch funds, in fact, on some intrinsic features of CPs, such as their mixed ionic/electronic conduction, their proven biocompatibility or their attitude to be functionalized with biomolecular side-groups, in order to impart enhanced functionalities. These features promote the CP-based thin films as the natural interface with the “biologic world”,[ Reference Owens and Malliaras 2 ] hence allowing the development of analytical devices with a broad range of bio-applications such as biosensing[ Reference Nambiar and Yeow 3 , Reference Cesarino, Galesco, Moraes, Lanza and Machado 4 ] and the monitoring of biologic events,[ Reference Tarabella, Pezzella, Romeo, D'Angelo, Coppedè, Calicchio, D'Ischia, Mosca and Iannotta 5 , Reference Jimison, Tria, Khodagholy, Gurfinkel, Lanzarini, Hama, Malliaras and Owens 6 ] or medical devices such as point of care platforms[ Reference Svirskis, Travas-Sejdic, Rodgers and Garg 7 ] and diagnostic tools.[ Reference Cicoira and Santato 8 ]
Recently, a special attention has been paid to a peculiar class of transistors, i.e., the organic electro-chemical transistors (OECTs). Although the main interest on OECTs relies on their unprecedented performances as sensors of a large variety of (bio) analytes (e.g., metallic cations,[ Reference Svensson, Nilsson, Forchheimer and Berggren 9 ] micrometer-sized biomolecules,[ Reference Tarabella, Balducci, Coppedè, Marasso, D'Angelo, Barbieri, Cocuzza, Colombo, Sonvico, Mosca and Iannotta 10 ] DNA,[ Reference Lin, Luo, Hsing and Yan 11 ] bacteria,[ Reference He, Zhang, Tan, Leung, Zhao, Chan, Yang and Yan 12 ] or marine diatoms[ Reference Liao, Lin, Liu, Yang, Zhang, Du and Li 13 ]), their function covers a wide set of applications. For instance, the use of semi-biotic interfaces in OECTs architectures has allowed the implementation of multifunctional[ Reference Tarabella, D'Angelo, Cifarelli, Dimonte, Romeo, Berzina, Erokhin and Iannotta 14 ] and synaptic-like memory[ Reference Romeo, Dimonte, Tarabella, D'Angelo, Erokhin and Iannotta 15 ] devices. Currently, the use of disposable organic-based devices in the medical field as alternative tools to some standard techniques is of great relevance[ Reference Owens and Malliaras 2 ] and, in this respect, OECTs have proven to be also an effective system for the study of the cellular function and physiological activity.[ Reference Yao, Xie, Lin, Yan, Huang and Hsing 16 , Reference Lin, Yan, Yu, Chan and Yang 17 ] In particular, OECTs integrated with a typical Transwell (Twell, a micro-porous membrane commonly used in biology as a support for cell seeding) have been successfully used for the monitoring of cellular stress.[ Reference Jimison, Tria, Khodagholy, Gurfinkel, Lanzarini, Hama, Malliaras and Owens 6 , Reference Romeo, Tarabella, D'Angelo, Caffarra, Cretella, Alfieri, Petronini and Iannotta 18 ] Specifically, the barrier tissue integrity of Caco-2 cell line[ Reference Jimison, Tria, Khodagholy, Gurfinkel, Lanzarini, Hama, Malliaras and Owens 6 ] and the effect of anticancer drugs on human lung adenocarcinoma cell line A549[ Reference Romeo, Tarabella, D'Angelo, Caffarra, Cretella, Alfieri, Petronini and Iannotta 18 ] have been tested by Twell–OECTs. In both cases, the cellular event replicated within the Twell support is monitored by the OECT in terms of a signal activated by the same event, upon opportune biasing of the gate electrode.
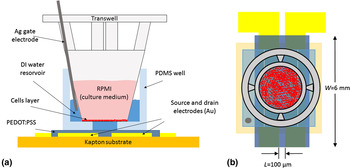
These works promote the Twell–OECT as a new paradigm for the study of cellular stress and the device configuration described in Ref. Reference Romeo, Tarabella, D'Angelo, Caffarra, Cretella, Alfieri, Petronini and Iannotta18 [reported in Figs. 1(a) and 1(b)] may actually be appropriate to shed light on the features of the osmotic stress.
Front (a) and top (b) view of the device layout.

The failure of the adaptive cellular response to osmotic stress represents, in fact, a key issue in the study of factors associated to a wide number of human diseases. Osmotic stress is caused by an imbalance between extracellular and intracellular fluid osmolarity (both ranging between 285 and 295 mosM/kg within most tissues in normal conditions[ Reference Verbalis 19 ]). As a result, the increase in extracellular osmolarity (hyperosmosis) has many damaging effects on cells by promoting water flux out of the cell, triggering cellular shrinkage and intracellular dehydration. The loss of intracellular water adversely affects protein structure and function, provoking the alteration of the enzymatic activity. Experiments have shown that a variety of osmolytes cause, for example, release of inflammatory cytokine and inflammation.[ Reference Kim, Seo and Kim 20 , Reference Gong Wei, Huang, Li, Liu, You and Chen 21 ] On the other hand, osmolyte accumulation prevents water flux out of the cell, hence preserving cell volume and protecting cellular homeostasis. The hyperosmolarity of the extracellular fluid is also believed to play an inflammatory role in asthma and cystic fibrosis,[ Reference Neuhofer 22 ] while a significant increase in blood glucose affects the plasma hyperosmolarity.
Several experimental techniques are used for the evaluation of the cell volume. Generally, such techniques are based on the monitoring of the intracellular concentration of internalized reagents such as fluorescent dyes (quantitative fluorescence microscopy[ Reference Lee 23 , Reference Crowe, Altamirano, Huerto and Alvarez-Leefmans 24 ] and radiolabeling[ Reference Kimelberg, O'Connor, Sankar and Keese 25 ]), on the use of microscopy [e.g., scanning laser confocal microscopy,[ Reference GUILAK 26 , Reference Korchev, Milovanovic, Bashford, Bennett, Sviderskaya, Vodyanoy and Lab 27 ] fluorescent self-quenching,[ Reference Hamann, Kiilgaard, Litman, Alvarez-Leefmans, Winther and Zeuthen 28 ] and scanning electron microscopy (SEM)[ Reference Curtis 29 ]] and on electrical criterions (such as the extracellular impedance spectroscopy[ Reference Kimelberg, O'Connor, Sankar and Keese 25 ]). These techniques are often sophisticated and effective on long time scales, generally longer than those on which the dynamic evolution of the hyperosmotic shrinkage takes place. In addition, they require a dedicate equipment that, in most cases, is unsuitable to perform both an in vivo study of the cell volume variation and a dynamic analysis of the hyperosmotic stress, especially in its early stage. Conversely, Twell–OECTs turn out to be suitable for the in vitro (and in vivo) study of the dynamics of the hyperosmotic stress.[ Reference Romeo, Tarabella, D'Angelo, Caffarra, Cretella, Alfieri, Petronini and Iannotta 18 ] Hence, in this work we aim at demonstrating the working principle of a sensitive, disposable organic-based sensor for the monitoring of cellular activity in response to the hyperosmotic stress induced by the short-lasting action of non-isotonic osmolytes in the electrolyte.
Experimental
Device fabrication
OECTs have been fabricated on a 2-in. circular-shaped Kapton substrate (DuPont). The source and drain electrodes made of a Ti(20 nm)–Au(100 nm) bilayer, were deposited by using a Kurt J. Lesker PVD 75 DC Magnetron Sputtering. The Ti/Au bilayer was then patterned by a lift-off technique (image reversal AZ 5214E photoresist followed by dimethyl sulfoxide, DMSO Sigma Aldrich, bath at 60 °C), determining a 100 µm long (L) and 6 mm wide (W) device channel [Fig. 1(b)]. A mixture of PEDOT:PSS (Clevios PH1000), ethylene glycol (20:1 in volume, Sigma Aldrich) and DBSA (0.05%, Sigma Aldrich) has been spin-coated on Kapton. In this way, a 20 nm-thick film has been obtained. The spun film has been annealed at 150 °C in vacuum for 90 min. To pattern the as-prepared film, a procedure described elsewhere[ Reference Ouyang, Xie, Zhu, Xu, Wang, Tan and Fong 30 ] has been followed; a 150 nm-thick Ag layer has been deposited using an ULVAC EBX-14D electron beam evaporator and subsequently patterned by a wet etching (E6 Metal Etching, 16 V H3PO4 (85%) : 1 V HNO3 (65%) : 1 V CH3COOH : 2 V H2O) at room temperature. Finally, the PEDOT:PSS excess has been removed using a O2 plasma (100 mTorr, 50 sccm, 100 W, 13.56 Hz) for 30 s and the residual Ag protective layer has been removed by the aforementioned E6 wet etching, defining in this way the PEDOT:PSS-based device channel. A Sylgard 184 poly(dimethylsiloxane) (PDMS, Sigma Aldrich) well with a support for the Twell (pores diameter and density 0.4 µm and 108 cm−2, respectively; membrane area of 0.33 cm2, Fisher Scientific Inc.) has been fabricated by soft lithography in order to confine the deionized (DI) water layer between the device channel and the bottom of the Twell.
Cell culture and counting
A549 cancer cell line (American Type Culture Collection, Manassas, VA, USA) was cultured as recommended in RPMI-1640 (Gibco LifeTechnologies) growth medium supplemented with 10% fetal bovine serum (FCS), 2 mm glutamine (GLN), 1% antibiotics (penicillin 100 UI/mL, streptomycin 100 µg/mL). All cells were kept under standard cell culture conditions, at 37 °C in a water-saturated atmosphere of 5% CO2 in air. A549 cells were then seeded in Twell supports at the densities of 5 × 10⁴ and 105 cells/insert, and left to grow for 48 h in order to form a compact monolayer. Cell counting was performed by light microscopy using a Bürker hemocytometer.
Crystal violet assay, radiolabeling, and SEM
Cell vitality has been assessed by Crystal Violet [CV, triphenylmethane dye (4-[(4-dimethylaminophenyl)-phenyl-methyl]-N,N-dimethyl-aniline)] assay. Cells were seeded in 12-well trays (NUNC, Rosekilde, Denmark) at a cell density of 105 cells per well and were exposed to an increasing osmolarity, in the range 0.3–0.7 osM, for 24 and 48 h using sucrose as conditioning osmolyte. Light excitation, which increases linearly with the cell number, was analyzed at 570 nm using a spectrophotometer. Stained cell cultures were observed by bright-field optical microscopy.
Intracellular volumes in the case of samples treated for 24 h were estimated by measuring the equilibrium distribution of 2-deoxy-D-glucose, 2-[1,2_3H(N)]. RPMI containing 5% dialyzed FCS, 2 mm GLN and 0.5 mm glucose was prepared at different osmolarity concentrations adding sucrose. Cells were incubated for 30 min at 37 °C in the presence of labeled RPMI. The radioactivity of the acid extracts was measured by scintillation counting.
In order to perform SEM, cells were treated with physiologic and 0.6 osM RPMI for 30 min and fixed with a solution of glutaraldehyde at 2,5% v/v and sodium cacodylate buffer 0.1 m (pH = 7.3) for 10 min at 4 °C. The as-prepared samples were fast dehydrated, placed on an aluminum support and covered with a thin gold–palladium layer. This protocol helps to minimize artifacts.[ Reference Katsen-Globa, Puetz, Gepp, Neubauer and Zimmermann 31 ] The average cell surface was quantified by sampling ≈100 cells per image for each sample (magnification: 3000×), while the cell volume decrease was estimated by calculating the intercellular free area on three different regions of a micrograph for each sample (magnification: 500×). Image analysis was performed by using the software ImageJ.
Electrical measurements
The electrical characterization of our Twell–OECTs has been carried out using a two-channel source meter (Agilent B2902) controlled by homemade LabView software, as follows. The interstice between the device channel and the bottom of the Twell has been filled with 90 µL of DI water. This content in volume ensures that the top of the DI layer is in contact with the bottom of the Twell. An Ag wire, acting as gate electrode, has been immersed in the DI water layer. Prior to start the measurement, the RPMI at a given osmolarity, ranging between 0.3 osM (control sample) and 0.6 osM, has been removed from each cultured Twell support before putting it in the PDMS well. Then, a source-to-drain voltage (V DS) of −0.1 V has been applied to the channel for 20 s and, just before biasing the gate terminal (source-to-gate voltage, V GS, of 0.4 V, for 210 s), the Twell support has been filled with 150 µL of physiologic RPMI. All measurements have been carried out in a cell-incubator allowing the non-isotonic osmolytes to act for 5 min prior to measure the Twell–OECT response as described just above.
Results and discussion
In the first part of this study, we have evaluated the effectiveness of the conditioning osmolyte, the sucrose, both on long time scales, where the cell shrinkage process is expected to reach an equilibrium condition, and in the early stage, where the adaptive response of cells under stress is effective.
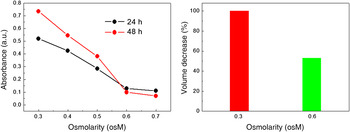
By a CV assay, we have investigated the effect of long-lasting exposures (24 and 48 h) to the hypertonic ambient on A549 cells. The intensity of the CV coloration, proportional to the number of cells still adhered to the porous membrane of the Twell, is directly related to the cell viability upon treatment. Absorbance, evaluated by spectrophotometry [Fig. 2(a)], shows a decrease between 0.3 and 0.6 osM, with a nearly saturating trend between 0.6 and 0.7 osM[ Reference La Monica, Caffarra, Saccani, Galvani, Galetti, Fumarola, Bonelli, Cavazzoni, Cretella, Sirangelo, Gatti, Tiseo, Ardizzoni, Giovannetti, Petronini and Alfieri 32 ] that can be related to the death of most of the cells exposed to a largely non-isotonic ambient.
(a) Working osmolarity range evaluated by spectrophotometry (absorbance as a function of osmolarity); (b) cell volume assessment by radio-labeled markers for isotonic and 0.6 osM-treated samples (24 h of incubation in hypertonic ambient).

The shrinkage of A549 cells upon 24 h-lasting incubation in a hypertonic RPMI medium (osmotic concentration 0.6 osM) has been evaluated by determining their volume variation. This has been done by assessing the concentration of labeled 2-deoxy-D-glucose in cells. Cellular shrinkage observed during 1 day of incubation to non-isotonic RPMI (at 0.6 osM), accounts for a volume reduction of 47% (Fig. 2(b)).
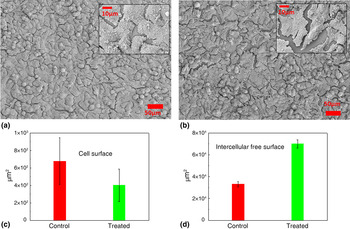
SEM images have been used as a complementary and efficient method to assess the effect of a non-isotonic medium on cells at the early stage of the shrinkage.[ Reference Curtis 29 , Reference Katsen-Globa, Puetz, Gepp, Neubauer and Zimmermann 31 ] Figures 3(a) and 3(b) show micrographs of the control sample (cells in isotonic ambient) and cells exposed to 0.6 osM for 30 min, respectively. Some differences between the analyzed samples, in particular in terms of the average cell surface and intercellular gaps, are clearly evidenced by a qualitative analysis of the micrographs. For the control sample, smaller, better-adhered and interconnected cells (lower intercellular gap of about 1 µm) with respect to the case of treated cells are evidenced [see insets of Figs. 3(a) and 3(b)]. A more quantitative analysis of the micrographs has been carried out by choosing the average cell surface and the intercellular gap as the characteristic parameters of the hyperosmotic effect. As a result, the average cell surface decreased by a 43% in the treated sample with respect to the control [Fig. 3(c)], while the quantification of the intercellular gaps has shown an increase of the intercellular gap area of about 130% with respect to the control [Fig. 3(d)]. All these features are a direct consequence of the cellular shrinkage induced as a response of cells to the unbalance of osmolyte concentration in the cell culture medium. This analysis confirms the effectiveness of the cellular shrinkage on time scales of some minutes.[ Reference Kiehl, Shen, Khattak, Jian Li and Sharfstein 33 ]
SEM images of (a) control and (b) 6 osM-treated cells (30 min of incubation in hypertonic ambient), cultured on Twell membranes, magnification of 500×. Insets show a magnification of 3000×; (c) average cell surface and (d) intercellular free surface calculated by image analysis of SEM micrographs for control and treated samples.

Taking into account the above results, the cell shrinkage induced by a sucrose-enriched hypertonic ambient is investigated using a low cost and fast technology, i.e., a disposable Twell–OECT, in the range 0.3–0.6 osM (step of 0.1 osM). However, prior to checking the effect of sucrose on A549 cells, it is worth recalling the working principle of our Twell–OECT.[ Reference Romeo, Tarabella, D'Angelo, Caffarra, Cretella, Alfieri, Petronini and Iannotta 18 ]
The device configuration [Fig. 1(a)] is aimed at coupling a Twell support with the typical channel of an OECT through a dedicated PDMS well. A DI water layer fills the space separating the bottom of the Twell porous polycarbonate membrane and the transistor channel made of PEDOT:PSS. An Ag wire, acting as gate electrode, is immersed in the DI water layer. Some RPMI (rich of ionic species) is confined in the Twell, so that the underneath water layer is not directly exposed to it when the Twell membrane pores are completely clogged by a confluent layer of cells. In this case, the device response as a function of time, at fixed drain and gate voltage biasing, does not show effects ascribable to the drifting (through the membrane pores) of ions contained in the culture medium toward the underneath DI layer. Specifically, the device response is identical to that ascribable to an OECT operating using pure DI water as electrolyte and an Ag wire as gate electrode. Such response indicates that the confluence of the cell monolayer is preserved in an isotonic ambient. On the contrary, owing to the adaptive response of cells to the induced stress (as, for instance, the apoptotic death of cancer cells due to the effect of anticancer drugs[ Reference Romeo, Tarabella, D'Angelo, Caffarra, Cretella, Alfieri, Petronini and Iannotta 18 ]), the shielding capability of the cell layer is expected to be less effective. Hence, in this case, very small changes of the ionic population in the DI water (caused by a diffusive drift of RPMI through the exposed pores of the Twell) can be finely detected by the Twell–OECT. This detection is visualized in the form of a linear decay of the channel current as a function of time. The device response (i.e., the slope γ of the Ids versus time curve) can be modeled by using a modified Fick's law taking into account the hydraulic conductance of the Twell. The modelization provides a direct correspondence between the slope of the linear current decay and the number of pores exposed to the ionic drift (for further details, see the Supplementary Material of Ref. Reference Romeo, Tarabella, D'Angelo, Caffarra, Cretella, Alfieri, Petronini and Iannotta18).
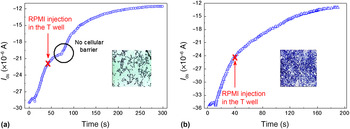
From the description of the device working principle, it emerges that the formation of a confluent layer of cells represents an indispensable requirement for a proper operation of our Twell–OECT. Hence, the investigation of the osmotic stress by the Twell–OECT requires a preliminary determination of the seeding conditions needed to ensure the formation of a compact layer. To this end, cells have been cultivated for 48 h on the porous membrane of the Twell at seeding densities of 5 × 10⁴ and 105 cells. Then, the time-dependent OECT response (V DS = −0.1 V) has been measured upon injection of RPMI in the Twell 30 s after the gate turning on (V GS = 0.4 V). Figure 4(a) shows that for the lower cell density the cell layer is not compact since ions crossing the membrane are detected by the OECT, as indicated by the I DS current change that takes place about 35 s after the injection of RPMI. The observed delay of channel current decrease from the culture medium injection represents the typical drift time of the cations coming from the culture medium across the membrane pores, toward the underlying water.[ Reference Romeo, Tarabella, D'Angelo, Caffarra, Cretella, Alfieri, Petronini and Iannotta 18 ] Conversely, when the cell density realizes a complete coverage of the Twell membrane by a compact cell layer, no variation in the I DS (t) signal is revealed [Fig. 4(b)], hence demonstrating that a good barrier against cations drift through the membrane is formed. Cell coverage of the Twell membrane is also showed by bright field micrographs collected upon CV staining [see insets of Figs. 4(a) and 4(b)]. Anyway, the barrier effect due to cell layer has been systematically checked for each Twell handled during the experiment. Control experiments aimed at checking the possible detection of sole sucrose by OECTs have shown that the device is insensitive to variations of the conditioning osmolyte concentration.
Seeding condition evaluated from the OECT response for cell densities of 5 × 10⁴ (a) and 105 cells per Twell (b). Insets show the coverage by the cell layer of the Twell micro-porous membrane, upon coloration by CV assay.

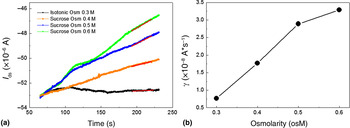
The effect of increasing osmotic concentrations (from 0.3 to 0.6 osM with a step of 0.1 osM) on cells treated for 5 min is showed by the time-dependent response of an OECT with a 20 nm-thick active layer [Fig. 5(a)]. It is worth to mention that we have let the non-isotonic amount of electrolyte act for 5 min prior to measure the Twell–OECT response because, as also confirmed by SEM analysis, the highest cell response to the hyperosmotic stress is expected within few minutes upon cells exposure to a non-isotonic osmolyte.[ Reference Kiehl, Shen, Khattak, Jian Li and Sharfstein 33 ]
(a) time-dependent device response, I DS(t), at different osmolarities (from 0.3 to 0.6 osM); (b) γ parameter evaluated by a fitting procedure from I DS(t) curves.

Figure 5(a) shows that the device is able to reproduce unambiguously the effect of sucrose-induced stress on cells. The cell shrinkage is evidenced from the slope (γ) of the Ids versus time curve, which is expected to depend on the effective number of the Twell pores exposed to the ion drift towards the DI layer, due to the shrinkage of stressed A549 cells. Even if the slope of the control sample exposed to the isotonic RPMI medium shows a deviation from the ideal case (where γ = 0 is expected), non-isotonic osmolarities determine a monotonic increase of the γ parameter in the range 0.3–0.5 osM, while the onset of a saturating trend takes place above 0.5 osM [Fig. 5(b)]. This aspect, on one hand, indicates that our device is able to detect the cell redistribution upon hyperosmotic stress, following the trend showed by CV assay even on short time scales with respect to those required for detecting the sucrose action in this latter case. On the other hand, our results confirm that in the case of A549 cell line and sucrose as conditioning osmolyte, the most cell shrinkage upon stress takes place within few minutes of action for the non-isotonic osmolyte. In fact, taking into account the modelization of the device response,[ Reference Romeo, Tarabella, D'Angelo, Caffarra, Cretella, Alfieri, Petronini and Iannotta 18 ] the 30 min-lasting action of the 0.6 osM culture medium determines the ion drift through pores that are spread over the 44% of the Twell surface. Indeed, 24 h of exposure [Fig. 2(b)] determines a cell volume reduction of about 47% that, in terms of our model, would correspond to an exposed surface for the Twell of about 53%.
Although such analysis has regarded an exposure of 5 min to non-isotonic osmolytes, the determination of the osmotic stress dynamics during its early stage requires the assessment of the time-dependent evolution of cellular shrinkage. This can be easily done by varying the cells' exposure times to a non-isotonic solution and by mapping the distribution of γ parameters evaluated for some exposure times fixed in the desired time window.
A quite relevant aspect of this study regards the choice of a very thin PEDOT:PSS layer. This choice relies on the necessity of testing the sensitivity of Twell–OECTs when operated as amplifying stages of slow varying (and low) ionic signals. Thin channels, in fact, are reported to show a low transconductance, i.e., a low attitude at amplifying ionic signals.[ Reference Khodagholy, Rivnay, Sessolo, Gurfinkel, Leleux, Jimison, Stavrinidou, Herve, Sanaur, Owens and Malliaras 34 ] Nevertheless, the above results indicate that the sensitivity of our device is sufficient to resolve the stress effect induced by non-isotonic osmolytes, even if it is possible to resolve subtle variations of cells volume by operating a fine tuning of the Twell–OECT sensitivity through the variation of the PEDOT:PSS thickness.
Conclusions
We show that an OECT integrated with a transwell support where A549 cells are cultivated, is a tool ideally suitable for determining the hyperosmotic stress induced by an imbalance between extracellular and intracellular fluid osmolarity. A direct evidence of a cellular shrinkage in response to the unbalance of osmolyte concentration in the cell culture medium has been found, confirming the effectiveness of sucrose as conditioning electrolyte even on time scales shorter than those required by the complementary analysis carried out in this work (CV assay, radiolabeling, and SEM). Our results pave the way for a real-time investigation of both the early stage and the dynamics of cell shrinkage upon hyperosmotic stress and, more in general, for the study of mechanisms involved in cells activity.
Acknowledgments
This work has been funded by the N-Chem project within the CNR–NANOMAX Flagship program, by the Provincia Autonoma di Trento, call “Grandi progetti 2012”, project “Madelena” and by “NANONOPAIN-Theras” project co-funded by POR-FESR 2014-2020, Regione Emilia Romagna.