





1. Introduction
Sand-grain roughness Reynolds number,  $k_s^+(=k_su_{\tau }/\nu )$, is one of the commonly employed parameters in rough-wall turbulence to compare different k-type roughnesses that are associated with most of the flows of practical interest. Here,
 $u_{\tau }$ and
 $\nu$ are the wall-friction velocity and kinematic viscosity of the fluid, respectively, while
 $k_s$ (as defined by Schlichting (Reference Schlichting1936)) is the equivalent sand-grain roughness height of the sand grain used in the experiments of Nikuradse (Reference Nikuradse1933) that gives the same effective frictional resistance as that created by the physical wall roughness.
As classified by Nikuradse (Reference Nikuradse1933) based on his experiments in a pipe coated with uniform sand, turbulent flows manifest in three distinct regimes marked by  $k_s^+$: hydraulically smooth regime (typically
 $k_s^+<4$), transitionally rough regime (typically
 $4\leqslant k_s^+\leqslant 70$) and fully rough regime (typically
 $k_s^+>70$). For hydraulically smooth flows, the roughness effects are basically damped out by viscosity within the viscous sublayer, hence the surface roughness is negligible, and the skin friction is only a function of the Reynolds number. For transitionally rough flows, on the other hand, the skin friction depends on both Reynolds number and
 $k_s^+$, while in the fully rough regime the skin friction is independent of the Reynolds number. (All these flow regimes were expressed later by Moody in his well known chart (Moody Reference Moody1944).) Moreover, in the fully rough regime there is a log–linear relationship between
 $k_s^+$ and the roughness function,
 $\Delta U^+$, that represents a vertical shift in the logarithmic region of the mean velocity profile. This relation is well accepted by the rough-wall turbulence community. However, there are different observations in the transitionally rough regime regarding the relation between the roughness function and the roughness Reynolds number (e.g. Nikuradse-type and Colebrook roughness functions and the roughness function in Squire et al. (Reference Squire, Morrill-Winter, Hutchins, Schultz, Klewicki and Marusic2016)). So, it remains an open question if there is a universal relation between
 $k_s^+$ and
 $\Delta U^+$ independent of the roughness geometry (for
 $k$-type roughness) as well as the geometry of the turbulent flow (e.g. pipe flow, turbulent boundary layer).
In addition to its direct impact on the mean velocity in the logarithmic region, the equivalent sand-grain roughness height,  $k_s$, (or roughness height,
 $k$) relative to the boundary layer thickness,
 $\delta$, is also considered as an important parameter to examine the wall-similarity hypothesis of Townsend (Reference Townsend1956) in rough-wall turbulence. According to Townsend (Reference Townsend1956), the outer layer of rough-turbulent boundary layers has identical properties to those of smooth-wall turbulent flows at sufficiently high Reynolds numbers. The outer layer similarity in the mean flow or turbulent properties has been supported by a number of experimental and numerical studies (e.g. Raupach Reference Raupach1981; Flores & Jimenez Reference Flores and Jimenez2006; Shockling, Alle & Smits Reference Shockling, Alle and Smits2006; Flack, Schultz & Connelly Reference Flack, Schultz and Connelly2007; Hong, Katz & Schultz Reference Hong, Katz and Schultz2011; Hultmark et al. Reference Hultmark, Vallikivi, Bailey and Smits2013; Squire et al. Reference Squire, Morrill-Winter, Hutchins, Schultz, Klewicki and Marusic2016). However, as indicated by Jimenez (Reference Jimenez2004), the wall-similarity holds only for small relative roughness height,
 $k/\delta$, in addition to the flow being at sufficiently high Reynolds number; i.e. when there is sufficient separation between scales. He suggested
 $\delta /k\geq 40$ to expect similarity in the outer flow. This could explain why some studies (e.g. Krogstad, Antonia & Browne Reference Krogstad, Antonia and Browne1992; Keirsbulck et al. Reference Keirsbulck, Labraga, Mazouz and Tournier2002; Bhaganagar, Kim & Coleman Reference Bhaganagar, Kim and Coleman2004; Lee & Sung Reference Lee and Sung2007), where
 $\delta /k<40$, lack outer-layer similarity.
As stated by Flack et al. (Reference Flack, Schultz and Connelly2007), on the other hand,  $\delta /k_s$ could be considered as a more appropriate roughness length scale rather than
 $\delta /k$, since the former involves the whole effect of the surface morphology. For both relative roughness length scales (either
 $\delta /k$ or
 $\delta /k_s$), however, the threshold value for the turbulent flow to maintain the outer-layer similarity remains an open question. Another interesting question regarding the wall-similarity hypothesis is whether it also holds for transitionally rough flows where
 $\delta /k$ (or
 $\delta /k_s$) is still high, as it has been mostly argued to hold for fully rough flows. On the other hand, one of the big challenges here is the accurate determination of the wall-friction velocity,
 $u_{\tau }$, as this hypothesis is mostly studied by normalising the mean streamwise velocity defect and turbulent profiles by
 $u_{\tau }$.
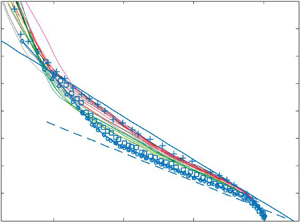
To eliminate the impact of the uncertainties in friction velocity on the similarity analysis, Alfredsson, Segalini & Orlu (Reference Alfredsson, Segalini and Orlu2011) and Alfredsson, Orlu & Segalini (Reference Alfredsson, Orlu and Segalini2012) proposed a new scaling, the so called diagnostic plot, for the turbulence intensity of the streamwise velocity. With the diagnostic plot, they plotted the streamwise turbulence intensity,  $\sqrt {\overline {u^2}}$, normalised by the local mean streamwise velocity,
 $U$, against the local mean flow normalised by the free stream velocity,
 $U/U_{\infty }$. They showed that
 $\sqrt {\overline {u^2}}/U$ is decreasing linearly with
 $U/U_{\infty }$ in the outer layer of the boundary layer including the logarithmic region, and the extent of this linear part is increasing with Reynolds number. Later, Castro, Segalini & Alfredsson (Reference Castro, Segalini and Alfredsson2013) examined the diagnostic plot for a number of smooth and rough wall data from the literature, where the roughness elements manifest in different size and shape, forming various flow conditions. They showed that the diagnostic plots for rough flows collapse into a linear line in the outer region independent of the roughness morphology, similar to the diagnostic plots of smooth-wall data. However, the slope of this linear line is greater than that for the smooth walls, which could be considered as an indication of an increase in the wake strength on rough walls compared with smooth walls.
Since the pioneering work of Nikuradse (Reference Nikuradse1933), sandpaper-type roughness has been employed frequently to understand the flow dynamics and the structure of rough-wall turbulence. More than a decade ago, Flack et al. (Reference Flack, Schultz and Connelly2007) studied wall-similarity with three different grit sandpapers (i.e. P $80$, P
 $24$ and P
 $12$) together with other three different rough surfaces created by meshes (i.e. fine, medium and coarse). With these six different rough surfaces, they formed three matched cases for
 $\delta ^+$ between each of these sandpapers and meshes. However, they did not consider matched
 $\delta ^+$ for the same surface morphology (either sandpaper or mesh), or matched
 $k_s^+$ for any of the rough surfaces.
More recently, Squire et al. (Reference Squire, Morrill-Winter, Hutchins, Schultz, Klewicki and Marusic2016) (also Morrill-Winter et al. (Reference Morrill-Winter, Squire, Klewicki, Hutchins, Schultz and Marusic2017) in their follow-up paper) conducted experiments over a P $36$ grit sandpaper up to a very high Reynolds number (
 $\delta ^+=29\,900$). Varying the free stream velocity and the measurement location in the streamwise direction, they achieved a range of
 $\delta ^+$ as well as
 $k_s^+$. However, all the rough-flow regimes attained were over the same sandpaper, and they provided comparisons only between the rough and smooth walls at matched
 $\delta ^+$. Similarly, to our knowledge, almost all rough-wall studies have been carried out either with a single surface over different Reynolds numbers or with multiple surfaces for a single flow condition (i.e. approximately matched
 $\delta ^+$). Hence, the transitionally and fully rough flow regimes over different rough surfaces having the same surface morphology at matched
 $k_s^+$ or
 $\delta ^+$ remains unexplored, which is needed to better understand the relation between the roughness function and the roughness Reynolds number, in particular in the transitionally rough regime, as well as the extent and the impact of the relative roughness height within the boundary layer.
To fill this gap, in the present study, we utilise three different rough surfaces, all belonging to the same morphology (i.e. P $24$, P
 $36$ and P
 $60$ grit sandpapers). In particular, we aim to look at the mean flow, turbulent quantities and spatial correlation structure in transitionally and fully rough flow regimes at (approximately) matched roughness or boundary layer Reynolds numbers.
To achieve the above goals, we conducted high-resolution planar particle image velocimetry (PIV) measurements in the streamwise–wall-normal plane for a range of Reynolds number between  $\delta ^+ (\delta u_{\tau }/\nu )=1281\text {--}6317$. The experimental data sets include both transitionally and fully rough flow regimes where
 $45\leq \delta /k\leq 111$ and
 $30\leq \delta /k_s\leq 111$, including several matched cases for
 $k_s^+$ and
 $\delta ^+$ between P
 $24$, P
 $36$ and P
 $60$ grit sandpapers. This enables us to examine the roughness function, first- and second-order turbulence statistics, and the average large-scale motions (through two-point spatial correlations) at matched conditions as well as for a range of relative roughness height and Reynolds number over three different rough surfaces having the same surface morphology (sand grain). Also, it is of interest in this study to examine the wall-similarity hypothesis of Townsend (Reference Townsend1956) for a range of transitionally rough flows in addition to fully rough flow conditions with different values of relative roughness height compared with the boundary layer thickness (‘small’ to ‘large’) at lower Reynolds numbers (compared with Squire et al. (Reference Squire, Morrill-Winter, Hutchins, Schultz, Klewicki and Marusic2016)), which appears to be an open question in the rough-wall turbulence.
This paper is organised as follows. A description of the experimental set-up and methodology is given in § 2. Then in § 3, the results for all the flow and surface conditions are presented and discussed in detail. In addition to the skin-friction coefficient and roughness function, first- and second-order turbulent properties (including those at matched  $k_s^+$ and
 $\delta ^+$), the outer-layer similarity hypothesis, diagnostic plots and the average size of the flow structures through two-point spatial correlations are examined. Finally, the findings are summarised in § 4.
2. Experimental set-up and methodology
Drag balance and planar PIV experiments were performed in the open-circuit suction wind tunnel at the University of Southampton. The test section of the wind tunnel measures  $0.9\ \textrm {m} \times 0.6\ \textrm {m} \times 4.5\ \textrm {m}$ and has a nominally zero pressure gradient (Castro Reference Castro2007). The free stream velocity of the wind tunnel can reach up to
 $30\ \textrm {m}\,\textrm {s}^{-1}$, with a turbulence intensity less than
 $0.5\,\%$. The free stream velocity of the tunnel was controlled through a National Instruments data acquisition system (known as NI-DAQ) and FC
 $510$ manometer.
Rough surfaces were created with P $24$, P
 $36$ and P
 $60$ grit sandpapers where the entire floor of the wind tunnel working section was covered homogeneously by each of these sandpapers to attain three different rough surfaces having similar surface morphology. The surface parameters of each sandpaper were determined through surface scanning (see table 1). Similar to Squire et al. (Reference Squire, Morrill-Winter, Hutchins, Schultz, Klewicki and Marusic2016) the physical roughness height of each sandpaper surface was determined as
 $k=6\sqrt {\overline {h'^2}}$, where
 $\overline {h'^2}$ is the surface variance and
 $h'$ is the surface deviation from the mean height.
Key surface parameters from the scanned surface data. Here  $k=6 \sqrt {\overline {h'^2}}$,
 $k_a=\overline {\mid h' \mid }$,
 $k_p=\max h' - \min h'$ and
 $k_{rms}=\sqrt {\overline {h'^2}}$. Here,
 $\overline {h'^2}$ is the surface variance and
 $h'$ is the surface deviation from the mean height, i.e.
 $h'=h-\bar {h}$. All units are in millimetres. Subscripts 24, 36 and 60 correspond to P
 $24$, P
 $36$ and P
 $60$ grit sandpapers, respectively. Colour maps show
 $h'$ in millimetres over a sample patch of
 ${\sim }8\ \textrm {mm} \times 8\ \textrm {mm}$.

Wall shear stress was obtained directly from a floating-element drag balance. The balance was flush mounted on the wind tunnel floor  ${\sim }2.61\ \textrm {m}$ downstream of the beginning of the surface covered by the sandpaper. The floating element has a surface area of
 $0.2\ \textrm {m} \times 0.2\ \textrm {m}$. Detailed description of the floating element as well as the related uncertainties can be found in Ferreira, Rodriguez-Lopez & Ganapathisubramani (Reference Ferreira, Rodriguez-Lopez and Ganapathisubramani2018). Wall shear-stress measurements were conducted for nine different free stream velocities corresponding to Reynolds numbers ranging between
 $Re_x(xU_{\infty }/\nu )=1.62\times 10^6\text {--}4.76\times 10^6$ for each surface condition created with P
 $24$, P
 $36$ and P
 $60$ grit sandpapers. Here,
 $x$ represents the incoming length, i.e. the distance between the onset of the sandpaper and location of the drag balance.
To enable the PIV measurements the flow was seeded with vaporised glycerol–water solution particles ( ${\sim }1\ \mathrm {\mu }\textrm {m}$) generated by a Magnum
 $1200$ fog machine. The particles were illuminated by a light sheet generated using a twin-cavity double pulsed Litron Nd:YAG laser operating at
 $200\ \textrm {mJ}$. The thickness of this light sheet was
 ${\sim }1\ \textrm {mm}$. The particle images were recorded using a LaVision Imager LX 16 MP CCD camera equipped with a Nikon 200 mm lens operating at an aperture number of
 $f_{\#}=5.6$. The field of view is
 ${\sim }0.094\ \textrm {m}\times 0.145\ \textrm {m}$ in the streamwise (
 $x$) and wall-normal (
 $\,y$) planes, respectively. Images were recorded at a frame rate of 1 Hz at six different Reynolds numbers based on the incoming length (based on the mid-streamwise plane of the field of view) and free stream velocity between
 $Re_x =1.34\times 10^6\text {--}4.41\times 10^6$ for each surface covered fully with the sandpapers. This results in various Reynolds numbers based on the friction velocity,
 $u_{\tau }$, and boundary layer thickness,
 $\delta$, which span the range of
 $Re_{\tau } (\delta ^+=u_{\tau }\delta /\nu )=1281\text {--}6317$. For each flow condition, 1000 PIV images were collected. The calibration, data acquisition and post-processing were performed with a commercial software package (Davis
 $8.3.1$, LaVision). The PIV images were interrogated with a multipass interrogation technique, where the final interrogation window size was
 $16\times 16$ pixels (with
 $75\,\%$ overlap) corresponding to a spatial resolution based on the interrogation window size of between
 $10$ and
 $40$ viscous wall units (
 $\nu /u_{\tau }$) depending on
 ${Re}_{\tau }$ (see table 2).
Details of the flow conditions for each sandpaper-covered surface. Here  $d_l^+(= d_lu_{\tau }/\nu )$ represents the spatial resolution in wall units, where
 $d_l$ is the dimension of the PIV interrogation domain. Here
 $\varPi$ is the wake strength determined using the wake function of Coles (Reference Coles1956). Here
 $\varOmega (=\delta U_{\infty }/x u_{\tau })$ represents the ratio of the turbulent time scale to the mean flow time scale (Chauhan et al. Reference Chauhan, Monkewitz and Nagib2009).

In the present study,  $x$ and
 $y$ represent the axial and wall-normal directions, respectively. The corresponding mean velocities are denoted by
 $U$ and
 $V$, respectively, while the velocity fluctuations are denoted by
 $u$ and
 $v$. The superscript ‘
 $+$’ is used to denote the inner scaling of length, (e.g.
 $y^+=yu_{\tau }/\nu$) and velocity, (e.g.
 $U^+=U/u_{\tau }$). Here,
 $u_{\tau }$ is the wall-friction velocity, while
 $\nu$ is the kinematic viscosity of the fluid, which is air in the present study. The free stream velocity and boundary layer thickness is denoted by
 $U_{\infty }$ and
 $\delta$, respectively, where
 $\delta$ was determined based on the wall-normal location of
 $99\,\%$ of
 $U_{\infty }$.
3. Results
3.1. Skin-friction coefficient
The skin-friction coefficient determined from the direct measurements through a floating-element drag balance is presented in figure 1 for various surface and flow conditions. In this figure, the data shown by empty symbols represent the information obtained directly from the drag balance, while the results shown by filled symbols correspond to the interpolated skin friction coefficient for the flow conditions where the PIV experiments were conducted. Here, the interpolation was conducted through a quadratic fit for each rough surface separately using all the flow conditions, except the lowest Reynolds number case for the P $36$ grit sandpaper as it deviates significantly from the rest of the data. Note that the skin-friction data from the balance were obtained by averaging the information over repeated runs, i.e. 9, 11 and 21 for P
 $24$, P
 $36$ and P
 $60$ grit sandpapers, respectively. So, the error bars represent the standard deviation among these several runs for each flow and surface condition. Note also that the root mean square errors in the skin-friction coefficient are consistent with the overall uncertainties reported previously by Ferreira et al. (Reference Ferreira, Rodriguez-Lopez and Ganapathisubramani2018) for the same floating-element drag balance. They determined the uncertainties in the skin-friction coefficient by comparing the results from the floating-element drag balance with those obtained through hot-wire measurements over a smooth wall.
Skin-friction coefficient,  $c_f$, for several inflow conditions,
 $Re_x$, obtained from the floating-element drag balance (data shown by empty symbols). Black (square), red (circle) and green (triangle) symbols represent the averaged data (over repeated experiments) for the P
 $24$, P
 $36$ and P
 $60$ grit sandpapers, respectively. Filled symbols correspond to the estimated skin friction coefficient (based on the available skin friction information) for the flow conditions where the planar PIV experiments were conducted. The number of repeated runs for the P
 $24$, P
 $36$ and P
 $60$ grit sandpapers is 9, 11 and 21, respectively. The error bars represent the standard deviation in the skin-friction coefficient among the repeated runs for each surface and flow condition.

The skin-friction coefficient data for the P $24$ grit sandpaper in figure 1 suggest that the flow is transitionally rough approximately up to a Reynolds number of
 $Re_x=2.5\times 10^6$, and beyond this Reynolds number the flow becomes fully rough. For the P
 $36$ grit sandpaper, the results suggest that almost all the flow conditions fall into the transitionally rough regime. For the P
 $60$ grit sandpaper, on the other hand, the transitionally rough regime, which is expected considering the skin-friction trends of the P
 $24$ and P
 $36$ sandpapers, is not clearly visible from the skin-friction information. The decreasing trend of the skin-friction coefficient (with decreasing
 $Re_x$) for P
 $60$ (and for P
 $36$ at
 $Re_x\leq 2.5\times 10^6$) could be a result of a local minima before the plateau that the transitionally rough flow finally develops into the fully rough regime (similar to figure 7 in Shockling et al. (Reference Shockling, Alle and Smits2006)). However, it should also be noted that the magnitude of the maximum change in the skin-friction coefficient for each rough surface (considering all the flow conditions) is within the uncertainty of the measurements.
3.2. Roughness function
The roughness function,  $\Delta U^+$, and zero plane displacement,
 $d$, for each surface and flow condition were determined based on minimising the root mean square error between the inner-normalised mean streamwise velocity profile and rough-wall logarithmic law in the region up to
 $3\sqrt Re_{\tau } - 0.15Re_{\tau }$ (see (3.1)). Here, we used the wall-friction velocity,
 $u_{\tau }$, obtained directly from the drag balance measurements; and for the Kármán constant,
 $\kappa$, and the log-law intercept for smooth walls,
 $A$, we employed the values
 $0.39$ and
 $4.3$, respectively, similar to Squire et al. (Reference Squire, Morrill-Winter, Hutchins, Schultz, Klewicki and Marusic2016). Note that throughout this paper, all the results presented are based on
 $\Delta U^+$ and
 $d$ obtained minimising the root mean square error between the inner-normalised mean velocity profile and rough-wall logarithmic law in this inertial region, unless otherwise is stated. To check the effect of the employed region on the results, the onset and end of the inertial region was varied between
 $2\sqrt Re_{\tau }-0.2Re_{\tau }$ as detailed below.
Figure 2 shows the resulting roughness function with equivalent sand-grain roughness for all the flow and surface conditions. Note that for the P $24$ grit sandpaper using the cases where
 $\Delta U^+>8$, the
 $k_s$ was determined based on
 $\Delta U^+={(1/\kappa )}\log k_s^++A-A_{FR}^{\prime }$ with
 $A_{FR}^{\prime }=8.5$ (Nikuradse Reference Nikuradse1933). However,
 $\Delta U^+$ is not greater than
 $8$ for any of the cases for the sandpapers P
 $36$ and P
 $60$. Therefore, we first determined the
 $k_s$ for the P
 $36$ grit sandpaper based on the overlapping (high Reynolds number) cases between the P
 $36$ and P
 $24$ grit sandpapers, where
 $\Delta U^+\geq 7$. For the P
 $60$ grit sandpaper, on the other hand, the highest
 $\Delta U^+=5.6$. Therefore, we determined the
 $k_s$ by fitting the data of the P
 $60$ grit sandpaper to those of the P
 $36$ grit sandpaper in the overlapping region, assuming that the roughness function of the P
 $60$ grit sandpaper follows the same behaviour of the P
 $36$ grit sandpaper in the fully rough regime.
Roughness function,  $\Delta U^+$, as a function of inner-normalised roughness height,
 $k_s^+$. Data represented by black, red and green correspond to P
 $24$, P
 $36$ and P
 $60$ grit sandpapers, respectively. Filled symbols shown by squares, circles and triangles show the results obtained for the inertial range
 $3\sqrt Re_{\tau }\text {--}0.15Re_{\tau }$, where
 $\Delta U^+$ and
 $d$ are determined based on the (3.1); open symbols correspond to the results obtained with
 $d=k/2$. All other symbols presented in the legend show the results for a various range of inertial region used to determine
 $\Delta U^+$ and
 $d$ based on the (3.1). The solid blue line shows the Nikuradse-type roughness function of Schlichting (Reference Schlichting1979) and the dashed black line represents the fully rough asymptote of Nikuradse (Reference Nikuradse1933). The solid yellow line corresponds to the data of Squire et al. (Reference Squire, Morrill-Winter, Hutchins, Schultz, Klewicki and Marusic2016) for a P
 $36$ grit sandpaper.

As can be seen from figure 2, all the data points are following the Nikuradse-type roughness function (Schlichting Reference Schlichting1979) for all the considered regions employed. Changing the start and end of the inertial region by  ${\sim }33\,\%$ in either or both direction, results in less than
 $4\,\%$ change in
 $\Delta U^+$ for all the surface and flow conditions; except for the lowest two Reynolds number cases for the P
 $60$ grit size sandpaper (i.e. P
 $60Re1$ and P
 $60Re2$, see table 2), where the deviations are
 ${\sim }6\,\%$ and
 ${\sim }13\,\%$ when the region
 $2\sqrt Re_{\tau }-0.15Re_{\tau }$ is considered for the logarithmic fit,
 \begin{equation} \varPsi=U^+-\left[\frac{1}{\kappa}\ln\left(y^+-d^+\right)+A-\Delta U^+\right]. \end{equation}
Furthermore, the roughness function for all the flow conditions was also determined keeping the zero plane displacement as the half of the mean roughness height, i.e.  $d=k/2$, similar to Squire et al. (Reference Squire, Morrill-Winter, Hutchins, Schultz, Klewicki and Marusic2016). Here, similarly, the inertial range
 $3\sqrt Re_{\tau } - 0.15Re_{\tau }$ is considered for minimising the root mean square error in
 $\varPsi$ (3.1). For the P
 $24$ and P
 $36$ grit sandpapers, the deviations were found to be less than
 $1\,\%$ and
 $4\,\%$, respectively, for all the flow conditions; while the deviations vary between 2.5 and 10 % for the P
 $60$ grit sandpaper.
The dependence of the roughness function on the inner-normalised roughness height in figure 2 suggests that the four and two highest Reynolds number cases for the P $24$ and P
 $36$ grit sandpapers, respectively, namely the cases labelled as P
 $24Re3$, P
 $24Re4$, P
 $24Re5$, P
 $24Re6$, P
 $36Re5$ and P
 $36Re6$ in table 2, correspond to fully rough flow regime, while the rest of the flow conditions are in transitionally rough regime. For the P
 $24$ grit sandpaper, these results are very consistent with the skin-friction information in figure 1, however, especially for the P
 $60$ grit sandpaper, the transitionally rough regime was not observed in figure 1.
Figure 2 also shows that there is a clear difference between the current study and that of Squire et al. (Reference Squire, Morrill-Winter, Hutchins, Schultz, Klewicki and Marusic2016) in the transitionally rough regime for the P $36$ case. The present measurements show a larger value of
 $\Delta U^+$, suggesting that the roughness may overstimulate the boundary layer for lower values of
 $\delta /k$ thereby resulting in larger values of roughness function, especially in the transitionally rough regime. Moreover, for the P
 $36$ grit sandpaper, the measurements in the current study appear to reach the fully rough state for lower values of
 $k^+_s$ compared with Squire et al. (Reference Squire, Morrill-Winter, Hutchins, Schultz, Klewicki and Marusic2016) (
 $\delta /k_s>70$ for the transitionally rough cases where
 $k_s=1.96$ mm in their study). All of these observations could be attributed to lower values of
 $\delta /k_s$ in the current study compared with the previous work. However, it should also be noted here that sandpapers produced by different manufacturers can have different geometries, and in particularly the effective slope of the roughness could have an effect on the roughness function as shown by Schultz & Flack (Reference Schultz and Flack2009) and Chan et al. (Reference Chan, MacDonald, Chung, Hutchins and Ooi2015).
The lower values of  $\delta /k_s$ in the current study are primarily because of the shorter streamwise fetch (lower values of
 $\delta$ for a given free stream). However, it is possible that
 $\delta /k_s$ does not fully capture the overstimulation. In addition to
 $\delta /k_s$, the effect of streamwise development length can also be captured by
 $\varOmega = \delta U^+_{\infty }/x$, which is the ratio of the turbulent time scale to the mean flow time scale (Chauhan, Monkewitz & Nagib Reference Chauhan, Monkewitz and Nagib2009). A larger value of
 $\varOmega$ corresponds to shorter streamwise fetch while lower values would indicate a longer streamwise development length (the value of
 $\varOmega$ asymptotes to 0.305 at large Reynolds numbers for a smooth wall). It is possible to have similar values of
 $\delta /k_s$ with varying values of
 $\varOmega$ and this could also lead to overstimulation of the boundary layer. The values of
 $\varOmega$ in the current study are given in table 2. These values are consistent with the measurements in comparable ‘standard’ wind/water tunnel experiments. However, these values of
 $\varOmega$ in table 2 are 40 % higher than the value in Squire et al. (Reference Squire, Morrill-Winter, Hutchins, Schultz, Klewicki and Marusic2016). Therefore, in addition to the differences in
 $\delta /k_s$, the differences in
 $\varOmega$ could also lead to a larger value of
 $\Delta U^+$ for similar values of
 $k^+_s$. However, the values of the
 $k_s$ for a given surface do not change with
 $\varOmega$. The experimental study of Schultz & Flack (Reference Schultz and Flack2007), where they obtained similarly a high
 $\Delta U^+=4.6$ with
 $k_s^+=26$ on the fully rough asymptote of Nikuradse (Reference Nikuradse1933), supports this argument. In their turbulent boundary layer study,
 $\varOmega =0.5713$,
 $\delta /k_s=389$, and the roughness elements are similar to the honed pipe roughness of Shockling et al. (Reference Shockling, Alle and Smits2006) who also found similar results.
So, these findings suggest that it could be possible to reach the fully rough state at lower roughness Reynolds numbers by overstimulating the boundary layer (with relatively smaller values of  $\delta /k$ and/or shorter streamwise fetch). This could have a significant impact on correlations, especially in the transitionally rough regime where care should be taken to ensure that
 $\delta /k$ and/or
 $\varOmega$ does not impact the derived correlations required for prediction. In the current study, the correlation proposed by Nikuradse (Reference Nikuradse1933) fits the data very well.
3.3. Inner-normalised mean and turbulence statistics
Figure 3 shows the mean profiles of the streamwise velocity on semilogarithmic axes for all the flow and surface conditions investigated in the present study. These profiles were used to determine the roughness function,  $\Delta U^+\!$, presented in the previous section. These mean streamwise velocity profiles clearly show a log–linear region having a slope of
 $1/\kappa$ similar to smooth walls. Unlike the profiles reported previously by Squire et al. (Reference Squire, Morrill-Winter, Hutchins, Schultz, Klewicki and Marusic2016) over P
 $36$ grit sandpaper, these log–linear regions do not appear to extend down to the wall for any of the fully rough flow conditions (as discussed in § 3.2) even when similar
 $d$ is employed, i.e.
 $d=k/2$ as in Squire et al. (Reference Squire, Morrill-Winter, Hutchins, Schultz, Klewicki and Marusic2016). This suggests that the near-wall region exhibits a different trend in mean flow. This could be due to lower values of
 $\delta ^+$ considered in this study for similar values of
 $k^+_s$. However, it should also be noted that the spatial resolution (in viscous wall units, i.e.
 $\nu /u_{\tau }$) is between 20 and 40 for these fully rough flow conditions (see table 2). So, the resolution near the wall only has approximately four independent vectors where this trend is observed. Therefore, the limited spatial resolution could also lead to this lack of extension of the logarithmic behaviour down to the wall.
Mean streamwise velocity profiles for all the flow and surface conditions considered in this study. All flow and surface conditions are defined in table 2. The dashed black line has a slope of  $1/\kappa =0.39$.

The inner-normalised profiles of the streamwise and wall-normal velocity variance are presented in figure 4 for all the Reynolds numbers and surface conditions. It can been seen from these profiles that the development trend of the variance of the streamwise and wall-normal velocity profiles is similar to those for smooth walls. As argued previously by Flores & Jimenez (Reference Flores and Jimenez2006), the low-speed streaks and quasi-streamwise vortices associated with the near-wall cycle are disturbed by the roughness elements and therefore they are shorter in fully rough flows compared with smooth walls or transitionally rough flows. This results in a lack of the well known near-wall peak in the variance of the streamwise velocity in fully rough regimes (e.g. Schultz & Flack Reference Schultz and Flack2007; Squire et al. Reference Squire, Morrill-Winter, Hutchins, Schultz, Klewicki and Marusic2016). The present study is also in agreement with this observation. However, it should be noted again that the present study lacks good spatial resolution very near the wall at relatively higher Reynolds numbers.


3.4. Outer-normalised turbulent statistics and diagnostic plots
To assess the wall-similarity hypothesis of Townsend (Reference Townsend1956), the mean and turbulence properties in § 3.3 are further studied in outer-normalisation in this section. According to the wall-similarity hypothesis, at sufficiently high Reynolds numbers the outer region does not feel the roughness effects on the wall. Therefore, all the mean and turbulence profiles are expected to collapse into a single profile in the outer region (typically  $y/\delta \geq 0.3$) of the boundary layer when normalised by the outer units.
Figure 5 shows the defect form of the mean streamwise velocity profiles for all the rough-wall conditions. When these velocity defect profiles are compared for each surface condition individually, the maximum deviation between any two profiles for wall-normal locations  $y/\delta \geq 0.3$ were found to be less than
 $5\,\%$. Similarly, when all these surface and flow conditions are compared with the case P
 $24Re6$ (see figure 5
 $d$), the deviation (for
 $y/\delta \geq 0.3$) of any velocity defect profile from that of the P
 $24Re6$ flow condition was observed to be again less than
 $5\,\%$. The deviations from the same reference velocity defect profile (i.e. P
 $24Re6$) become less than
 $4\,\%$, when only the fully rough flow conditions are compared, i.e.
 $k_s^+\geq 91,\,\Delta U^+\geq 7.4$ (P
 $24Re3, P24Re4, P24Re5, P24Re6$, P
 $36Re5$ and P
 $36Re6$, based on the roughness function in figure 2). Here, the P
 $24Re6$ flow condition was chosen as reference, since it has the highest Reynolds number among other fully rough flow conditions as observed both in the skin-friction profile (see figure 1) and roughness function (see figure 2). We would like to note here that when the deviations of these individual defect profiles from a mean defect are determined based on the equation in Squire et al. (Reference Squire, Morrill-Winter, Hutchins, Schultz, Klewicki and Marusic2016), i.e.
 $\mid [(U_{\infty }-U)^+-\bar {D}^+]/(U^+-\Delta U^+)\mid$, all deviations were found to be less than
 $3\,\%$. Here,
 $\bar {D}^+$ is the mean defect of all rough-wall profiles. So, all these velocity defect analyses suggest that the outer-layer similarity holds (to within 5 %) for all the transitionally and fully rough flow conditions. This is consistent with the values of the wake parameter (
 $\varPi$) computed for all the profiles using the wake function of Coles (Reference Coles1956). The values of
 $\varPi$ across all the cases is in the range
 $0.61\pm 0.06$, which is consistent with the range found in the literature. Overall, although the values of
 $\delta ^+$ are not very high in the present study (
 $\delta ^+ =1281\text {--}6317$), the ratio
 $\delta /k(=45\text {--}111)$ or
 $\delta /k_s(=30\text {--}111)$ seems sufficient to collapse all these mean velocity defect profiles beyond
 $y/\delta \geq 0.3$.


Unlike the mean streamwise velocity, the variance of the streamwise and wall-normal velocities as well as the Reynolds shear stress as shown in figures 6(a,b) and 6(c), respectively, do not exhibit collapse in the outer layer (in outer scaling –  $u_{\tau }$ and
 $\delta$). If only the solid lines are considered in these figures, the maximum deviations from the smooth-wall direct numerical simulation (DNS) profiles of Sillero, Jimeenez & Moser (Reference Sillero, Jimeenez and Moser2013) (shown in yellow) are found to be around 10 % at
 $y/\delta =0.4$. Note that the extent of the deviation between the DNS of Sillero et al. (Reference Sillero, Jimeenez and Moser2013) (
 $\delta ^+\approx 2000$) and the hot-wire data of Carlier & Stanislas (Reference Carlier and Stanislas2005) (
 $\delta ^+\approx 5000$) is comparable to the differences observed in the present data.
Streamwise  $(a)$ and wall-normal
 $(b)$ velocity variances and Reynolds shear stress
 $(c)$ profiles for all the rough-wall flow conditions shown with a logarithmic abscissa. The rough-wall flow conditions represented by colour schemes are labelled in table 2 and figure 3. Here, dashed lines correspond to the P
 $24Re1$, P
 $36Re5$ and P
 $36Re6$ cases, where the deviations from the reference profiles are higher than the rest of the data. Data shown in yellow and cyan correspond to the smooth-wall data of Sillero et al. (Reference Sillero, Jimeenez and Moser2013) (DNS,
 $\delta ^+\approx 2000$) and Carlier & Stanislas (Reference Carlier and Stanislas2005) (hot wire,
 $\delta ^+\approx 5000$), respectively.

To eliminate the effect of  $u_{\tau }$ (and
 $d$) on the above observation, the outer-similarity was also investigated by using the diagnostic plot introduced by Alfredsson et al. (Reference Alfredsson, Segalini and Orlu2011, Reference Alfredsson, Orlu and Segalini2012), where the turbulence intensity (e.g.
 $\sqrt {\overline {u^2}}/U$) or shear stress (
 $\overline {-uv}/U^2$) profiles were plotted against
 $U/U_{\infty }$. Figures 7 and 8 show the resulting diagnostic plots for the streamwise and wall-normal velocity as well as for the Reynolds shear stress.
 $(a)$ Streamwise turbulence intensities
 $\sqrt {\overline {u^2}}/U$ plotted against the mean velocity normalised by the free stream velocity,
 $U/U_{\infty }$. The colour schemes represent various flow conditions as labelled in table 2 and figure 3. Dashed and solid blue lines correspond to the smooth and fully rough linear lines of Alfredsson et al. (Reference Alfredsson, Orlu and Segalini2012) and Castro et al. (Reference Castro, Segalini and Alfredsson2013), respectively. Symbols with circles and diamonds correspond to the smooth-wall data of Hutchins et al. (Reference Hutchins, Monty, Ganapathisubramani, Ng and Marusic2011) and Castro et al. (Reference Castro, Segalini and Alfredsson2013), respectively. Square (
 $k_s^+=8.5, \Delta U=2$) and plus (
 $k_s^+=203$,
 $\Delta U^+=9.7$) symbols represent the grit-rough-wall data of Brzek, Cal & Johansson (Reference Brzek, Cal and Johansson2008). In panel
 $(b)$ some comparisons (from the present data sets) are made for
 $\sqrt {\overline {u^2}}/U$ at similar
 $k_s^+$ or
 $\delta ^+$. In panel
 $(c)$ streamwise turbulence intensities at
 $U/U_{\infty }=0.55$ are plotted as a function of
 $y_0^+$, where
 $y_0$ is the roughness length. While square, circle and triangle symbols in panel
 $(c)$ represent the present P
 $24$, P
 $36$ and P
 $60$ grit sandpaper data, diamond symbols correspond to the data in Castro et al. (Reference Castro, Segalini and Alfredsson2013) for various rough surfaces. Here, filled symbols correspond to the cases where
 $k_s^+\geq 75$ and
 $\Delta U^+\geq 7$. The dashed line in panel
 $(c)$ corresponds to the fully rough regime based on
 $\Delta U^+$ (see figure 2).

 $(a)$ Wall-normal turbulence intensities,
 $\sqrt {\overline {v^2}}/U$ and
 $(b)$ Reynolds shear stress,
 ${\overline {-uv}}/U^2$, plotted against the mean velocity normalised by the free stream velocity,
 $U/U_{\infty }$. The colour schemes represent various flow conditions as labelled in table 2 and figure 3.

As can be seen in figure 7( $a$), the collapse in the turbulence intensity of the streamwise velocity component occurs for
 $k_s^+\geq 75$ and
 $\Delta U^+\geq 7$, which involves fully rough flow conditions from P
 $24$ and P
 $36$ (see table 2). As
 $k_s^+$ decreases, the profiles get closer to the smooth-wall data of Castro et al. (Reference Castro, Segalini and Alfredsson2013) and Hutchins et al. (Reference Hutchins, Monty, Ganapathisubramani, Ng and Marusic2011). However, the present fully rough profiles never reach the fully rough line of Castro et al. (Reference Castro, Segalini and Alfredsson2013) which corresponds to the fully rough data at much higher
 $k_s^+ (\geq 500)$. It should be noted here that the fully rough asymptote could also be dependent on surface morphology in addition to
 $k_s^+$ (Placidi & Ganapathisubramani Reference Placidi and Ganapathisubramani2018). Figure 7(
 $c$) further compares the intensities of the streamwise velocity at the location of
 $U/U_{\infty }=0.55$ for the present flow conditions as well as for those in various other rough-wall studies as examined in Castro et al. (Reference Castro, Segalini and Alfredsson2013). The collapse observed for the rough flows
 $k_s^+\geq 75$ in figure 7(
 $a$) is more clearly visible in figure 7(
 $c$) (see the filled symbols around dashed line). Similar collapse is also observed in the diagnostic plots of the turbulence intensity of the wall-normal velocity component (figure 8
 $a$) and Reynolds shear stress (figure 8
 $b$). Here, in these figures, the collapse seems to hold for lower
 $k_s^+$ values. The differences observed in figure 7(
 $a$) between the P
 $24$ and P
 $60$ cases, are more clear in the diagnostic plots of the turbulence intensity of the wall-normal velocity and Reynolds shear stress.
From the above velocity defect (for the mean streamwise velocity) and diagnostic plot (for the streamwise turbulence intensity) analysis, it is seen that although both methods indicate a collapse in the profiles for  $k_s^+\geq 75$, the former method suggests outer similarity for even transitionally rough flows. Moreover, the roughness function behaviour indicates that the flow could be fully rough for lower values of
 $k^+_s$ for some conditions. To explore this perceived discrepancy further, in the following section, we examine the wall similarity in the mean streamwise velocity, streamwise and wall-normal velocity variances, Reynolds shear stress and the spatial structure (using correlations) for the matched
 $k_s^+$ and
 $\delta ^+$ conditions.
3.5. Comparisons of turbulence statistics at matched conditions
Figure 9 shows several flow conditions that can be matched across different surfaces in terms of  $\delta ^+$ and
 $k^+_s$. The arrows in the figure show the closest conditions that can be matched across different cases, and we ensure that we compare matched conditions at different values of
 $\delta /k$ using different rough surfaces. Figures 10 and 11 compare several flow conditions for similar friction,
 $\delta ^+$, and roughness Reynolds numbers,
 $k_s^+$, respectively. While the mean streamwise velocity in defect form,
 $(U_{\infty }-U)^+$, is shown in the first column, the variance of the streamwise velocity,
 $\overline {u^2}^+$, is presented in the second column, and in the third column, the variance of the wall-normal velocity,
 $\overline {v^2}^+$ (solid lines), together with the Reynolds shear stress,
 $-\overline {uv}^+$ (dashed lines), are presented. Each column compares the related profiles for several (approximately) matched
 $\delta ^+$ or
 $k_s^+$, in increasing order from the top to the bottom of the columns. We cover transitionally rough and fully rough regimes for surfaces in these comparisons.
Schematics illustrating the approximately matched  $k_s^+$ (shown by yellow arrows) and
 $\delta ^+$ (shown by blue arrows) cases. Symbols shown by squares (black), circles (red) and triangles (green) correspond to the P
 $24$, P
 $36$ and P
 $60$ grit sandpapers, respectively.

(a–e) Inner-normalised mean streamwise velocity defect,  $(U_{\infty }-U)^+$; (f–j) variance of the streamwise velocity,
 $\overline {u^2}^+$, and (k–o) variance of the wall-normal velocity,
 $\overline {v^2}^+$, (solid lines) and Reynolds shear stress,
 $\overline{-uv}^+$ (dashed lines) at approximately matched Kármán number,
 $\delta ^+$. Black, red and green represent the P
 $24$, P
 $36$ and P
 $60$ grit sandpapers, respectively. Data represented in the subplots of panels (a–e), (f–j) and (k–o) are: (a,f,k) P
 $24Re2\, (\delta ^+=2275, k_s^+=77)$ and P
 $36Re2\, (\delta ^+=2042, k_s^+=41)$ and P
 $60Re3\, (\delta ^+=2434, k_s^+=24)$; (b,g,l) P
 $24Re3\, (\delta ^+=3276, $
 $ k_s^+=105)$ and P
 $60Re4\, (\delta ^+=3251, k_s^+=31)$; (c,h,m) P
 $24Re4 \,(\delta ^+=4296, k_s^+=134)$ and P
 $36Re4\, (\delta ^+=3876, $
 $k_s^+=75)$ and P
 $60Re5\, (\delta ^+=4058, k_s^+=38)$; (d,i,n) P
 $36Re5\, (\delta ^+=4769, k_s^+=91)$ and P
 $60Re6 \,(\delta ^+=4884, $;
 $ k_s^+=46)$ (e,j,o) P
 $24Re5 \,(\delta ^+=5364, k_s^+=165)$ and P
 $36Re6 \,(\delta ^+=5532, k_s^+=105)$. Data shown in magenta in panels (f,k) correspond to the DNS data of Sillero et al. (Reference Sillero, Jimeenez and Moser2013) for smooth wall at
 $\delta ^+\approx 2000$; while the magenta and yellow symbols presented in panel (g–j) correspond to the smooth and rough-wall (P
 $36$ grit sandpaper) data, respectively, of Squire et al. (Reference Squire, Morrill-Winter, Hutchins, Schultz, Klewicki and Marusic2016) at (g)
 $\delta ^+\approx 2900$,
 $k_s^+=41$; (h)
 $\delta ^+\approx 4000$,
 $k_s^+=22$; (i)
 $\delta ^+\approx 4700$,
 $k_s^+=121$; (j)
 $\delta ^+\approx 5400$,
 $k_s^+=68$. In panels (l,o) the data of Morrill-Winter et al. (Reference Morrill-Winter, Squire, Klewicki, Hutchins, Schultz and Marusic2017) (shown by yellow symbols) are presented for the same flow and surface conditions in Squire et al. (Reference Squire, Morrill-Winter, Hutchins, Schultz, Klewicki and Marusic2016) (in panels g,j, respectively). Data shown in blue in panel (l) correspond to the rough flow over P80 grit sandpaper of Flack et al. (Reference Flack, Schultz and Connelly2007) at
 $\delta^+ = 3250, k_s^+ = 36$.

(a–c) Inner-normalised mean streamwise velocity defect,  $(U_{\infty }-U)^+$; (d–f) variance of the streamwise velocity,
 $\overline {u^2}^+$, and (g–i) variance of the wall-normal velocity,
 $\overline {v^2}^+$, (solid lines) and Reynolds shear stress,
 $\overline {uv}^+$ (dashed lines) at approximately matched roughness Reynolds number,
 $k_s^+$. Black, red and green represent the P
 $24$, P
 $36$ and P
 $60$ grit sandpapers, respectively. Data represented in the subplots of panels (a–c), (d–f) and (g–i) are: (a,d,g) P
 $36Re1 \,(k_s^+=33,\delta ^+=1617)$ and P
 $60Re4 \,(k_s^+=31, \delta ^+=3251)$; (b,e,h) P
 $36Re2 \,(k_s^+=41,\,\delta ^+=2042)$ and P
 $60Re5 \,(k_s^+=38,\,\delta ^+=4058)$; (c,f,i) P
 $24Re2 \,(k_s^+=77, \delta ^+=2275)$ and P
 $36Re4 \,(k_s^+=75, \delta ^+=3876)$. Yellow symbols correspond to the rough-wall (P
 $36$ grit sandpaper) data of Morrill-Winter et al. (Reference Morrill-Winter, Squire, Klewicki, Hutchins, Schultz and Marusic2017) at
 $\delta ^+\approx 2900 \,(k_s^+=41)$ (e,h),
 $\delta ^+\approx 5400\,(k_s^+=69)$ (f,i). Data shown in blue in panels (d,e,g,h) correspond to the rough flow over P
 $80$ grit sandpaper of Flack et al. (Reference Flack, Schultz and Connelly2007) at
 $\delta ^+=3250, k_s^+=36$.

For the matched  $\delta ^+$ comparisons in figure 10, it can be seen that the variance of the streamwise and wall-normal velocities as well as the Reynolds shear-stress profiles are mostly in good agreement with each other as well as with the smooth-wall profiles of Sillero et al. (Reference Sillero, Jimeenez and Moser2013) (in figure 10f,k) and Squire et al. (Reference Squire, Morrill-Winter, Hutchins, Schultz, Klewicki and Marusic2016) (in figure 10g–j) independent of the type of the flow regime. However, these streamwise variance profiles exhibit differences, which are extending into the outer region, with the rough-wall data of Squire et al. (Reference Squire, Morrill-Winter, Hutchins, Schultz, Klewicki and Marusic2016) (see figure 10g,h). Note that these two data sets of Squire et al. (Reference Squire, Morrill-Winter, Hutchins, Schultz, Klewicki and Marusic2016) are in the transitionally rough regime, and their streamwise measurement length is much longer than the one in the current study. So, the longer streamwise measurement lengths employed by Squire et al. (Reference Squire, Morrill-Winter, Hutchins, Schultz, Klewicki and Marusic2016) and accordingly the lower values of
 $\varOmega$ (0.47 and 0.42 in figures 10g and 10h, respectively) compared with those in the present study (see table 2) could explain these differences in the streamwise variance profiles. Hence, the overstimulation of the boundary layer due to shorter streamwise fetch causes higher turbulence intensities in the transitionally rough regime. This is consistent with the previous discussion on the roughness function in § 3.2. In figure 10(i,j), however, the variance profiles of Squire et al. (Reference Squire, Morrill-Winter, Hutchins, Schultz, Klewicki and Marusic2016) are in the fully rough regime, therefore, the impact of the differences in the streamwise measurement lengths is not apparent in the outer layer of the profiles.
The wall-normal velocity variance and Reynolds shear-stress profiles (see figure 10k–o) also exhibit self-similar behaviour at similar  $\delta ^+$ in the outer region. However, similar to the streamwise velocity variances as discussed above, the variance of the wall-normal velocity and Reynolds shear-stress values are higher than those in Morrill-Winter et al. (Reference Morrill-Winter, Squire, Klewicki, Hutchins, Schultz and Marusic2017) (figure 10l) in the transitionally rough regime. In the fully rough regime, as can be seen in figure 10(o), these differences in these profiles (between the current P
 $24$ and their P
 $36$) disappear in the outer region. The reason why the current P
 $36$ grit sandpaper has still higher values is that
 $u_{\tau }$ is probably lower than the actual value (up to
 $5\,\%$, see the appendix). The last data point for P
 $36$ (i.e. P
 $36Re6$) in the roughness function in figure 2, which estimates lower
 $\Delta U^+$ than the Nikuradse fit, supports this. Note also that these profiles, i.e. P
 $36Re6$, correspond to the dashed lines in figure 6, which are among the few cases that deviate significantly from the rest of the profiles.
In figure 11, we compare the velocity variances and Reynolds shear-stress profiles at approximately matched  $k_s^+$. Here, we also include some comparisons from the study of Morrill-Winter et al. (Reference Morrill-Winter, Squire, Klewicki, Hutchins, Schultz and Marusic2017) (P
 $36$ grit sandpaper) and Flack et al. (Reference Flack, Schultz and Connelly2007) (P
 $80$ grit sandpaper). As can be seen in these figures, similar to the cases discussed for the matched
 $\delta ^+$, differences between the current rough-wall profiles and those of Morrill-Winter et al. (Reference Morrill-Winter, Squire, Klewicki, Hutchins, Schultz and Marusic2017) were observed in the transitionally rough regime (figure 11e,h), extending again into the outer layer. These differences become less distinct in the fully rough regime (figure 11f,i). The variance profiles of Flack et al. (Reference Flack, Schultz and Connelly2007) support the lack of outer similarity in the transitionally rough regime between the current data sets and that of Morrill-Winter et al. (Reference Morrill-Winter, Squire, Klewicki, Hutchins, Schultz and Marusic2017). In the study of Flack et al. (Reference Flack, Schultz and Connelly2007), the value of
 $\varOmega$ is
 $0.48$ (achieved in a water tunnel), which is almost identical to the value in Morrill-Winter et al. (Reference Morrill-Winter, Squire, Klewicki, Hutchins, Schultz and Marusic2017) (
 $\varOmega =0.47$). Therefore, although their streamwise measurement length (1.68 m) is quite short compared with that in the current study and that in the study of Morrill-Winter et al. (Reference Morrill-Winter, Squire, Klewicki, Hutchins, Schultz and Marusic2017), their streamwise turbulence profile exhibits similar behaviour to that of Morrill-Winter et al. (Reference Morrill-Winter, Squire, Klewicki, Hutchins, Schultz and Marusic2017). Note that all the data sets in figure 11(b,e,h) have similar values of
 $\delta /k_s$ (between 50 and 110). Moreover, when the current rough flows are compared at matched
 $k_s^+$ conditions, it is seen that the profiles of P
 $36$ and P
 $60$ grit sandpapers (see figure 11d,g,e,h) are overlapping better than those of P
 $24$ and P
 $36$ (see figure 11f,i). This could be explained by the higher values of
 $\delta /k$ (or
 $\delta /k_s$) for the P
 $60$ and P
 $36$ grit sandpapers compared with P
 $24$ (see figure 9). The value of
 $\delta /k$ (or
 $\delta /k_s$) is lower for P
 $24$ roughness and its effect could penetrate into the outer layer.
Results thus far have suggested a lack of similarity in the turbulence quantities for specific cases, including Reynolds shear stress. However, it is unclear if this is because there are strong shear-stress events for some cases compared with others, or if there is an overall change in the strength of the turbulent events. This can be examined through a quadrant analysis of the streamwise–wall-normal velocity fluctuations, especially the sweep and ejection events.
So, to examine the impact of the  $k^+_s$ and
 $\delta ^+$ on ejection,
 $Q2$, and sweep,
 $Q4$, events as well as on their frequency of occurrences within the boundary layer, namely
 $N2$ and
 $N4$, respectively, we further compare some matched
 $k_s^+$ and
 $\delta ^+$ cases (i.e. P
 $24Re1$, P
 $24Re3$, P
 $36Re3$, P
 $36Re6$ and P
 $60Re4$) in figure 12. Here, we employed the hyperbolic hole approach of Lu & Willmarth (Reference Lu and Willmarth1973), where the hyperbolic hole size
 $H=0$ (figure 12a,b) and
 $H=1$ (figure 12c,d). (For clarity, only some matched cases are presented here, but similar results are obtained when all other cases are also considered.) As can be seen in figure 12, we observed no significant differences in the
 $Q2$ and
 $Q4$ events or in their frequency of occurrences between
 $0.05\leq y/\delta \leq 1$ both for
 $H=0$ and
 $H=1$. This shows that neither
 $k_s^+$ nor
 $\delta ^+$ have a significant impact on the relative make-up of the ejection and sweep events to the total Reynolds shear stress as well as on the frequency of their occurrences.
(a,c) Contribution ( $\%$) of ejection,
 $Q2$ (solid lines), and sweep,
 $Q4$ (dashed lines), events to the total Reynolds shear stress for some matched (either
 $\delta ^+$ or
 $k_s^+$) rough-wall flows, i.e. P
 $24Re1$, P
 $24Re3$, P
 $36Re3$, P
 $36Re6$ and P
 $60Re4$. (b,d) The occurrence (
 $\%$) of these ejection,
 $N2$ (solid lines), and sweep,
 $N4$ (dashed lines), events within the boundary layer between
 $0.05\leq y/\delta \leq 1$. Here
 $H=0$ in panels (a,b) and
 $H=1$ in panels (c,d).

In the literature there are different findings regarding the effect of roughness on the ejection and sweep events. For instance, Flack et al. (Reference Flack, Schultz and Connelly2007) compared the ejection and sweep events for several rough (created by sandpaper and mesh) and smooth flows, and they observed no significant changes in the contribution of these events to the total Reynolds shear stress as well as in the frequency of these events. Morrill-Winter et al. (Reference Morrill-Winter, Squire, Klewicki, Hutchins, Schultz and Marusic2017), however, reported significant differences among three different rough flows (all created by the P $36$ grit sandpaper) in the profiles of the
 $Q4$ events, while no significant differences were found in the profiles of
 $Q2$ and the frequency of both events. They found that increasing
 $k^+_s$ (in their cases not necessarily increasing
 $\delta /k_s$) results in more
 $Q4$ events. Our results appear to be consistent with the findings of Flack et al. (Reference Flack, Schultz and Connelly2007) that suggest that the extent of
 $Q2$ and
 $Q4$ events do not depend on either
 $k^+_s$ or
 $\delta ^+$.
Overall, the collapse of the quadrant activities across different cases suggests that the lack of the similarity in the strength of the shear stress can be attributed to an overall change in the shear-stress events (rather than a relative one, which would be captured in the quadrant analysis). Therefore, the lower value of  $\delta /k_s$ has an effect across all events proportionally and therefore leads to self-similar behaviour when compared across different cases.
3.6. Spatial structure at matched conditions
Thus far, we have focused our comparison on the strength of turbulence and in this final section we examine the similarity in the spatial structure of turbulence across different matched conditions. This is done by comparing the large-scale structures that are present in the flow through two-point spatial correlations. In the streamwise–wall-normal planes, the correlation coefficient,  $R_{AB}$, with reference wall-normal position (
 $y_{ref}$) is defined as
 \begin{equation} {R}_{AB}=\frac{\overline{A(\,{y}_{ref}, {x})\,B(\,{y}_{ref}+\Delta {y}, {x}+\Delta {x})}}{A_{rms}(\,{y}_{ref})\,B_{rms}(\,{y}_{ref}+\Delta {y})}. \end{equation}
Here,  $A$ and
 $B$ are the quantities of interest at two locations separated in the streamwise and wall-normal directions by
 $\Delta x$ and
 $\Delta y$, respectively, while
 $A_{rms}$ and
 $B_{rms}$ are the root mean square of
 $A$ and
 $B$ at
 $y_{ref}$ and
 $(y_{ref}+\Delta y)$, respectively. The overbar denotes ensemble averaging.
Figure 13 compares the correlation coefficients of the streamwise velocity,  $R_{uu}$, and the wall-normal velocity,
 $R_{vv}$, fluctuations at two different reference wall-normal locations, namely at
 $y_{ref}/\delta =0.15$ and
 $y_{ref}/\delta =0.4$, for five different rough-wall cases (P
 $24Re1$, P
 $24Re3$, P
 $36Re3$, P
 $36Re6$ and P
 $60Re4$). Here in panels (a–d), two transitionally rough cases, i.e. P
 $24Re1$ (black contours) and P
 $36Re3$ (red contours) are compared at similar
 $k_s^+(58,61)$. As can be seen in these figures, there are no significant differences in the shape and size of the correlation coefficients, both for
 $R_{uu}$ and
 $R_{vv}$, at either wall location, when these two transitionally rough flows are compared.
(a–d, e–h) Streamwise ( $R_{uu}$) and wall-normal velocity (
 $R_{vv}$) correlation coefficients shown in panels (a,c,e,g) and (b,d,f,h), respectively, determined at two different reference wall-normal locations, i.e.
 $y_{ref}/\delta =0.15$ (a,b,e,f) and
 $y_{ref}/\delta =0.4$ (c,d,g,h). Data shown in panels (a–d) correspond to the cases P
 $24Re1$ (black) and P
 $36Re3$ (red), while contours in panels (e–h) represent the data belong to the cases P
 $24Re3$ (black), P
 $36Re6$ (red) and P
 $60Re4$ (green), respectively. Contour lines are from
 $0$ to
 $1$ with an increment of
 $0.1$.

In figure 13(e–h), we compare  $R_{uu}$ and
 $R_{vv}$ for two fully rough flow cases at similar
 $k_s^+$, i.e. P
 $24Re3$ (black contours) and P
 $36Re6$ (red contours), in addition to the matched
 $\delta ^+$ cases for P
 $24Re3$ (
 $k_s^+=105$) and P
 $60Re4$ (
 $k_s^+=31$). Similarly, no significant changes in the correlation coefficients were found among these three different conditions, which shows that the average large-scale structures (in terms of their shape, size and the angle) are not affected by either
 $k_s^+$ or
 $\delta ^+$. In addition to the correlations of the velocity fluctuations, as can be seen in figure 14, the cross-correlations between the velocities, i.e.
 $R_{uv}$, result in similar average structures independent of the
 $k_s^+$ and
 $\delta ^+$.
Resulting two-point correlations of  $R_{uv}$ with the reference wall-normal locations of
 $y/\delta =0.15$ (a,c) and
 $y/\delta =0.4$ (b,d). In panels (a,b) P
 $24Re1$ and P
 $36Re3$ at similar
 $k_s^+ (\sim 60)$ are compared; while in panels (c,d) P
 $24Re3$ and P
 $36Re6$ have similar
 $k_s^+ (\sim 105)$, and P
 $24Re3$ and P
 $60Re4$ have similar
 $\delta ^+(\sim 3300)$. The contour lines are from
 $-0.1$ to
 $-0.5$ with an increment of
 $-0.05$.

In figure 15, we further quantified the streamwise and wall-normal length of the correlation coefficients for several reference wall locations based on  $R_{uu}, R_{vv}=0.5$. Here, the streamwise (
 $l_{x,uu}$ and
 $l_{x,vv}$) and wall-normal (
 $l_{y,uu}$ and
 $l_{y,vv}$) length scales of the correlation coefficients were determined at
 $\Delta y/\delta =0$ and
 $\Delta x/\delta =0$, respectively (see figure 13). Note that in this figure, the results for only matched
 $k_s^+$ and
 $\delta ^+$ cases are presented together with the results of Volino et al. (Reference Volino, Schultz and Flack2009) that belong to smooth wall and two-dimensional (2-D) (bar) and three-dimensional (3-D) (mesh) rough surfaces. However, the same results were obtained for all other conditions (in terms of trends in the length scales).
Streamwise (a,c) and wall-normal (b,d) length of the correlation coefficients of the streamwise velocity fluctuations (a,b) and wall-normal velocity fluctuations (c,d) at several reference-wall locations,  $y/\delta$. Data correspond to the contour level of the correlation coefficient where
 $R_{uu}=0.5$ (a,b) and
 $R_{vv}=0.5$ (c,d). Here, the streamwise and wall-normal length scales of the correlation coefficients were determined at
 $\Delta y/\delta =0$ and
 $\Delta x/\delta =0$, respectively (see figure 13). Yellow triangle, square and circle symbols correspond to the smooth wall, 3-D (mesh) and 2-D (bar) rough-wall data of Volino, Schultz & Flack (Reference Volino, Schultz and Flack2009) for
 $R_{uu}=0.5$.

From the correlations of the streamwise velocity fluctuations, as can be seen in figure 15(a), the streamwise lengths of the correlation peaks,  $l_{x,uu}$, determined at different reference wall locations,
 $y/\delta$, are very similar, and the values are very close to the streamwise length scales reported by Volino et al. (Reference Volino, Schultz and Flack2009) over the smooth and 3-D rough surfaces. The wall-normal length of the same correlation coefficients,
 $l_{y,uu}$, on the other hand, (see figure 15b), increases almost linearly with
 $y/\delta$ up to
 $y/\delta =0.2$ (consistent with the attached eddy hypothesis of Townsend (Reference Townsend1956)), and beyond this point the rate of this increase decreases and finally the variations in
 $l_{y,uu}$ become less with wall distance for
 $y/\delta \geq 0.4$. These
 $l_{y,uu}$ values significantly deviate from the results of Volino et al. (Reference Volino, Schultz and Flack2009) over the smooth and 3-D rough surfaces after
 $y/\delta =0.2$. The value of
 $\delta /k_s$ in Volino et al. (Reference Volino, Schultz and Flack2009) for the 3-D roughness (which is woven wire mesh) was approximately 20 and is stronger compared with those here (where all
 $\delta /k_s \geq 30$). We note that only the wall-normal length scale is affected by this and not the streamwise length. In fact, the trend of
 $l_{y,uu}$ with
 $y/\delta$ is similar to the trend of
 $l_{y,uu}$ over the 2-D rough surface, which does not follow outer-layer similarity. The exact reasons for this discrepancy are unclear especially given the agreement in all other aspects.
The streamwise and wall-normal lengths of the correlation coefficients of the wall-normal velocity fluctuations, i.e.  $l_{x,vv}$ (figure 15c) and
 $l_{y,vv}$ (figure 15d), respectively, at each reference wall location are observed to be very similar to the smooth wall and 3-D rough-wall values of Volino et al. (Reference Volino, Schultz and Flack2009). Both
 $l_{x,vv}$ and
 $l_{y,vv}$ increase significantly (again linearly) near the wall up to
 $y/\delta =0.2$, and beyond this wall location the rate of this increase decreases. Finally, after
 $y/\delta =0.4$, the variations in the length of these structures with wall-normal distance become less.
So, although the velocity variances or Reynolds shear-stress profiles seem to be affected at least for the wall locations  $y/\delta \leq 0.4$ depending on the surface or flow conditions, the average flow structures (with the exception of the vertical length scale of the streamwise velocity when compared with the results of Volino et al. (Reference Volino, Schultz and Flack2009) with 3-D roughness), stay self-similar at each reference wall location between
 $0.1\leq y/\delta \leq 0.7$ for all transitionally and fully rough flows. Beyond
 $y/\delta =0.4$, moreover, as the results suggest the size of the average large-scale structures remain also very similar independent of the wall location.
4. Conclusions
In this paper, we examine the characteristics of turbulent boundary layers over three different rough surfaces created with P $24$, P
 $36$ and P
 $60$ grit sandpapers. The experimental dataset used was acquired with high-resolution planar PIV in the streamwise–wall-normal plane for a range of Reynolds number between
 $\delta ^+=1200\text {--}6300$, which consists of a number of transitionally and fully rough flow conditions, where
 $45\leq \delta /k\leq 111$ (
 $30\leq \delta /k_s\leq 111$), including several matched cases for
 $\delta ^+$ and
 $k_s^+$. In addition to the PIV measurements, direct drag measurements were obtained using a floating-element force balance to infer the wall-friction velocity,
 $u_{\tau }$, from the skin-friction information.
The roughness function determined for each flow condition,  $\Delta U$, was found to follow a Nikuradse-type roughness function across the entire range of the measurements for all three sandpapers. At lower values of
 $k^+_s$, the results do not conform to recent measurements at higher values of
 $\delta ^+$, which could be a result of overstimulation of the boundary layer due to limited streamwise development length that can be captured through
 $\delta /k_s$ or ratio of turbulent to mean flow time scale (
 $\varOmega$).
To investigate the wall-similarity hypothesis of Townsend (Reference Townsend1956), the mean streamwise velocity-defect and diagnostic plot of the turbulence intensity of the streamwise velocity were examined. While the latter showed that the outer-layer similarity holds for  $k_s^+\geq 75$ and
 $\Delta U^+\geq 7$, the velocity defect profiles suggested that this hypothesis holds for even much smaller
 $k_s^+$ and
 $\Delta U^+$ values. With both methods, however, some of the transitionally rough flow conditions, at least, in addition to all the fully rough cases, were found to collapse into a single profile in the outer layer of the boundary layer. The variance of the streamwise and wall-normal velocities were also examined in the outer scaling, and significant scatter was found, suggesting a lack of a complete collapse in the outer layer.
Analysis at several matched  $k_s^+$ and
 $\delta ^+$ cases between the three sandpapers were performed to isolate the causes for similarity (or lack thereof) in strength and structure. It was observed that for the matched
 $\delta ^+$ cases, all the mean streamwise velocity defect, streamwise and wall-normal velocity variances as well as the Reynolds shear-stress profiles (in the outer-wall units) are self-similar in the outer layer independent of the surface roughness. This similarity extends closer to the wall for the wall-normal velocity variances and Reynolds shear-stress profiles for weaker roughness (lower
 $k_s$), which could be a result of higher
 $\delta /k_s$.
For the matched  $k_s^+$ flows, all velocity profiles were observed to collapse better for higher values of
 $k_s/\delta$. On the other hand, when the present turbulence profiles (velocity variance and Reynolds shear stress) were compared with those in Squire et al. (Reference Squire, Morrill-Winter, Hutchins, Schultz, Klewicki and Marusic2016) (and their follow-up paper Morrill-Winter et al. (Reference Morrill-Winter, Squire, Klewicki, Hutchins, Schultz and Marusic2017)), differences were observed in the transitionally rough regime. The present profiles exhibit higher turbulence intensity and shear stress, and these differences were observed to extend into the outer layer. This could be explained by the overstimulation of the boundary layer in the present study for all the rough surfaces due to a shorter streamwise measurement length and accordingly higher values of
 $\varOmega$. In the fully rough regime, however, no significant differences were observed in the outer layer of these turbulence profiles.
Moreover, no significant modifications were found in the ejection and sweep events as well as in the frequency of their occurrences in the outer region. This suggests that the lack of similarity is due to an overall change in the strength of turbulence rather than in the intense values. This finding is inconsistent with the previous work based on a single sand-grain roughness (Morrill-Winter et al. Reference Morrill-Winter, Squire, Klewicki, Hutchins, Schultz and Marusic2017). The structure of turbulence as deciphered using cross-correlation (and corresponding length scales) exhibit similarity in most quantities, except the wall-normal extent of the streamwise fluctuations. It appears that the vertical extent of the structures is consistently larger for all the cases examined here compared with the 3-D roughness in Volino et al. (Reference Volino, Schultz and Flack2009).
Overall, this study has presented a complete dataset for flow over sand-grain roughness, essentially revisiting Nikuradse's experiments for a boundary layer over a range of  $\delta ^+$ but with varied values of
 $k^+_s$ and
 $\delta /k$.
Acknowledgements
We would like to also acknowledge the referees for their comments and suggestions, which substantially improved the quality of the paper. All data presented in this study are openly available from the University of Southampton repository at https://doi.org/10.5258/SOTON/D1613.
Funding
We gratefully acknowledge the financial support from the Engineering and Physical Sciences Research Council through their grants (no. EP/P009638/1 and no. EP/R034370/1).
Declaration of interests
The authors report no conflict of interest.
Appendix. Uncertainties in wall-friction velocity
As stated in § 3.1, consistent with the uncertainty estimate in Ferreira et al. (Reference Ferreira, Rodriguez-Lopez and Ganapathisubramani2018), the uncertainties in the present wall-friction velocities are expected to be within  $5\,\%$ for all the surface and flow conditions in the present study.
The comparisons made in figures 6 and 10(j,o) confirm this uncertainty estimation. The data presented in figure 6 for the P $36$ grit sandpaper, i.e. P
 $36Re6$ (with dash line), has the maximum deviation from the reference DNS profiles. Therefore, we will consider this case to be an estimate of the maximum uncertainty in the whole data sets. When the turbulence profiles of the P
 $36Re6$ case are compared with those of the P
 $24Re5$ in figure 10(j,o) together with the data of Squire et al. (Reference Squire, Morrill-Winter, Hutchins, Schultz, Klewicki and Marusic2016) and Morrill-Winter et al. (Reference Morrill-Winter, Squire, Klewicki, Hutchins, Schultz and Marusic2017), differences are observed between the profiles of P
 $36Re6$ and the rest of the profiles which are extending into the outer layer (see figure 16). These cases are in the fully rough regime (the profiles of Squire et al. (Reference Squire, Morrill-Winter, Hutchins, Schultz, Klewicki and Marusic2016) and Morrill-Winter et al. (Reference Morrill-Winter, Squire, Klewicki, Hutchins, Schultz and Marusic2017) with
 $k_s^+=68$ and
 $k_s^+=69$, respectively, are very close to fully rough regime), therefore, we expect outer-layer similarity at similar
 $\delta ^+$. If we increase the
 $u_{\tau }$ of the P
 $36Re6$ by
 $5\,\%$, we see the overlap between the profiles becomes very good. Also, the plateau of the
 $-\overline {uv}^+$ profile gets very close to unity similar to the profile of P
 $24Re5$. If we further increase the
 $u_{\tau }$ of the P
 $36Re6$ until the
 $-\overline {uv}^+$ profile overlaps very well with the
 $-\overline {uv}^+$ of the P
 $24Re5$ (which means
 $8.6\,\%$ increase in
 $u_{\tau }$), however, the
 $c_f$ of P
 $36Re6$ and P
 $24Re6$ becomes the same. This would not make sense. As this comparison also shows, the uncertainties in
 $u_{\tau }$ for all the surface and flow conditions considered in this study are within
 $5\,\%$ (note that this would also include the uncertainties in
 $u$ and
 $v$ from PIV).
Variance of the streamwise velocity,  $\overline {u^2}^+$, (a) and Reynolds shear stress,
 $\overline {-uv}^+$, (b) profiles at approximately matched
 $\delta ^+$ for the P
 $36Re6$ (solid red line,
 $\delta ^+=5532$ and
 $k_s^+=105$) and P
 $24Re5$ (solid black line,
 $\delta ^+=5364$ and
 $k_s^+=165$) cases. Here, the dashed line and line with circles correspond to the profiles of the P
 $36Re6$ case with
 $5\,\%$ and
 $8.6\,\%$, respectively, increase in the
 $u_{\tau }$. While the magenta and yellow symbols presented in panel (a) correspond to the smooth and rough-wall (P
 $36$ grit sandpaper) data, respectively, of Squire et al. (Reference Squire, Morrill-Winter, Hutchins, Schultz, Klewicki and Marusic2016) at (a)
 $\delta ^+\approx 5400$
 $k_s^+=68$; the yellow symbols in panel (b) correspond to the data of Morrill-Winter et al. (Reference Morrill-Winter, Squire, Klewicki, Hutchins, Schultz and Marusic2017) at the same flow and roughness condition.



