Introduction
Impulse dyscontrol refers to a tendency of acting prematurely or without judgment and is a prominent behavioral symptom in dementia (de Mendonça et al., Reference de Mendonça2004; Ismail et al., Reference Ismail2016; Ossenkoppele et al., Reference Ossenkoppele2015; Rascovsky et al., Reference Rascovsky2011; Taragano et al., Reference Taragano2009). While impulsivity is recognized as a core component in several psychiatric disorders (Moeller et al., Reference Moeller2001), it is increasingly recognized as a feature in neurodegenerative diseases (Ossenkoppele et al., Reference Ossenkoppele2015; Rascovsky et al., Reference Rascovsky2011). Difficulties in impulse control can also emerge in advance of dementia, at the preclinical or prodromal stages of neurodegenerative disease, as characterized in the dementia risk state mild behavioral impairment (MBI) (Bateman et al., Reference Bateman2020; Gill et al., Reference Gill2020; Ismail et al., Reference Ismail2016; Reference Ismail2021).
Operationalizing impulse dyscontrol has proven difficult, as a host of neural substrates and cognitive functions likely underlie its transdiagnostic expressions (Dalley et al., Reference Dalley, Everitt and Robbins2011; Fineberg et al., Reference Fineberg2014; Moeller et al., Reference Moeller2001; Strickland and Johnson, Reference Strickland and Johnson2020). Impulsivity is often considered a trait giving rise to several problematic behaviors and symptoms (García-Forero et al., Reference García-Forero2009; Moeller et al., Reference Moeller2001). In neurodegenerative diseases, a division to generalized impulsivity, characterized by orbitofrontal dysfunction, and person-based impulsivity, characterized by impulse dyscontrol in social settings has been suggested (Paholpak et al., Reference Paholpak2016). In at-risk states for dementia, symptoms of impulse dyscontrol can be prodromal markers of behavioral variant frontotemporal dementia (bvFTD; Rascovsky et al., Reference Rascovsky2011) or behavioral-dysexecutive variant of Alzheimer’s disease (Ossenkoppele et al., Reference Ossenkoppele2015). These symptoms vary in their prevalence, conceptual brevity (e.g. hyperorality is a narrower construct than aggressive tendencies), in their biological correlates, interpersonal dimensions, relationships with cognition, clinical significance, and the extent to which they overlap with neighboring constructs (Allegri et al., Reference Allegri2006; Bozeat, Reference Bozeat2000; Cummings et al., Reference Cummings2015; García-Forero et al., Reference García-Forero2009; Moheb et al., Reference Moheb2019; Nyatsanza, Reference Nyatsanza2003; Rosenberg et al., Reference Rosenberg, Nowrangi and Lyketsos2015; Ruthirakuhan et al., Reference Ruthirakuhan2018; Sano et al., Reference Sano2018).
Further challenges arise from traditional neuropsychiatric symptom measures probing a relatively short period of time, e.g. the last month, allowing for both transient states as well as more persistent symptoms. Equating symptoms of this nature with symptoms of predominantly neurological origin may pose a barrier to understanding the nature of neuropsychiatric symptoms. Psychiatric instruments, on the other hand, may be limited by including only symptoms relevant for diagnosing a specific disorder (Fineberg et al., Reference Fineberg2014) and, thus, may not represent empirically relevant dimensions (Krueger et al., Reference Krueger2018).
Symptoms of impulse dyscontrol could feasibly have mutually reinforcing relationships. For example, impulsivity could lead to various problematic behaviors (García-Forero et al., Reference García-Forero2009), whereas an aggressive outburst could be a response to other people trying to restrict these problematic behaviors (Paschali et al., Reference Paschali2018). However, data on the level of individual impulsivity symptoms have been typically used diagnostically or descriptively, not to explore the possibility of systematic relationships between the symptoms as such (e.g. Bozeat, Reference Bozeat2000; Morris et al., Reference Morris, Hope and Fairburn1989; Suhonen et al., Reference Suhonen2017). To address this gap, we explore the network structures of these symptoms in individuals with mild cognitive impairment (MCI) or subjective cognitive decline (SCD). To our knowledge, this is the first network analysis of impulse dyscontrol in a pre-dementia sample.
Methods
Participants
The participants were drawn from the Prospective Study for Persons with Memory Symptoms (PROMPT) registry (Sheikh et al., Reference Sheikh2018). The PROMPT registry started in July 2010 to collect data from patients referred to a specialty dementia clinic at the University of Calgary staffed by neurologists and psychiatrists. The participants in the present study visited the clinics between March 2016 and October 2019. Patients were referred to the clinics on the basis of suspected impairment in neuropsychological or behavioral functions. The assessment protocol included taking a detailed medical history, Lawton–Brody Scale for instrumental activities of daily living (Lawton and Brody, Reference Lawton and Brody1969), Consortium to Establish a Registry for Alzheimer’s disease (CERAD) neuropsychological test battery (Welsh et al., Reference Welsh1994), Montreal Cognitive Assessment (MoCA; Nasreddine et al., Reference Nasreddine2005), and Mild Behavioral Impairment Checklist (MBI-C; Ismail et al., Reference Ismail2017). All patients referred to the clinic are eligible to participate in the registry, which is done with written informed consent.
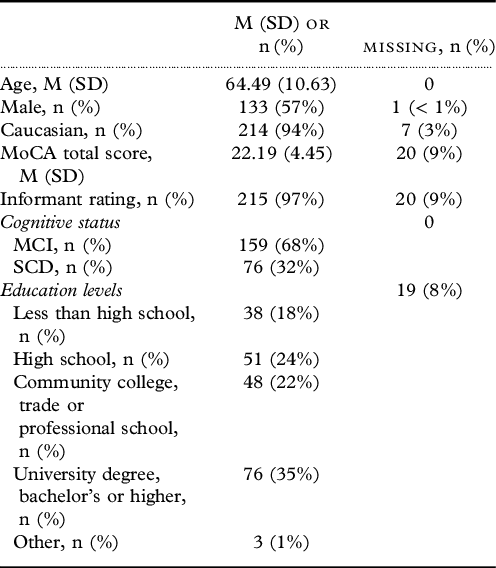
The initial sample size was 273, from which we excluded 38 participants with missing data on one or more items of the MBI-C impulse dyscontrol subscale. The final sample size was 235, comprising participants with MCI (n = 159) or SCD (n = 76) who had no missing data on the MBI-C. MCI was defined as objective evidence of cognitive impairment (test scores more than 1.0–1.5 SD below norms on the CERAD battery or MoCA less than 26) with essentially preserved activities of living, consistent with criteria proposed by the National Institute on Aging–Alzheimer’s Association workgroups (Albert et al., Reference Albert2011). Patients reporting cognitive symptoms but without MCI or dementia were defined as having SCD. Exclusion criteria for this retrospective analysis were a diagnosis of dementia, the presence of major psychiatric conditions (e.g. schizophrenia, bipolar disorder, and major depression). The study was approved by the ethics board of the University of Calgary, and all participants gave informed consent.
Measurement
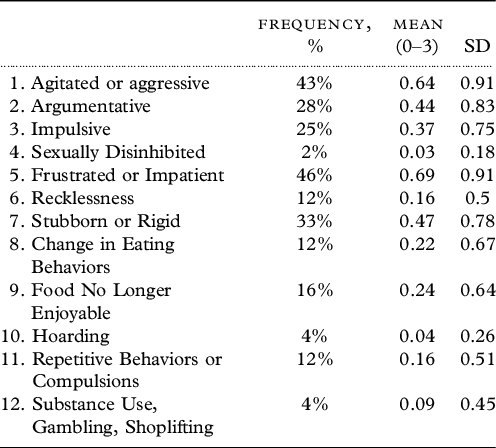
We used the 12-item impulse dyscontrol subscale of the MBI-C in this study (Table 1). The subscale is consistent with the ISTAART-AA MBI criteria, where impulse dyscontrol refers to a loss of “the ability to delay gratification and control behavior, impulses, oral intake, and/or changes in reward” (Ismail et al., Reference Ismail2016; Reference Ismail2017). The MBI-C can be rated by an informant, clinician, or the patient. In this study, nearly all were rated by an informant (Table 2). The MBI-C includes both a binary score (symptom later life emergent and present for at least 6 months or not) and a severity score (1–3; 1 = mild: noticeable, but not a significant change; 2 = moderate: significant, but not a dramatic change; 3 = severe: very marked or prominent, a dramatic change) per item. Here, we combined this information, so that a score of 0 indicates the symptom has not been present for at least 6 months and scores 1–3 correspond to the severity mentioned above. For descriptive purposes, we also present data on the MoCA (Nasreddine et al., Reference Nasreddine2005). Baseline data of study participants were used in the analyses.
Impulse dyscontrol symptom data

Clinical and demographic characteristics of the study participants

MCI = mild cognitive impairment, SCD = subjective cognitive decline, MoCA = Montreal Cognitive Assessment.
Statistical analyses
We used R version 3.5.3 for all analyses (R Core Team, 2019). The code for all analyses included in the manuscript and supplementary materials are available at osf.io/nt2xh/.
Network analyses
The core idea of network analysis is to depict conditional relationships between variables. Variables are technically called nodes, and the conditional relationships between them are called edges. An edge represents a unique relationship that can be interpreted as a partial correlation, e.g. a direct relationship that remains after the influence of other nodes in the network is adjusted for (Williams et al., Reference Williams2019). The width of the edge corresponds to the strength of the association.
The network structures were estimated as sparse Gaussian graphical models (GGM) with qgraph (Epskamp et al., Reference Epskamp2012). We chose Spearman’s rank correlation as our correlation method as the impulse dyscontrol symptom data were skewed (see, e.g. Burger et al., Reference Burger2020; Epskamp et al., Reference Epskamp, Borsboom and Fried2018a for discussion regarding the use of Spearman over polychoric correlations). The networks were regularized with the least absolute shrinkage and selection operator (LASSO; Tibshirani, Reference Tibshirani1996) that shrinks all edge weights toward zero, while also setting small edge weights to exactly zero. The trade-off between sensitivity and specificity of edge detection is adjusted with parameter γ, the optimal value of which remains debated, but may hinge on the expected strength of relationships in the data (Foygel and Drton, Reference Foygel and Drton2010; Fried et al., Reference Fried2019). Generally, higher values of γ correspond to a sparse network with few false discoveries, whereas a lower value finds more edges, some of which may be spurious. We estimated GGMs with both the default qgraph γ = .5, as well as a slightly more liberal .4. The justification for the latter is that the MBI-C impulse dyscontrol domain formulation is relatively novel and containing heterogenous symptoms whose intercorrelations have not been investigated previously, thus, by relying on just the default sparse estimate we might exclude weak but theoretically nontrivial edges.
We used a novel yet simple method of integrating the rate of positive answers (whether the symptom was present or not for at least 6 months) into the network as a visual aid. With this method, the rate of positive answers is matched to different hues on a color gradient, where extreme values of symptom positivity represent extreme values on the gradient. These colors, then, were used in graphical arguments for nodes. We used relative as opposed to absolute values due to restriction of range (Table 1). The potential benefit of this method is to observe descriptive data and network relationships in the same visual space (without having to look at Table 1 in this instance).
We also computed predictability with the mgm package (Haslbeck and Waldorp, Reference Haslbeck and Waldorp2016) of each node by the neighboring nodes, which can be interpreted akin to R2 (Haslbeck and Waldorp, Reference Haslbeck and Waldorp2018). To do this, the networks were re-estimated as mixed-graphical models. Predictability is visualized by the non-white ring around each node; no circle corresponds to the neighboring nodes being poor predictors of the target node, whereas a full circle would indicate the node being entirely predicted by the neighboring nodes.
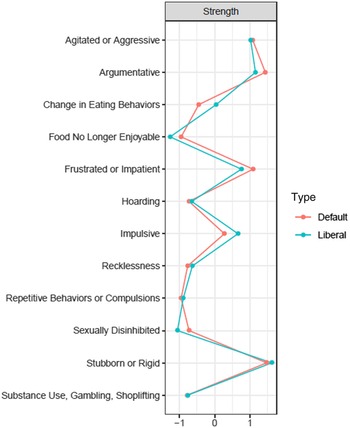
Next, we calculated strength as a centrality estimate for both the sparse and liberal networks. Strength is a sum of the connected edges to a node, giving a quantitative estimate of how many and how strong connections each node has. The strength estimates are standardized (z-scores), allowing comparisons between the two networks. We also used bootstrapping procedures in the bootnet (Epskamp et al., Reference Epskamp, Borsboom and Fried2018a; Reference Epskamp, Borsboom and Fried2018b) package to assess the robustness of the regularized networks.
Finally, acknowledging the recent literature on non-regularized symptom networks (Williams et al., Reference Williams2019; Williams and Rast, Reference Williams and Rast2019), we re-estimated the network without regularization in mgm (Haslbeck and Waldorp, Reference Haslbeck and Waldorp2016). This equals to setting γ to 0 (Foygel and Drton, Reference Foygel and Drton2010). The rationale for using non-regularized methods stems from the notion that regularized networks, such as ours relying on LASSO, excel in high-dimensional settings (e.g. the number of variables > n), whereas the opposite is true in most applied settings in psychological and biobehavioral sciences (e.g. n > the number of variables), our study not being an exception. However, the limitations of LASSO are more prominent in exceedingly large sample sizes (Williams et al., Reference Williams2019), alleviating concerns of using the method in our study. Thus, the non-regularized network is presented in the supplementary materials.
Results
Sample characteristics
Table 2 shows the clinical and demographic characteristics of the study patients. The patients were predominantly Caucasian and male, and had their impulse dyscontrol symptom data mostly rated by an informant (5 were self-rated, 1 rated by a clinician). The cognitive status of 68% of the participants was MCI, whereas the remaining 32% had SCD. A severity of individual impulse dyscontrol symptoms was generally low (range: 0.09–0.69).
Network analyses
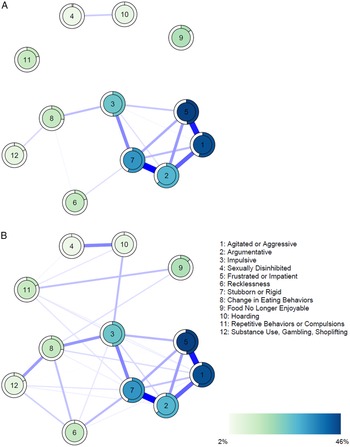
Figure 1 displays the networks with the sparse (γ = .5), as well as the slightly more liberal tuning parameter (γ = .4).
Impulse dyscontrol symptom networks, with sparse (A; γ = .5) and a slightly more liberal (B; γ = .4) configuration. Numbered nodes correspond to each symptom probed in the MBI-C impulse dyscontrol domain, and blue lines between them denote edges, or conditional relationships between nodes. Here all edges are positive. The circle around each node is the predictability estimate, or the degree to which neighboring nodes can predict a node (akin to R2). Colors of the nodes and circles are based on their frequency (Table 1), where the symptom with the lowest frequency is depicted as light green, and the highest frequency as dark blue, with the remaining nodes falling in between these two.

In the first network, we observed that the node “Food no longer enjoyable” and “Repetitive behaviors and compulsions” did not have any edges connecting to other nodes (Figure 1A). These nodes are connected in the second network, however, as well as in the mixed-graphical models underlying predictability estimates. We can also find that “Agitated or aggressive,” “Frustrated or impatient,” ‘Argumentative,” “Stubborn or rigid,” and “Impulsive” all are connected to one another. On the other hand, more unusual behaviors of changes in eating behaviors, hoarding, sexual disinhibition, trouble regulating substance use or gambling, and recklessness are relatively sparsely connected. Despite not having the strongest connections, the “Impulsive” symptom seems to bridge the otherwise unconnected constellations of frequent and rare symptoms.
The strength estimates indicate that “Stubborn or rigid” and “Argumentative” seem to be the two most central nodes (Figure 2). “Argumentative” also had the highest predictability (.64 and .65 in the networks). “Sexually disinhibited” and “Hoarding” were not predicted by their neighboring nodes. Altogether, the findings in Figures 1 and 2 could be interpreted as several of the argumentative-aggressive symptoms being widely connected to one another, whereas the other impulse dyscontrol symptoms, although classically recognized in the literature, occur less frequently and in relative isolation to other symptoms.
Standardizes strength estimates of individual nodes in the networks in Figure 1. Strength indicates the summary of edges each node has the nodes with the highest values have the most and/or strongest edges in the networks, demonstrating their centrality in the network. Low values indicate few and/or weak edges to other nodes.

Bootstrapping procedures indicate that there were some differences in the precision of the parameter estimates between the two network configurations. Notably, the strong correlation stability coefficient was .44 for the sparse network (Figure 1A), and .52 for the more liberal network (Figure 1B). Scores above .5 are recommended, but scores below .25 are considered concerning (Epskamp et al., Reference Epskamp, Borsboom and Fried2018a). Regarding specific edges, the edges “Argumentative”-“Stubborn or rigid” and “Agitated or aggressive”-“Frustrated or impatient” were stronger than most other edges in the networks.
The non-regularized network estimates more edges (33 edges out of a maximum 66 compared to 15 and 31 of the sparse and liberal networks, respectively), which should be interpreted cautiously (Supplemental Figure S9). Similar patterns to regularized networks, however, emerge.
Discussion
The aim of this study was to explore the network structure of impulse dyscontrol in participants with MCI or SCD. We found that the most frequent symptoms, related to hostile or otherwise interpersonally troubling impulsivity, formed a closely connected cluster of symptoms, whereas the less frequent but more specific symptoms were relatively unconnected. Being argumentative or stubborn/rigid were the most central symptoms in the network. Additionally, impulsivity was also important as it bridged some of the less frequent symptoms with the argumentative cluster in addition to being the fourth most central symptom.
The relative isolation of compulsive-repetitive symptoms as well as finding food no longer enjoyable may be related to several factors. For example, it has been suggested that repetitive symptoms in bvFTD may be isolated responses to internal or external stimuli rather than an attempt to relieve anxiety associated with compulsions (Moheb et al., Reference Moheb2019); thus, their relative isolation in the networks is not surprising. Cognitive mechanisms, such as a breakdown of response inhibition, have been considered an endophenotype bridging compulsive and impulsive symptoms (Dalley et al., Reference Dalley, Everitt and Robbins2011; Fineberg et al., Reference Fineberg2014). However, while compulsive features can manifest in disorders characterized by impulsivity and vice versa, the neural circuits underlying these behaviors are partially separable (Fineberg et al., Reference Fineberg2014). On the other hand, finding food no longer enjoyable can be related to other constructs as well, such as apathy (Hu et al., Reference Hu2019; Ismail et al., Reference Ismail2008).
Despite these and other conceptual challenges, neuropsychiatric symptom research often relies on summary scores of NPS measures as markers of psychopathology. While offering a convenient quantitative summary for the construct, summary scores can be a barrier for understanding psychopathology on a systematic level (Borsboom and Cramer, Reference Borsboom and Cramer2013; Fried and Nesse, Reference Fried and Nesse2015; Marin et al., Reference Marin, Firinciogullari and Biedrzycki1993; Strickland and Johnson, Reference Strickland and Johnson2020). For example, assessing both common and rare symptoms (e.g. Cummings et al., Reference Cummings1994; Griffiths et al., Reference Griffiths2019) as well as generalized and socially dependent impulsivity (Paholpak et al., Reference Paholpak2016) can be justified based on their clinical significance, but the relationships between these symptom constellations remain obscure in summary scores. Conversely, by examining the network structure of impulse dyscontrol, we can begin to formulate a more nuanced understanding of its systematic features.
Other modeling approaches, such as factor analysis, have been used to elucidate the structure of psychopathology in neurodegenerative disorders. However, despite statistical similarities, the clinical orientation differs between factor analytic models and networks (van Bork, Reference van Bork2019). NPS factors have been typically interpreted as subsyndromes with a common origin (e.g. Canevelli et al., Reference Canevelli2013), which, in the case of persons at risk for dementia, is often equivalent to neuropathological changes. However, the network interpretation of impulse dyscontrol might be more appropriate for this construct, specifically. A recent review including neural and psychometric evidence of impulsivity concluded that the construct captures highly diverging behaviors and thus, it is not surprising that robust neural associations are rare (Strickland and Johnson, Reference Strickland and Johnson2020). Our finding that the symptoms differ in their centrality suggests that there might be varying etiological factors involved, potentially related to different types of dementia or different effects of underlying neurodegenerative changes.
It seems plausible that the central symptoms in the network, such as aggressiveness and argumentativeness, may capture reinforcing aspects with a shared etiology. More rare symptoms, such as sexual disinhibition, need to be screened for their clinical significance, but they did not emerge as central symptoms in participants with SCD or MCI in this memory clinic sample. While our analyses need further corroboration, it may be expected that replicable biological correlates of impulse dyscontrol in at risk or prodromal states may be challenging to find (Strickland and Johnson, Reference Strickland and Johnson2020). Rather, constraining biomarker discovery to specific symptoms (Fried and Nesse, Reference Fried and Nesse2015), or to clusters of symptoms with the most clinical relevance might establish more robust correlations. This notion is also supported by a recent systematic review on biomarker associations of agitation and aggression in AD (Ruthirakuhan et al., Reference Ruthirakuhan2018), where marked heterogeneity was noted in operationalizing these constructs associated with impulsivity.
Based on our findings, the clinical picture of impulse dyscontrol in SCD and MCI is predominantly characterized by antisocial conduct with less emphasis on compulsive and generalized impulsive features. While related to e.g. frustration or agitation, impulsivity as such was less endorsed than these symptoms, signaling the differences. The finding that the associations to impulsiveness were not as strong as other edges in the network may be related to differential cognitive loadings of impulse dyscontrol symptoms. Impulsivity as such has been associated with cognitive mechanisms, such as response inhibition (Fineberg et al., Reference Fineberg2014), which, by definition, had to be relatively intact for SCD participants. Thus, as the expected prevalence of impulse dyscontrol symptoms may differ based on the combination of cognitive loading of individual symptoms and the level of cognitive decline of the person, impulse dyscontrol symptoms may have differential clinical utility in SCD and MCI. Less frequent symptoms, such as sexual disinhibition, were not central nodes in the network. These findings outline the challenges in operationalizing impulse dyscontrol as a unitary construct (Fineberg et al., Reference Fineberg2014; Moeller et al., Reference Moeller2001), and support the idea of dividing impulsivity into more granular subcomponents (Dalley et al., Reference Dalley, Everitt and Robbins2011; Paholpak et al., Reference Paholpak2016; Robbins et al., Reference Robbins2012).
Classification efforts in psychopathology research may offer some guidance in interpreting the broader aspects of our results. For example, the recent empirically based Hierarchical Taxonomy of Psychopathology (HiTOP; Krueger et al., Reference Krueger2018) model suggests that the broad higher-order spectra of antagonistic externalizing and disinhibited externalizing play a part in antisocial behavior, whereas only disinhibited externalizing is implicated in substance use disorders. These spectra are concordant with the symptom clusters found in a study of bvFTD and early-onset Alzheimer’s disease (Paholpak et al., Reference Paholpak2016). While not discounting the importance of rare but disturbing symptoms, the major relationships found in this study could arguably be characterized as persistent externalizing disturbances, more antagonistic than disinhibitive in nature.
Having laid the groundwork for the systematic study of impulse dyscontrol symptoms in a dementia context, the next step could be to enrich these models with neuropsychological and neuroimaging variables. Network models, like all models, need to question whether the variables included are sufficient and non-redundant in explaining the phenomenon of interest. For example, motor disinhibition is considered a part of both impulsivity and compulsivity (Robbins et al., Reference Robbins2012). Neuropsychological variables could bridge some of the gaps in the networks, whereas the inclusion of neuroimaging variables could point toward the neural associates of specific symptoms and the degree to which these are mediated by the included neuropsychological variables.
Strengths
Using MBI-C as the measure of impulse dyscontrol was a strength of this study. The MBI-C requires the symptoms to persist for at least 6 months, excluding many transient and reactionary states. The long reference range contrasts with traditional measures which allow for a brief presentation of symptoms, for instance over the last month. Using measures with short reference ranges could have contributed to the marked prevalence and severity of psychopathology even in normal cognitive aging as well as MCI (Choi et al., Reference Choi2000; Lyketsos et al., Reference Lyketsos2002).
Limitations
Our study could have established more precise estimates with a larger sample size. However, we had relatively few edges to estimate (a theoretical maximum of 66), and sample sizes of roughly 200 have been used in similar situations (e.g. Funkhouser et al., Reference Funkhouser2020). It is also worth noting that this is one of the largest clinical samples of MBI-C data. Nevertheless, small edges may be unstable at our reported sample size and should be interpreted cautiously (Schönbrodt and Perugini, Reference Schönbrodt and Perugini2013).
The overall symptom severity was relatively mild in our data and the symptom data may be biased owing to informant-reporting and cognitive heterogeneity of the sample. However, these properties reflect the challenges in real-world memory clinic referrals. Furthermore, the networks here are primarily statistical constructs, not theoretical. There are multiple relevant methods for modeling statistical associations between symptoms with a roughly equivalent fit, and the theoretical relevance cannot be deduced from statistical parameters (Fried, Reference Fried2020). However, as impulsivity tends to elude simple conceptualizations, network approaches were as appropriate as any for examining the symptom-to-symptom associations of this under-researched facet of psychopathology in SCD and MCI.
A strength correlation stability of the sparse network was slightly below the recommended cut-off, perhaps limiting the interpretation of the strength estimates in Figure 2. However, the second network fared better and yielded similar results as the first one. Indeed, the interpretation of this coefficient stems from simulation studies and should not be considered a “definite guideline” (Epskamp et al., Reference Epskamp, Borsboom and Fried2018a). Finally, we did not include concomitant medication in our network models, although drugs affecting the central nervous system could affect the symptoms analyzed in this study.
Future directions
Following the formidable number of exploratory network studies conducted in psychiatric domains, the generalizability and replicability of psychological networks have become a natural frontier for future studies (e.g. Fried et al., Reference Fried2018; Funkhouser et al., Reference Funkhouser2020). The generalizability of network structures across clinical and non-clinical domains has the potential to offer tentative mechanistic insights into psychopathology. This could also be a future avenue for impulse control difficulties that are present in many major psychiatric and neurological conditions, but also in non-clinical populations to a lesser extent. Extending impulse dyscontrol research to both individuals with a neurodegenerative disease as well as non-clinical populations could also help answer whether and how symptom networks differ in these groups. Enriching networks with cognitive and neuroimaging variables could help bridge the gaps between these literatures that on occasion seem to be studying overlapping phenomena with diverging terminology and methods.
Another future direction would be to analyze networks of impulse dyscontrol in MCI and SCD separately. A recent study showed that the Neuropsychiatric Inventory-Questionnaire domains associated with impulse dyscontrol – namely, agitation/aggressiveness, aberrant motor behavior, and appetite disturbances (Ismail et al., Reference Ismail2016) – were more prevalent in MCI than in SCD (Sannemann et al., Reference Sannemann2020). These discrepancies may be due to more substantial cognitive deficits in MCI and might even differ across MCI subgroups.
Conclusion
Impulse dyscontrol in at-risk states for dementia is characterized by closely connected symptoms of irritability, agitation, and rigidity with less emphasis on compulsive and generalized impulsive features. Our results contribute to the ongoing discussion regarding the nature of impulse dyscontrol and its relationships to neighboring constructs.
Conflicts of interest
None.
Description of authors’ roles
T. Saari was involved with the statistical design of the study, carrying out the analyses, and wrote the paper. Z. Ismail designed the study, wrote the paper, did clinical assessments for data collection, consented patients, and supervised all aspects of the study. E. E. Smith was involved in designing the study, writing the paper, did clinical assessments for data collection, consented patients, and supervised aspects of the study, along with supervising the PROMPT registry database.
Acknowledgments
The PROMPT registry is funded by the Katthy Taylor Chair in Vascular Dementia of the University of Calgary, with support from the Brain and Mental Health Research Clinics of the University of Calgary. TS was supported by grants from Finnish Cultural Foundation and the Finnish Brain Foundation.
Supplementary material
To view supplementary material for this article, please visit https://doi.org/10.1017/S1041610220004123