Introduction
ZnO nanoparticles (NPs) have attracted great attention because of their fascinating features and wide implementation. ZnO is one of the most significant n-type semiconductor materials with a direct band gap of 3.37 eV and a large exciton binding energy nearing 60 MeV which creates a rational excitonic emission value.[Reference Pimentel, Fortunato, Gonçalves, Marques, Águas, Pereira, Ferreira and Martins1, Reference Pearson, Norton, Ip, Heo and Steiner2] ZnO is one of several metal oxide semiconductors which can be utilized in a wide range of technological applications such as solar cells, light emitting diodes, photoelectronic devices, and laser diodes. On the other hand, ZnO has the most varied physical properties and nano grain morphologies among all semiconductors. In the preparation of ZnO-NPs, it has been synthesized by different methods such as chemical vapor deposition (in gaseous media),[Reference An, Ahn and Park3] pulsed laser deposition,[Reference Vakulov, Zamburg, Khakhulin and Ageev4] ultrasonic spray pyrolysis, magnetron sputtering, sol–gel method (in liquid media, chemical method), [Reference Ynineb, Attaf, Aida, Bougdira, Bouznit and Rinnert5, Reference Liau and Huang6] molecular beam epitaxy and the combustion method (in solid media).[Reference Toporkov, Ullah, Demchenko, Avrutin, Morkoç and Özgür7] Most of these techniques presented in the literature are very costly. They also require the use of hazardous and toxic contents, such as stabilizers, which may create a potential ecological problem and pose health risks. Eco-friendly artificial approaches have become important in recent years. The synthesis of such materials by fabricating biocompatible reagents in an eco-friendly way may help to reduce the need for toxic components used in conventional methods. For this purpose, closed reactors, non-toxic solvents such as water, “green” methods without the need for contacting reaction media and air (ultrasound, microwave, hydrothermal, magnetic, and biologic methods, among others), and low temperatures can be used. The advantages of the green synthesis of NPs are its simplicity, cost-effectiveness, reproducibility, and results in stable materials. Overall, biologic materials offer an environmentally friendly method to produce such materials.[Reference Suresh, Nethravathi, Udayabhanu, Pavan Kumar, Raja Naika, Nagabhushana and Sharma8, Reference Wang, Xu and Yang9] Nanosized ZnO can be produced by green synthesis technique. The ZnO-NPs have average size of about, 35, 40, 42–85, and 30–180 nm using natural Citrus aurantifolia (lemon) peel, Aesculus hippocastanum, thyme (Thymus vulgaris), and Punica granatum shell extracts, respectively.[Reference Çolak and Karaköse10–Reference Karaköse, Çolak and Duman13] Mentha (Mentha spicata) is a natural herbaceous plant found in the Mediterranean region of Europe, North America, and North Africa and has a wide history of conventional use in medicine. For centuries, the flowers and leaves of this herb have been used to cure diseases. M. spicata is also used as a fragrance and flavoring agent and food and drinks. It is commonly utilized in the food industry because of its antioxidant, antimicrobial, and sensory properties.[Reference Singh, Shushni and Belkheir14] Mentha is an herbaceous plant that is commercially grown in Turkey. Mentha contains volatile components, quinines, organic acids (cinnamic acid, caffeic acid, and depside rosmarinic acid), and flavonoids.[Reference Tsai, Wu, Lin, Lin, Huang and Yang15] Recent studies have demonstrated the antibacterial and antifungal activities of Mentha extract on selected bacteria and fungi.[Reference Singh, Shushni and Belkheir14, Reference Sroka, Fecka and Cisowski16] To the best of our knowledge, there has been no previous work on the synthesis and physical properties of ZnO nanorods by using plant extract. In this study, we are the first to report the eco-friendly green synthesis of ZnO nanorods by using aqueous Mentha extract. The morphological, electrical, optical, and antimicrobial activity properties of obtained aqueous Mentha extract ZnO-NPs were characterized. In order to compare the morphological, electrical, optical and antimicrobial activity properties, ZnO-NPs were produced using a Zn(Ac)2.2H2O solution in distilled water (dH2O), and the properties were also studied.
Experimental procedure
Materials
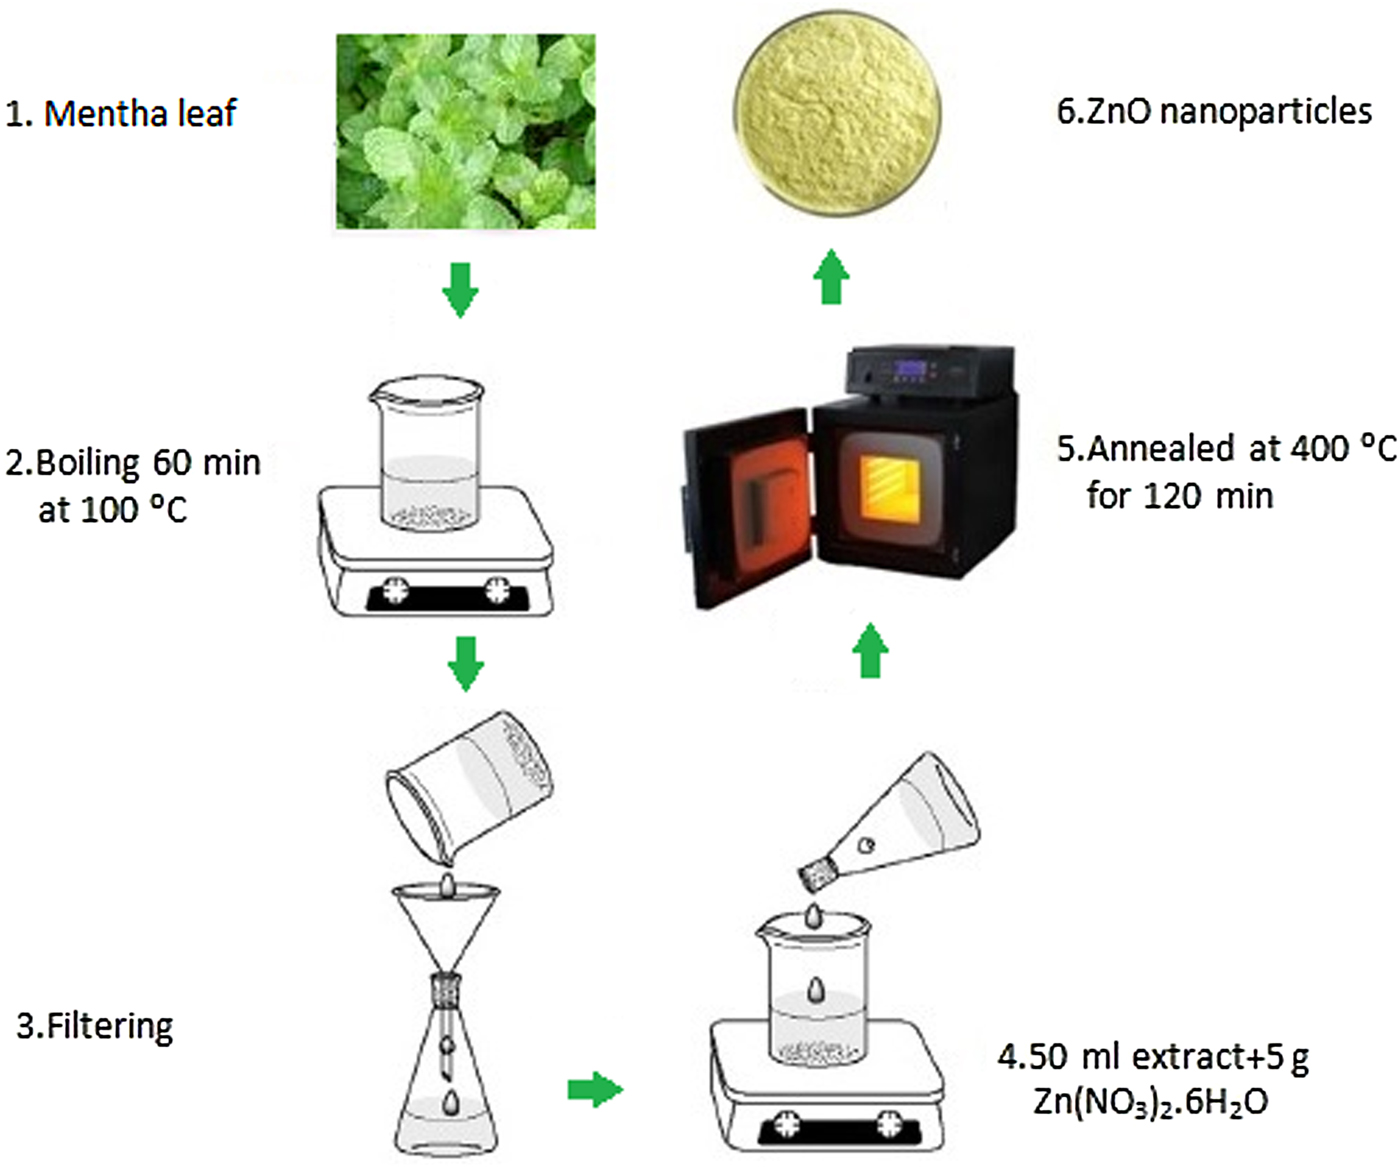
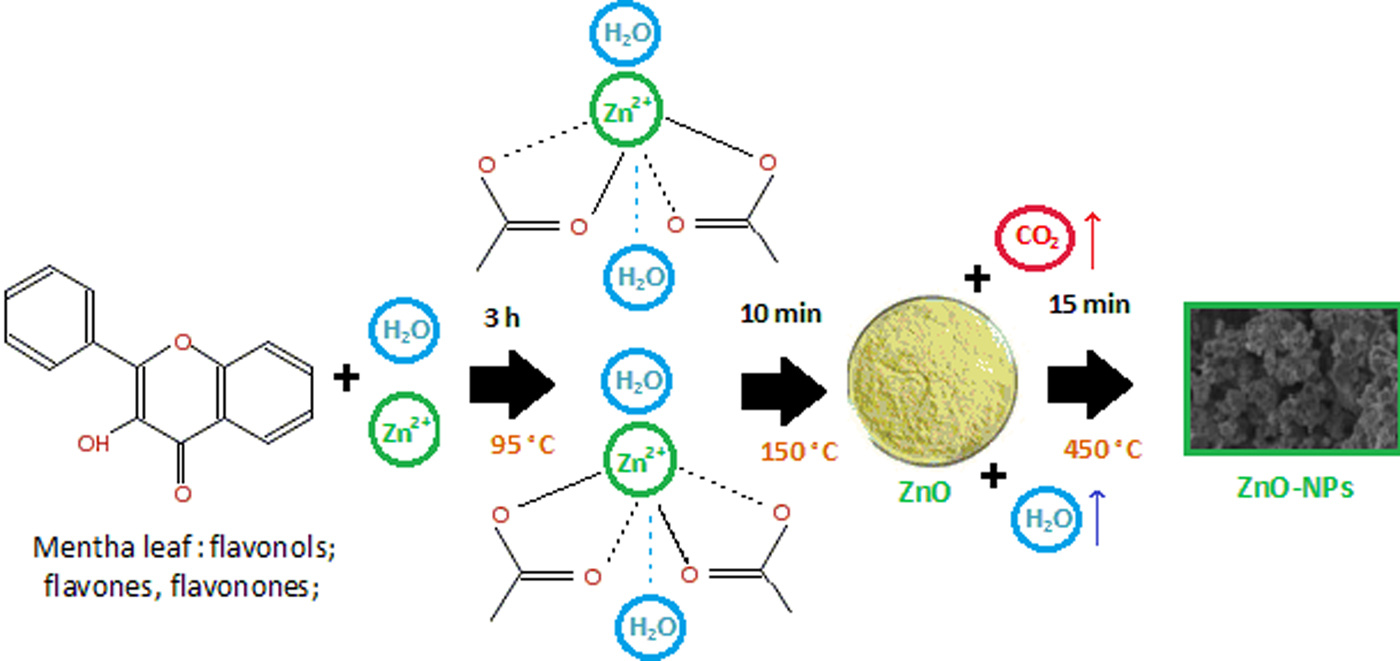
The Mentha (M. spicata) was bought from a greengrocer in Çankırı/Turkey. We used double distilled water (dd H2O) in all experiments. Zinc acetate dehydrate Zn(Ac)2.2H2O (Alfa-Aesar, Germany) was used as the source of Zn. For analysis and comparison purposes, we produced two ZnO nanostructured materials. The first ZnO-NPs were produced using a Zn(Ac)2.2H2O solution in aqueous Mentha extract and the second ZnO-NPs were produced using a Zn(Ac)2.2H2O solution in dH2O. The Mentha leaves were washed 7–8 times in flowing water and with dH2O and were then rinsed. Dry leaves (20 g) were put into 100 mL of dH2O which was boiled for 60 min at 100 °C. After this procedure, the extract was cooled to 25° C. The resultant solution was filtered using Whatman No. 1 filter paper. The color of the extract was light yellow, and was stored in a refrigerator at 3 °C for later experiments. This extract was named GS. The preparation of ZnO-NPs is shown in Fig. 1. For comparison purposes, 5 g of Zn(Ac)2.2H2O was dissolved in 50 mL dH2O, and then each step described above was repeated using this solution. This extract was named as NS. The ZnO-NPs were examined morphologically, optically and electrically by x-ray diffraction (XRD) (RİGAKU—Ultima IV), Field-emission Scanning Electron Microscope (FE-SEM; Zeiss Ultra Plus Gemini), the four probe dc system and UV–Vis spectrophotometer (Rayleigh UV-2601). For UV–Vis optical transmittance spectra measurements, the powder samples were dissolved in dd H2O (0.01 g powders in 50 mL dd H2O) and suspensions were mixed in an ultrasonic bath for 20 min and all the samples became transparent for UV/Vis spectrophotometer.[Reference Çolak and Türkoğlu17] Its antimicrobial activity was investigated using Bacillus thuringiensis gram-positive bacteria. The suspension of B. thuringiensis gram-positive microorganism was multiplied in nutrient broth environment. B. thuringiensis gram-positive bacterium was distributed on the agar plate surface. Disk agar cultures were swabbed and placed in by an aseptic L-shaped glass tube with 200 mL of 24 h grown meat broth culture of the gram-positive bacteria family. 25, 50, and 100 µg/mL samples were loaded with 20 µL suspended in deionized (DI) H2O. Bacterial containers were held at 36° C for 48 h.
Sample preparation process of ZnO-NPs.

3. Results and discussion
3.1 XRD and structural study
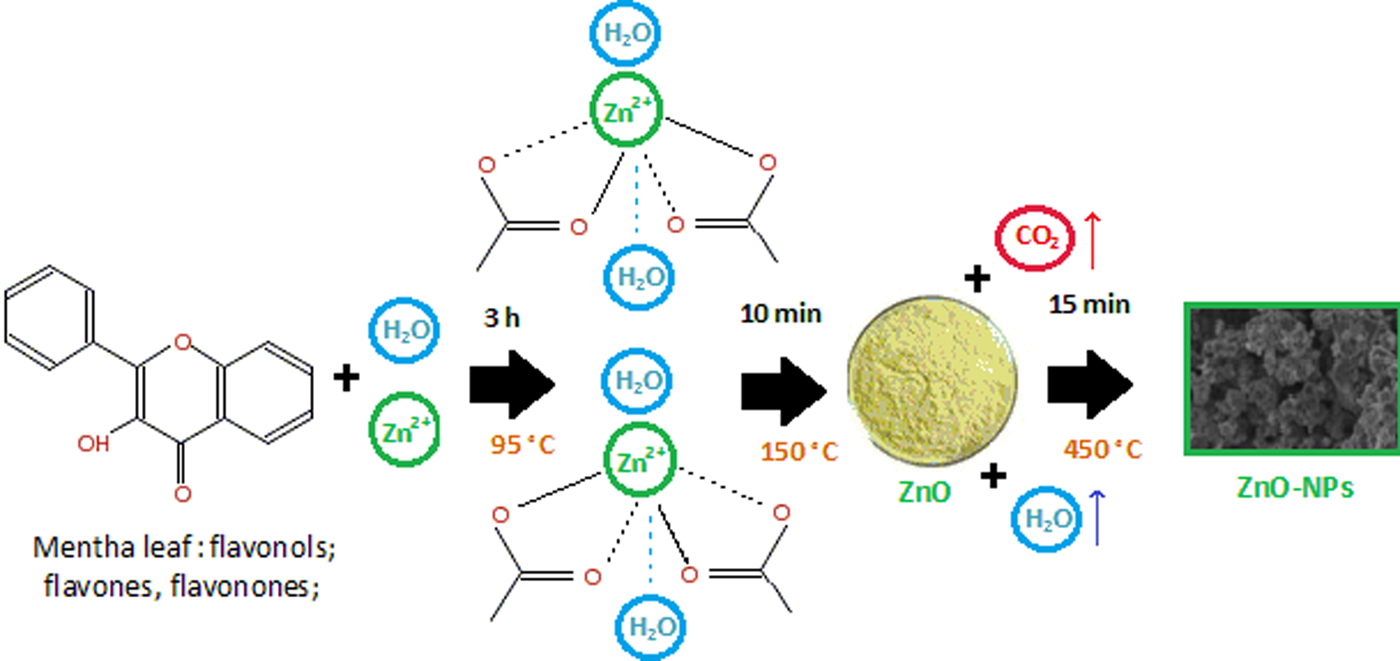
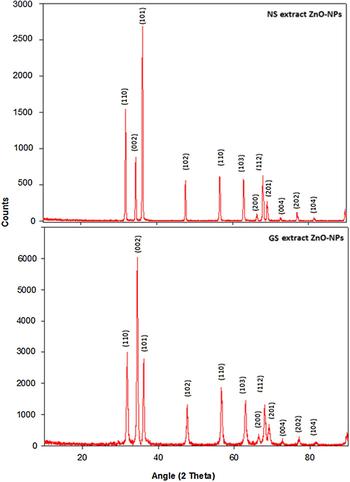
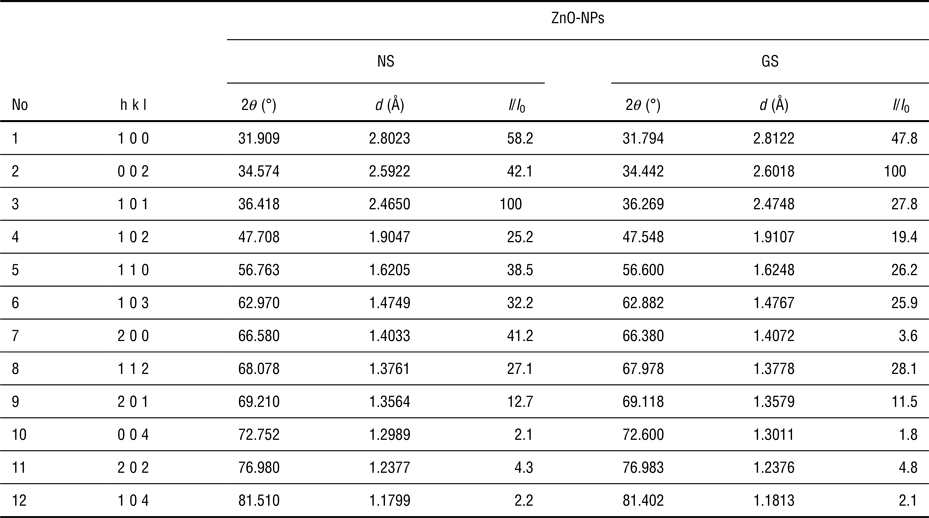
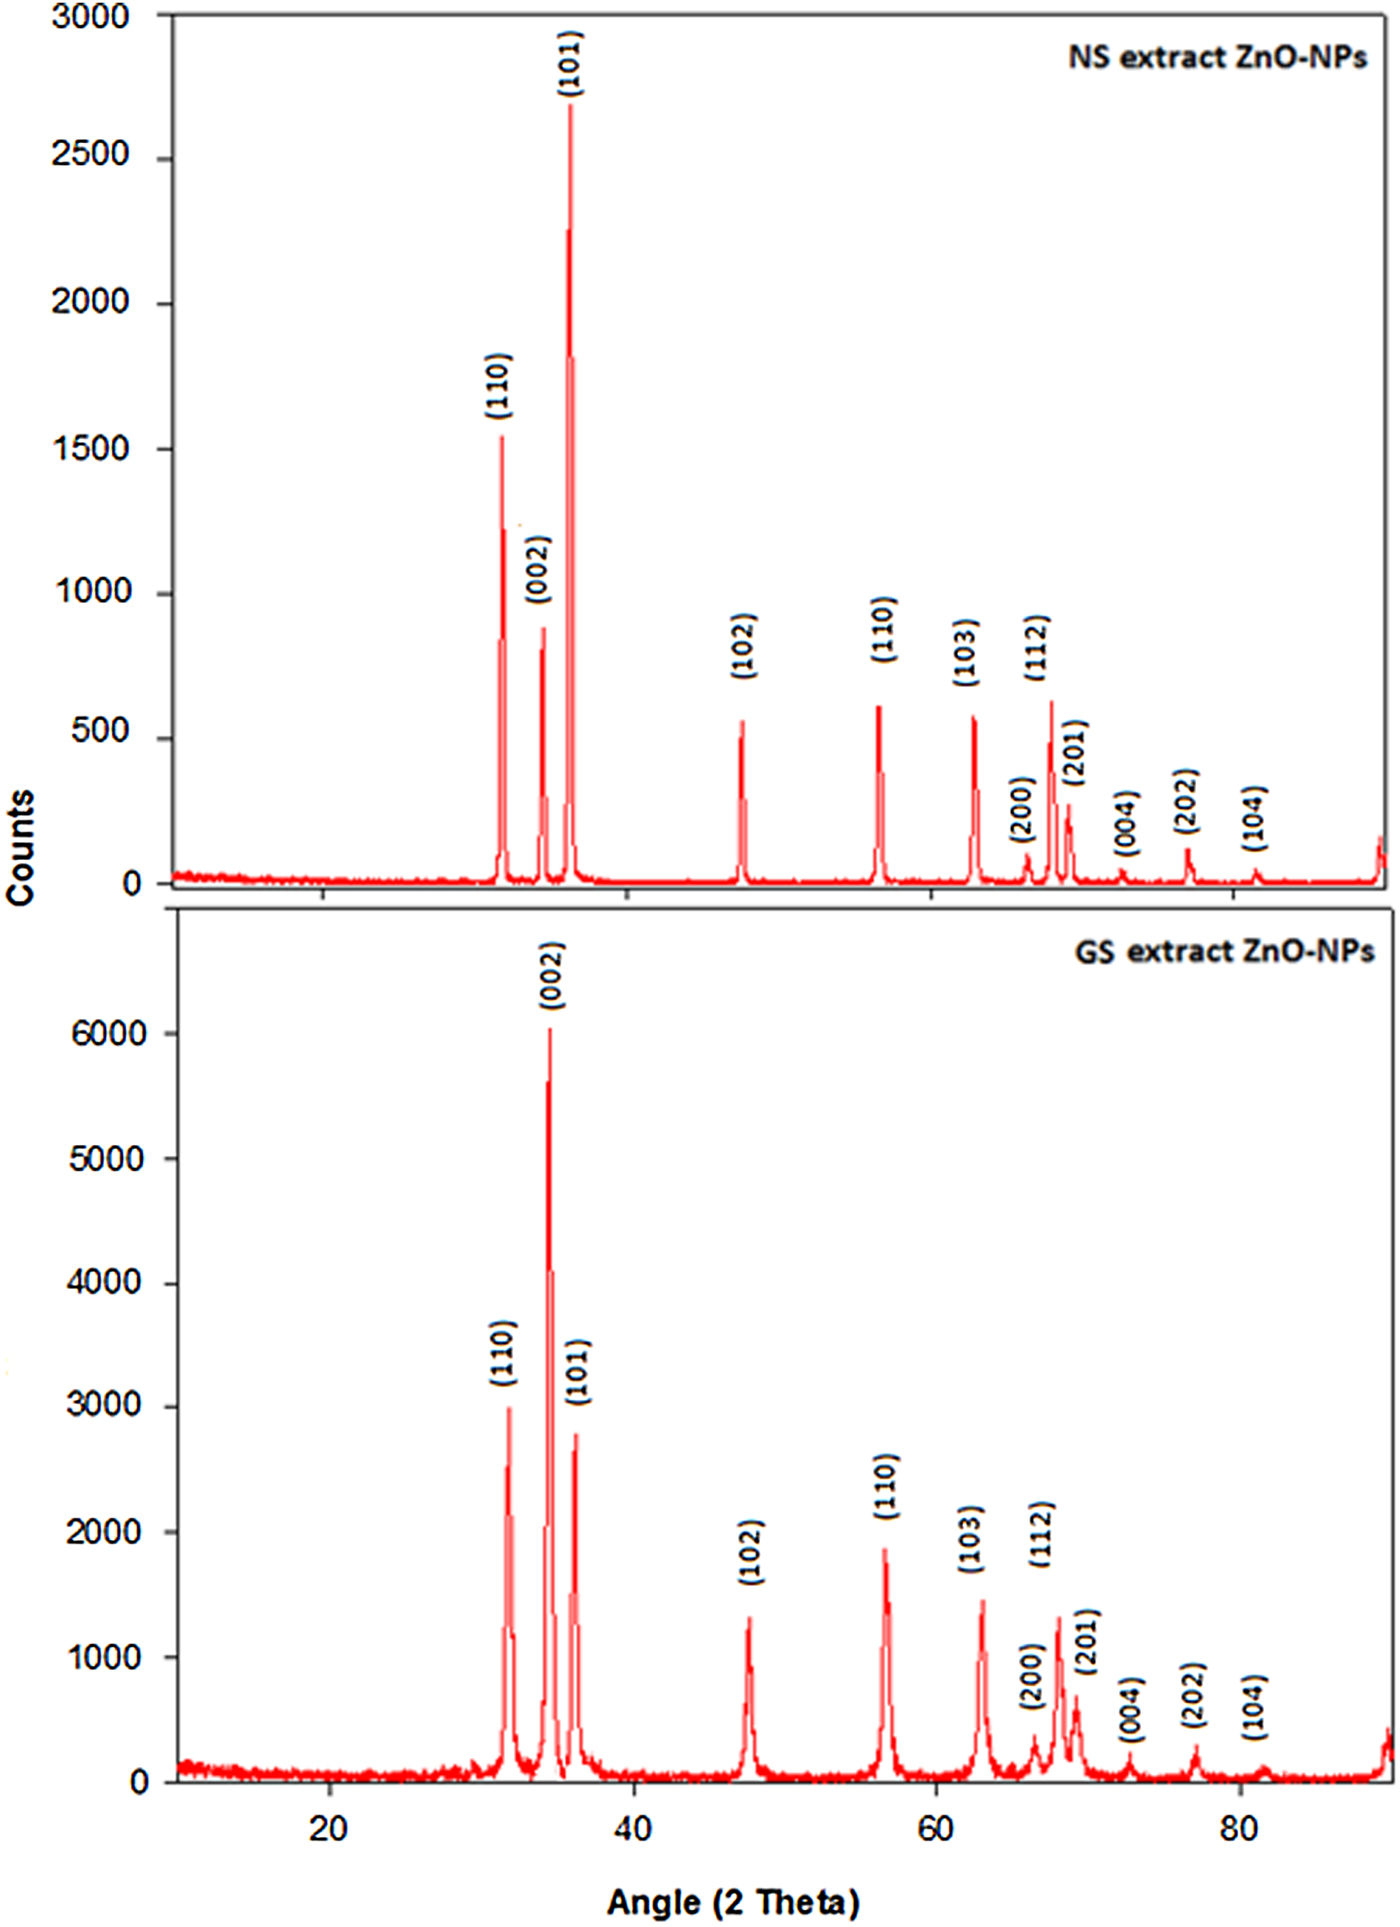
Figure 2 shows the possible reaction mechanism for the production of ZnO-NPs using aqueous Mentha extract. The volatile components including quinines, cinnamic acid, caffeic acid, rosmarinic acid, and flavonoid molecules can undergo nucleation with Zn2+ to become zinc-cinnamic acid, zinc-caffeic acid, zinc- rosmarinic acid, and zinc-flavonoid complex molecules. After the solution was dried and annealed, the complex molecules were transformed into ZnO-NPs.[Reference Kumar, Smita, Cumbal and Debut18] However, the predicted reaction mechanism is still uncertain and needs further examination. During the reaction process, non-toxic aqueous vapor H2O(g) and CO2(g) gases were released. For this reason, this ZnO-NPs synthesis process is environmentally friendly. Figure 3 illustrates the XRD analysis results obtained from the GS and NS samples. The diffraction peaks of hexagonal ZnO are found as 2θ values at angles such as 31.90°, 34.57°, 36.41°, 47.70°, 56.76°, 62.97°, 66.58°, 68.07°, 69.21°, 72.75°, 76.98°, and 81.51° corresponding to the lattice planes of (1 0 0) (0 0 2), (1 0 1), (1 0 2), (1 1 0), (1 0 3), (2 0 0), (1 1 2), (2 0 1), (0 0 4), (2 0 2), and (1 0 4), respectively. No extra peaks are observed in any of the diffraction patterns. It was indicated that the GS and NS samples were polycrystalline in nature and were indexed as having a hexagonal (wurtzite) structure (PDF Card No: 2300113). These results were well supported by the XRD pattern of ZnO-NPs reported earlier.[Reference Vijayakumar, Vaseeharan, Malaikozhundan and Shobiya19, Reference Salam, Sivaraj and Venckatesh20] The GS sample shows that the intensity of the (002) peak is increased, which reveals that one of the orientations prefers to grow along the c-axis during crystallization. This has been reported in previous works.[Reference Vakulov, Zamburg, Khakhulin and Ageev4, Reference Ynineb, Attaf, Aida, Bougdira, Bouznit and Rinnert5] The structural analysis obtained by XRD investigations clearly showed the existence of ZnO nanorods in the GS sample, which is in complete agreement with the FE-SEM results. The lattice parameter d, I/I 0 ratio, and 2θ (angle of diffraction) in the phases determined throughout with the Miller index of the ZnO-NPs specimen are given in Table 1. The lattice constant a parameters are 3.2215 and 3.2254 Å and the c parameters are 5.1822 and 5.1932 Å for the GS and NS, respectively. The XRD results illustrate very good crystalline quality with very well defined and intense peaks. The average crystallite size of the GS and NS ZnO-NPs samples was estimated by the Debye−Scherrer equation that is shown below:
 $$D = \displaystyle{{K\lambda} \over {\beta {\rm Cos}\theta}}.$$
A possible reaction mechanism for the production of ZnO-NPs.
The XRD patterns of NS and GS samples.
I/I 0, d, and 2θ values of the GS and NS ZnO-NPs samples.

Here, D is the average crystallite size, K is the constant and about 0.9, λ is the wavelength of the x-rays used, Cu Kα is 1.542 Å, β is the line broadening at full-width at half-maximum (FWHM) intensity and θ is the Bragg diffraction angle at peak position. The average crystallite sizes of the GS and NS ZnO-NPs samples were calculated as 50 and 60 nm respectively, which was very close to that of the ZnO-NPs synthesized from the leaf extract of Laurus nobilis, Ocimum basilicum.[Reference Sroka, Fecka and Cisowski16, Reference Salam, Sivaraj and Venckatesh20] The GS sample has a smaller grain size than the NS sample. It can be seen that the reduction in crystallite size causes a decrease in the lattice constant “a” and unit-cell volume V. We can determine that smaller sized NPs can be produced using the eco-friendly technique, and ZnO-NPs can be produced via green synthesis technique using aqueous Mentha extract.
The stress values of the GS and NS ZnO-NPs were estimated using the formula given below:[Reference Gao and Cranston21]
 $$\sigma = - 233\displaystyle{{c - c_0} \over {c_0}}. $$
Here, c 0 is the constant lattice parameter of the non-stress value of ZnO, c 0 = 0.5205 nm and c is the lattice parameter of the GS and NS specimens. The calculated stress values are −3.14 and −4.02 for the GS and NS, respectively. As expected, the stress values of the GS sample are higher than those of the NS sample, because the increase in the stress values is clearly linked to the decreasing particle sizes of the ZnO-NPs during the green synthesis process.
3.2 FE-SEM and morphological study
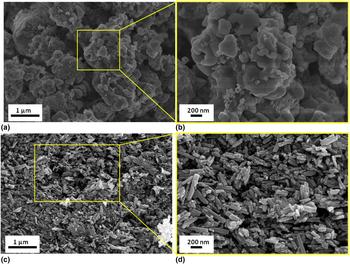
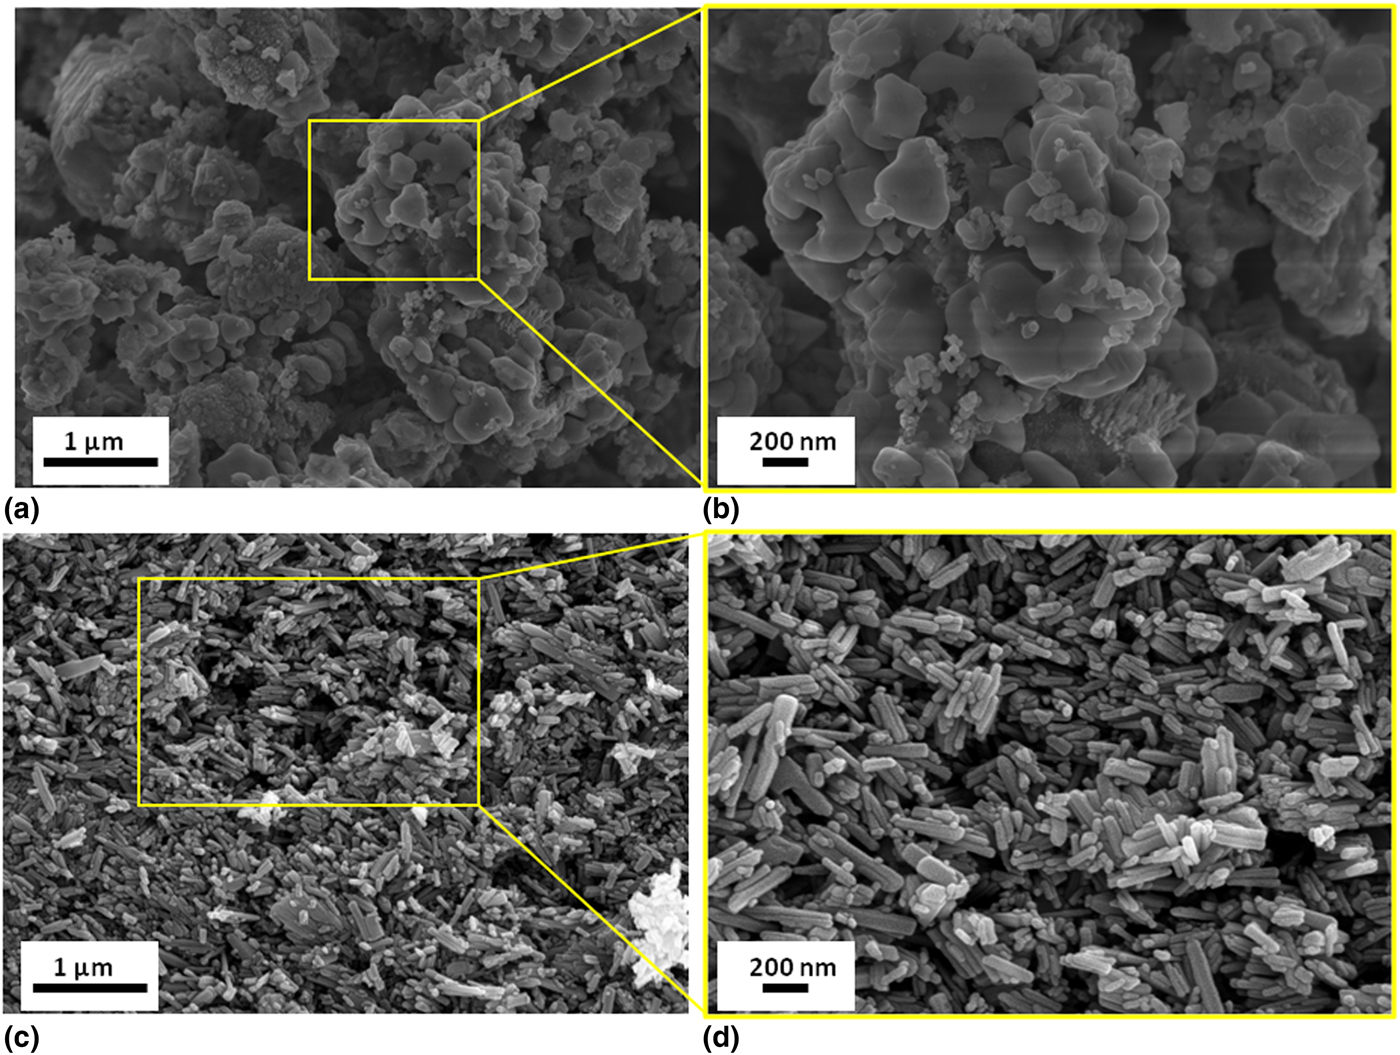
It is very important to determine the structural properties of the ZnO-NPs sample for practical applications. The FE-SEM images were taken at different magnifications and are given in Fig. 4. Figures 4(a) and 4(b) illustrates the FE-SEM images of the NS synthesized ZnO-NPs. These images show individual ZnO-NPs besides a number of aggregates. They demonstrate that the grains of the NPs are granular and circular shaped in nature.[Reference Suresh, Nethravathi, Udayabhanu, Pavan Kumar, Raja Naika, Nagabhushana and Sharma8, Reference Selvarajan and Mohanasrinivasan22] Moreover, the aggregation of ZnO-NPs was found in ZnO powder materials.[Reference Jayaseelan, Abdul Rahuman, Vishnu Kirthi, Marimuthu, Santhoshkumar, Bagavan, Gaurav, Karthik and Bhaskara Rao23] On the other hand, Figs. 4(c) and 4(d) illustrates the FE-SEM image of the GS synthesized ZnO-NPs. The photographs display the formation of a partly regular morphology in the ZnO-NPs. The number of the particles is approximately in the range 3000–10,000. The higher magnification perspective is able to illustrate nanorod-shaped NPs [as seen in Fig. 4(d)]. The average ranges of nanorod sizes are between 80 and 100 nm. These FE-SEM images show for the first time the possibility of synthesizing nanorod-shaped ZnO-NPs by a green synthesis process.
FE-SEM images of ZnO-NPs: (a) NS, (b) enlarged NS, and (c) GS, (d) enlarged GS samples.
3.3 Electrical properties
Another aim of this study is to explain the connection between electrical conductivity and the applied temperature. The temperature dependence of the electrical conductivity for GS and NS ZnO-NPs samples was measured by the standard d.c. four-point probe method. For this study, we used the following equation:
 $$\sigma = \displaystyle{I \over V}G^{ - 1} $$
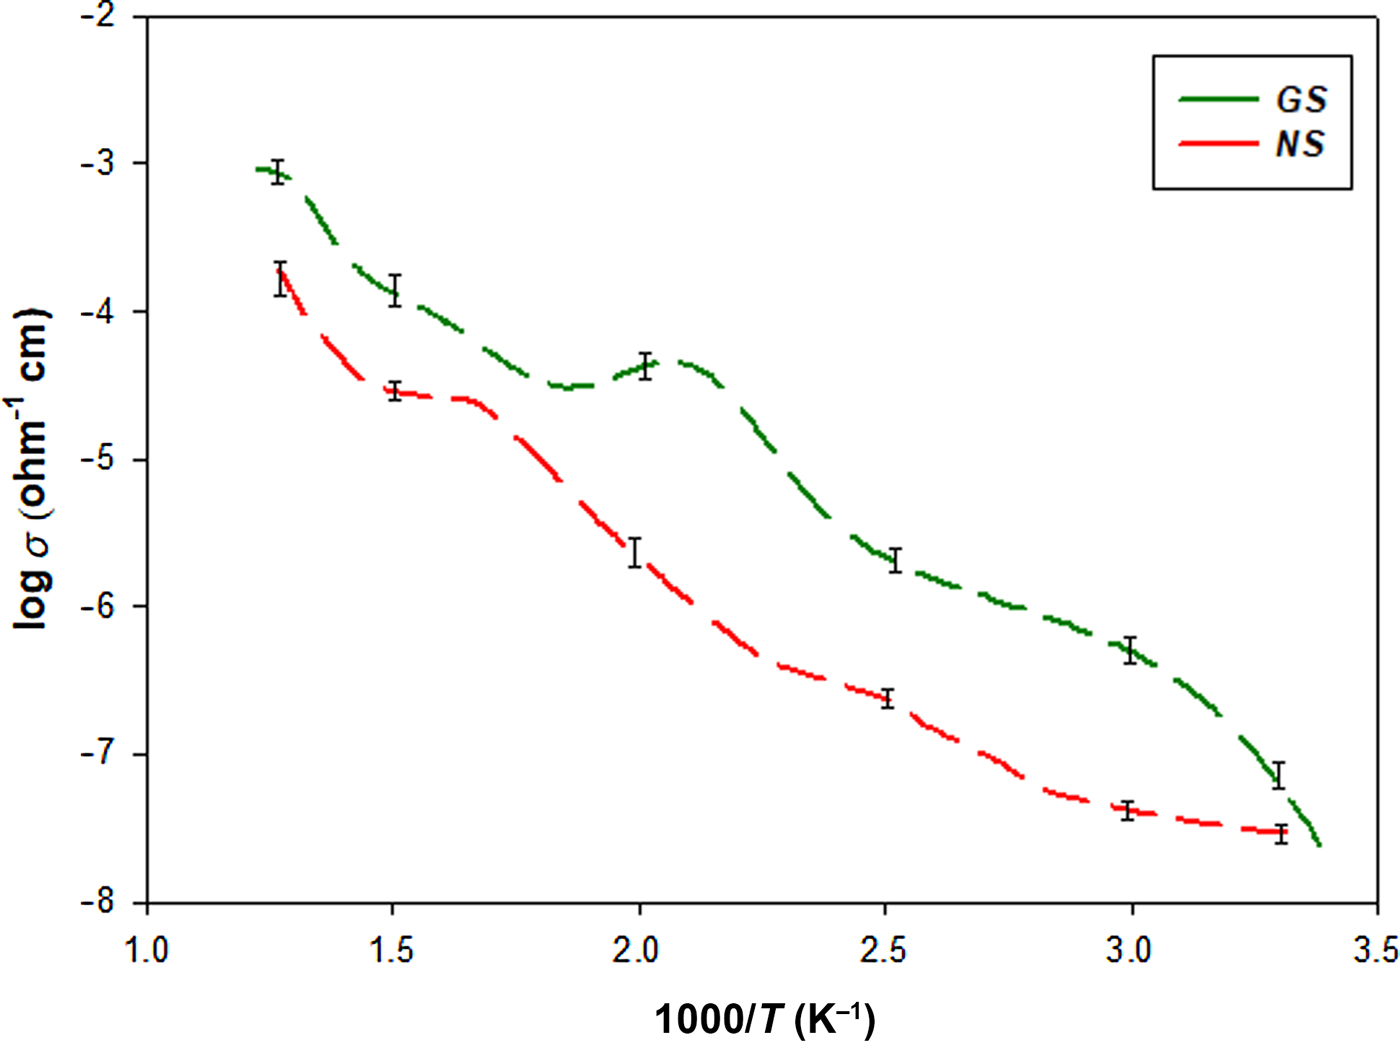
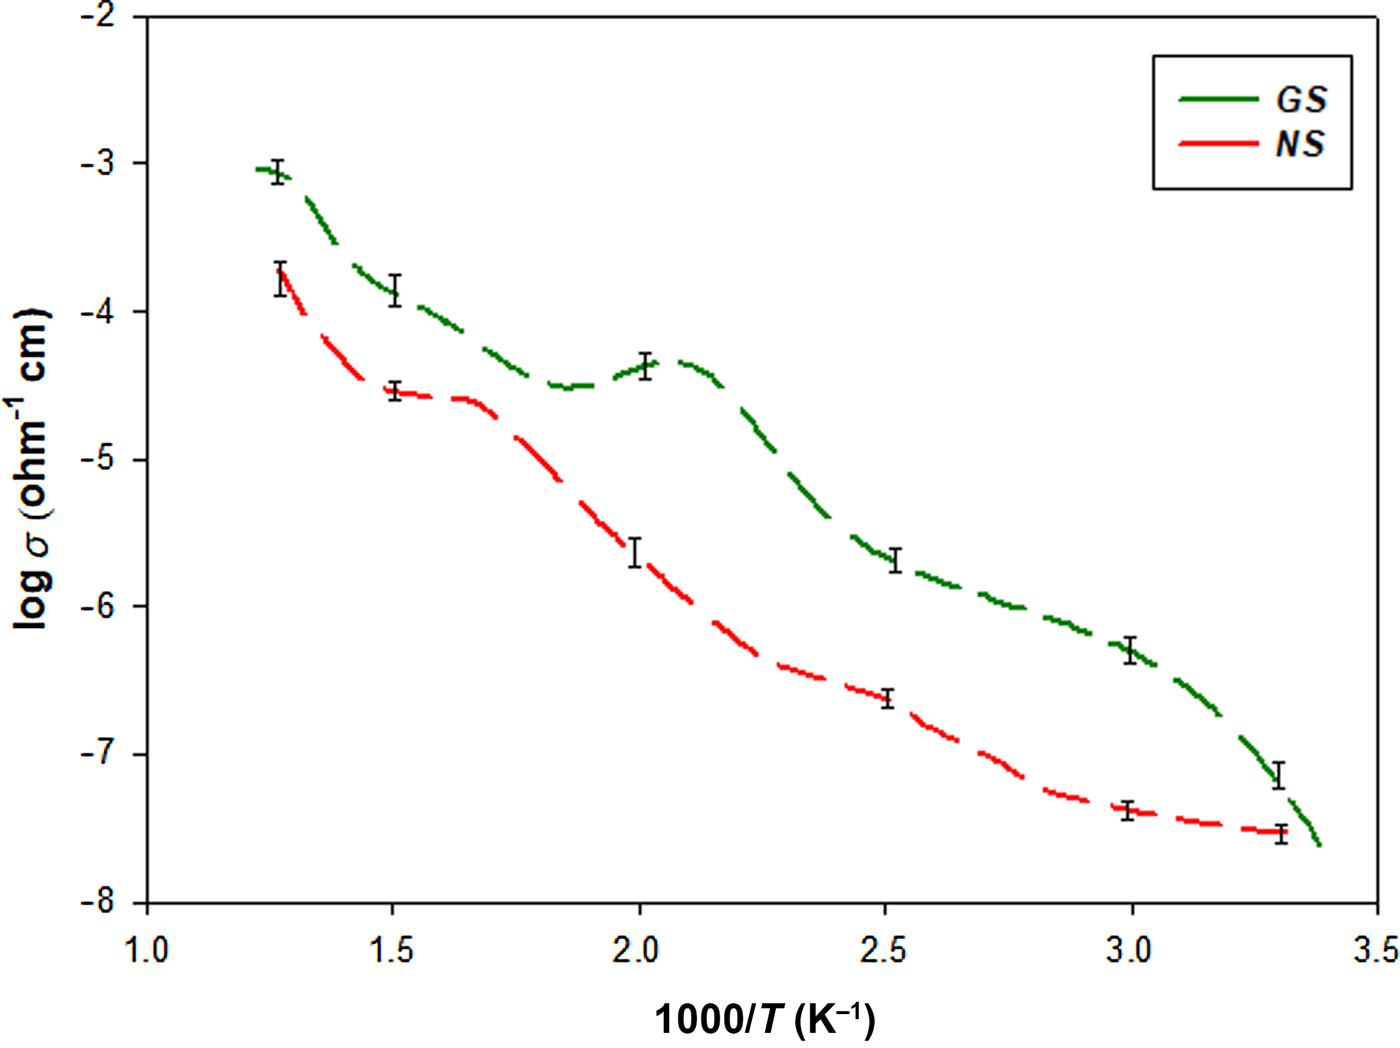
where G is the geometric correction constant, I is the direct current, and V is the voltage drop.[Reference Hassan, Khan, Azam and Naqvi24] The electrical conductivity values (σ) of the GS and NS ZnO-NPs were measured in the temperature range of 25 and 550 °C, and the data are plotted in Fig. 5. These values are given in Table 2. The figure and table clearly demonstrate that the GS ZnO-NPs have better electrical conductivity values compared with the NS ZnO-NPs samples. According to the XRD peaks, the low FWHM (the line width at half-maximum height) values of diffraction patterns illustrate a good crystal arrangement. Thus, the morphology produced fine electrical conducting features.[Reference Hassan, Khan, Azam and Naqvi24, Reference Ajimsha, Das, Singh, Misra and Kukreja25] For this reason, we think that the electrical conductivity characteristics of ZnO-NPs are mainly connected to the change in the particle size of the crystals. The electrical conductivity values closely depend on the applied test temperature. The electrical conductivity values of the GS and NS ZnO-NPs were increased with increasing test temperature. The temperature dependence of the electrical conductivity provides useful information about the possible changes in the morphology of the sample structure.[Reference Yilmaz, Turkoglu and Belenli26] ZnO is a nonstoichiometric n-type semiconductor owing to the native donor defects such as Zn interstitial atoms. The native defects which occur at high temperatures control the electrical conductivity of ZnO.[Reference Lee, Le, Seo and Park27] Generally, for n or p-type semiconductor materials, the electrical conductivity values increase parabolically in accordance with the temperature. This situation displays a thermally activated phenomenon for this reason; fully electrical conductivity can be written as
 $$\sigma = \sigma _0 \exp ( - E_a /kT)$$
σ is the electrical conductivity, σ 0 is the electrical conductivity at an applied temperature (T), E a is the activation energy, and k is the Boltzmann constant.[Reference Sawalha, Abu-Abdeen and Sedky28] The activation energy of the GS and NS patterns is given by the following Eq. (5):
 $$\log \sigma = - \displaystyle{{E_a} \over k}\displaystyle{1 \over T} + \log \sigma _0. $$
Electrical conductivity graphs for the ZnO-NPs samples.
Electrical conductivity values of the GS and NS ZnO-NPs samples.

The Arrhenius values calculated that the gradient of the linear part of the logσ-103/T is equal to −E a/k. The GS and NS ZnO-NPs have Arrhenius-type conductivity behavior for the test temperature range. The activation energy values of the GS and NS ZnO-NPs samples were 0.278 ± 0.02 and 0.314 ± 0.05 eV in the 25–350° C test temperature range, respectively. In addition, the calculated activation energy values are lower than that of molybdenum-doped ZnO samples.[Reference Larbi, Ouni, Boukachem, Boubaker and Amlouk29] It is seen that the activation energy values of the GS ZnO-NPs are lower than those of the NS ZnO-NPs. The rise of the activation energy values with the NS ZnO-NPs illustrated that these ions create deep energy traps in the valence or conduction band of ZnO and movement as acceptors which results in the decrease of the Fermi level. Also, the internal defects caused by thermal instabilities increased the electrical conductivity properties of the GS and NS ZnO-NPs at increased test temperatures.[Reference Demirselcuk and Bilgin30–Reference Patil, Dighavkar, Sonawane, Patil and Borse32]
3.4. Optical properties
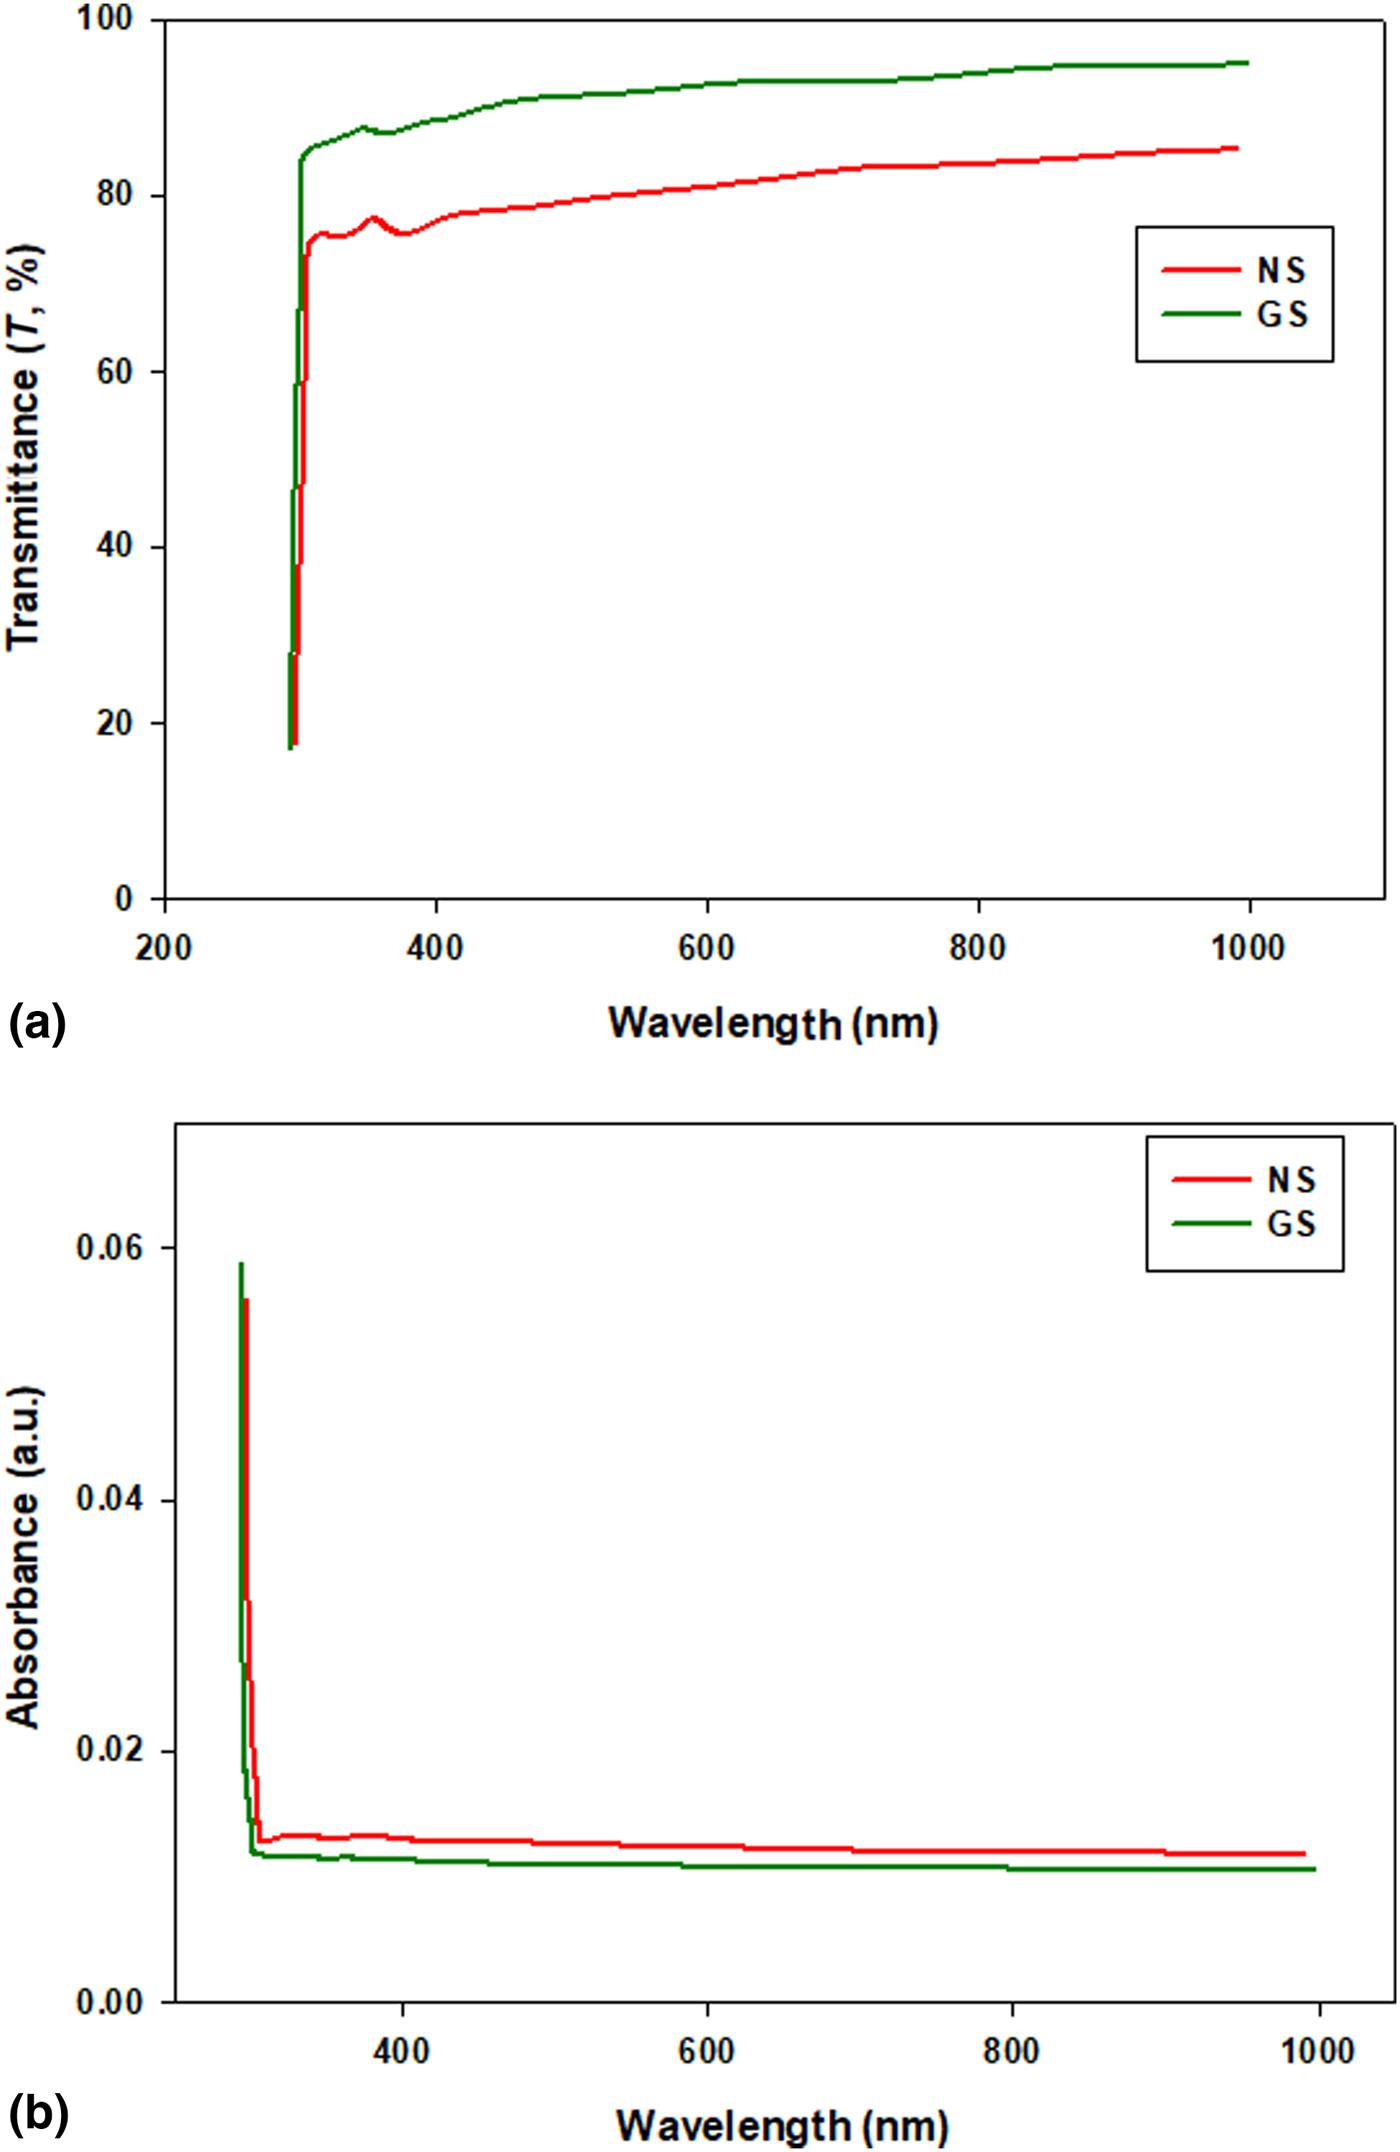
Figure 6 shows the optical transmittance and absorbance spectra of the GS and NS ZnO-NPs measured at room temperature. The transmittance of the GS and NS ZnO-NPs patterns were over 90% and 82%, respectively. These data mean that the optical transparency was elevated in the visible to near-infrared areas, which is typical for the properties of semiconductor materials. Figures 6(a) and 6(b) illustrates that GS ZnO-NPs have better optical transmittance properties than the NS ZnO-NPs samples, which is related to the good structural homogeneity and crystallinity of the sample morphologies. Also, these high optical transparency values show the good optical quality of the GS and NS ZnO-NPs. On the other hand, the reduction in optical transmittance in the NS ZnO-NPs sample may be due to the rise of photon scattering due to crystal defects.[Reference Hong, Park, Park and Chang33] In addition to the increase in the charge carrier concentrations and similar results have also been reported elsewhere.[Reference An, Ahn and Park3–Reference Toporkov, Ullah, Demchenko, Avrutin, Morkoç and Özgür7]
Optical (a) transmittance, (b) absorbance graphs for the ZnO-NPs samples.

The optical band gap (E g) was found to have a direct transition between the conduction and valence bands, for which the variation in the absorption coefficient with the photon energy hν can be demonstrated by
 $$a(hv) = A(hv - E_{\rm g} )^{1/2}. $$
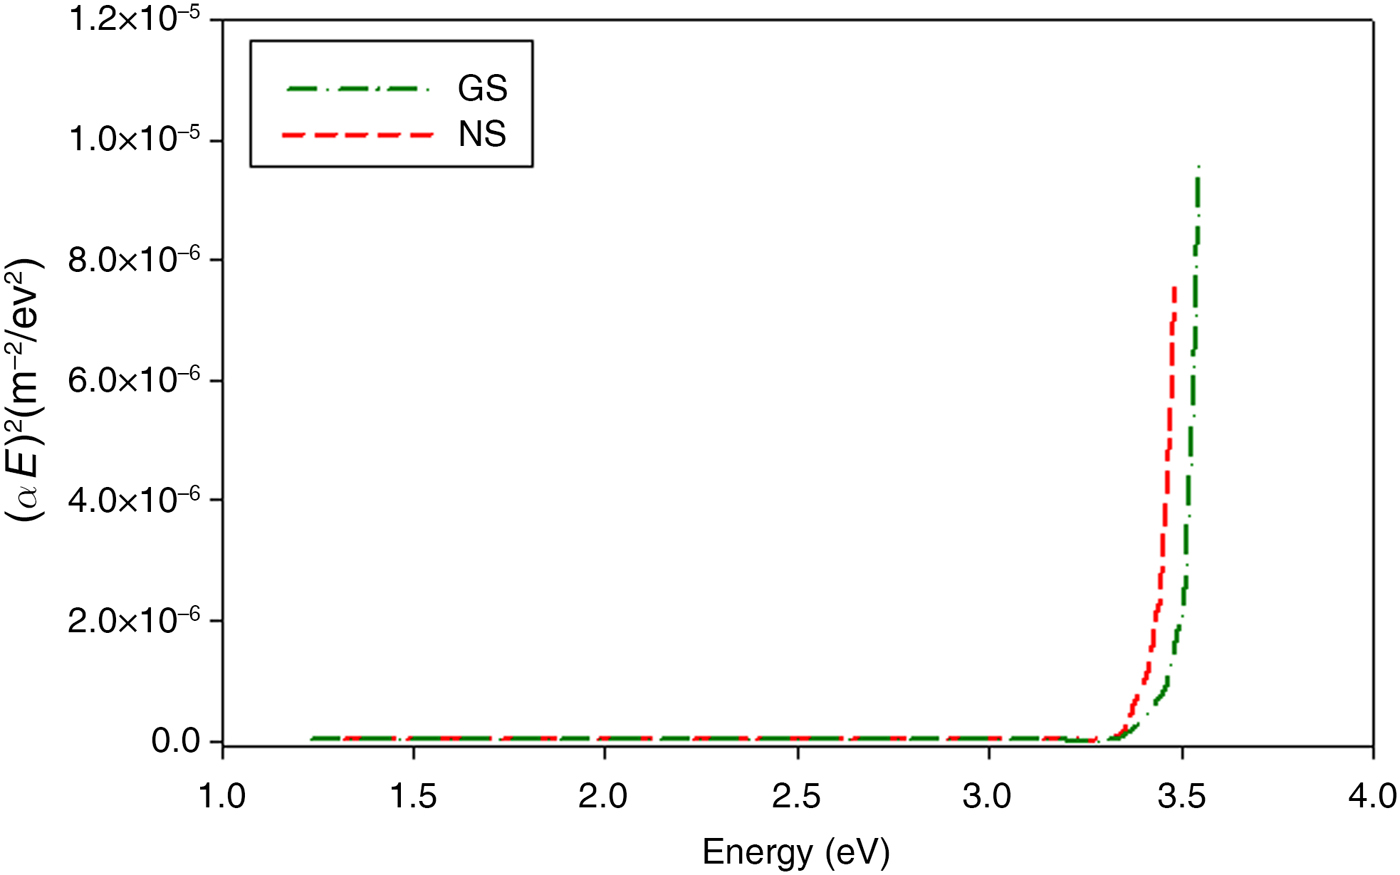
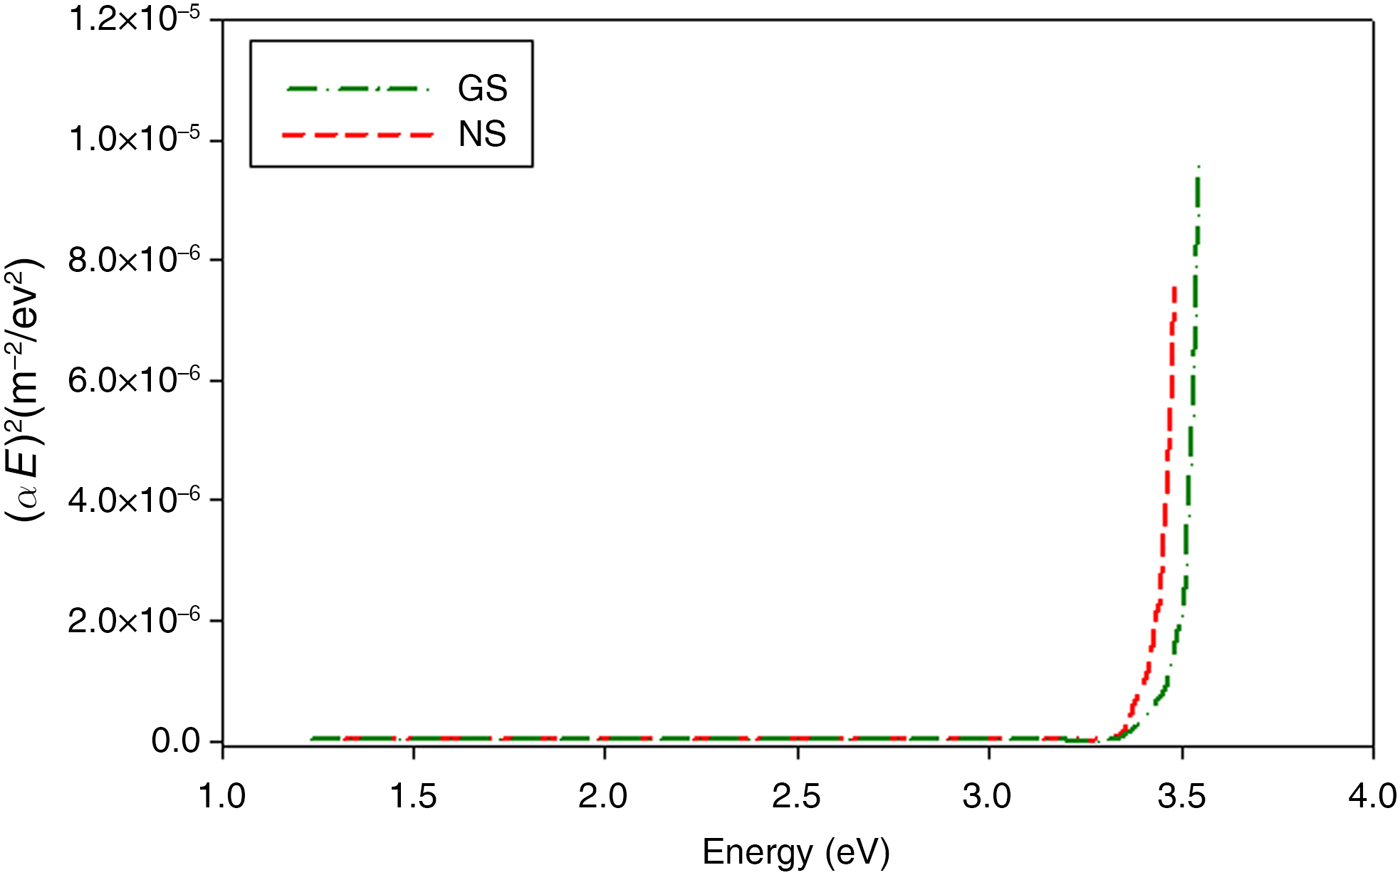
Here, E g is the optical energy gap between the conduction and the valence band.[Reference Shinde, Shinde, Bhosale and Rajpure34] Figure 7 shows the plots of (αE)2 versus photon energy (E, eV) for the ZnO-NPs sample. The calculated band gap values of the NS and GS ZnO-NPs samples are 3.21 and 3.26 eV, respectively. The band gap value of the GS ZnO-NPs was approximately 10% higher than that of NS ZnO-NPs, which is attributed to the effect of the Moss–Burstein shift.[Reference Mazilu, Tigau and Musat35] This is considered to result from the surface (or radiative) defects of the ZnO-NPs sample.[Reference Çolak and Türkoğlu17, Reference Kumar, Smita, Cumbal and Debut18]
The photon energy graphs of ZnO samples.
3.5 Antimicrobial activity
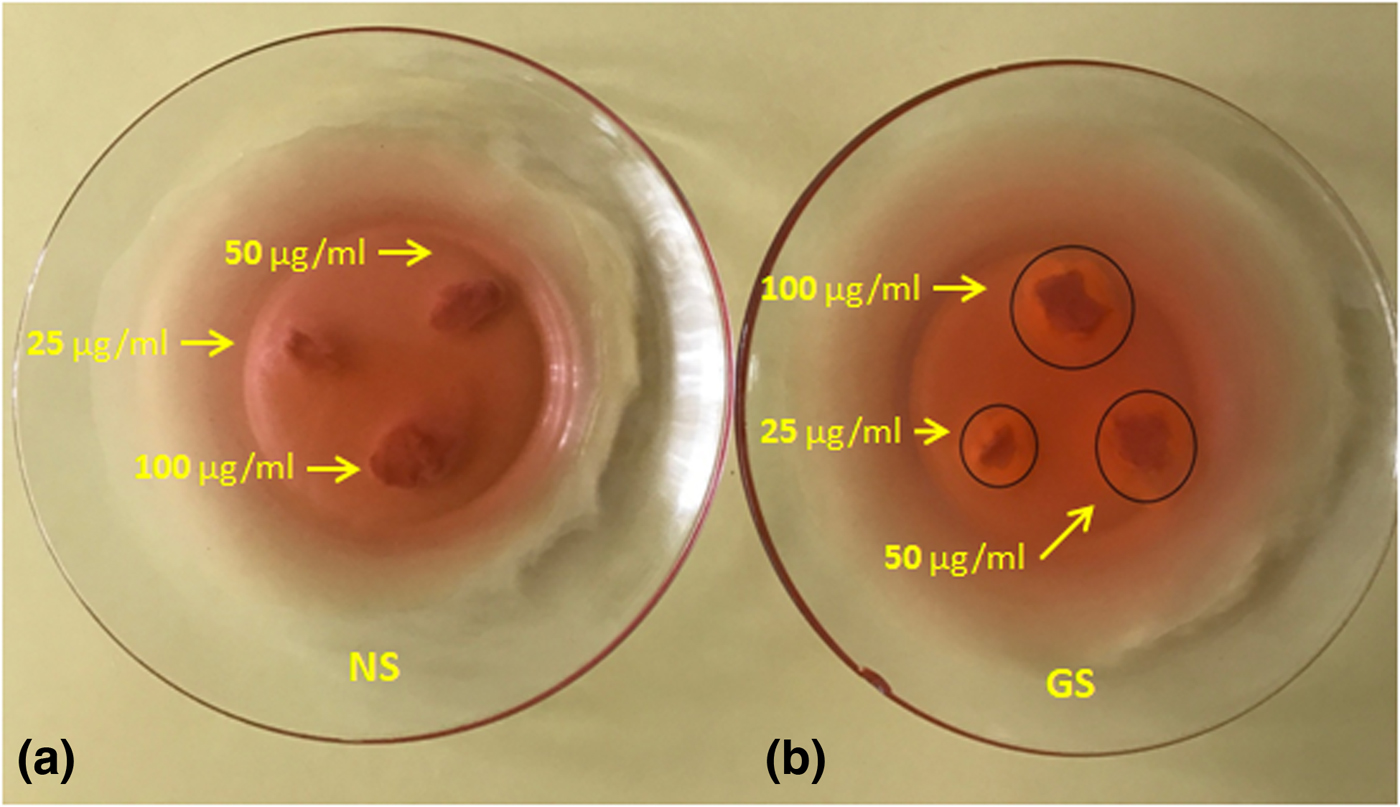
The DAD (disk agar diffusion) method was used to define the antimicrobial activity patterns against B. thuringiensis gram-positive bacteria. GS and NS ZnO-NPs were used to define the activity of the bacteria. The ZnO-NP samples were loaded with 20 µL (25, 50 and 100 µg/mL) suspended in DI H2O. The NS ZnO-NPs did not show antibacterial activity, while the GS ZnO-NPs illustrated antibacterial activity against B. thuringiensis gram-positive bacteria (as seen in Fig. 8). The GS ZnO-NPs damaged the B. thuringiensis bacteria membrane, probably due to the production of a reactive sort of oxygen, such as OH− hydroxide ions or superoxides. GS ZnO-NPs have positive zeta potential on the B. thuringiensis bacteria membrane surface. Similar antimicrobial activities of ZnO-NPs have been observed in other works.[Reference Divya, Sowmia, Joona and Dhanya36, Reference Divyapriya, Sowmia and Sasikala37]
Photographs (a) and (b) showing zone inhibition values of different concentration (25, 50, 100 g/mL) of GS and NS ZnO-NPs against Bacillus thuringiensis.

4. Conclusions
This study shows that ZnO nanorods were manufactured for the first time by a green synthesis process using Mentha (mint) aqueous extract. The XRD analysis illustrates that the GS and NS-NPs were indexed as having a hexagonal (wurtzite) phase with a polycrystalline structure. The average crystallite sizes between 50 and 60 nm were calculated from XRD analysis. The FE-SEM photographs were analyzed and provided knowledge about the morphology of the phases and the size. They illustrated that the green synthesis process clearly had an impact on the morphology of the ZnO-NPs. The FE-SEM micrographs showed that the GS ZnO-NPs samples had nanorod shape NPs with a nanorod size ranging from 80 to 100 nm, and also the green synthesis derived GS sample had a smaller grain size than that of the NS sample. The optical transmittance values of the GS and NS ZnO-NPs samples were 90% and 82%, and the optical band gap values were 3.21 and 3.26 eV, respectively. The electrical conductivity values of the GS and NS ZnO-NPs were between 2.08 × 10⁻⁸ and 9.12 × 10⁻⁴/Ω/cm, at 25 and 550° C, respectively. The GS ZnO-NPs had good electrical properties compared with the NS ZnO-NPs samples; this is related to the morphology and crystallinity of the samples. The green synthesis derived ZnO-NPs exhibited antibacterial activity.
Acknowledgments
This work was supported by the Turkish Scientific and Technical Research Institute (TUBİTAK) (Grant No: 115F045) and Çankırı Karatekin University Research Funds (Grant No. FF231215L40).