I. INTRODUCTION
Measuring time-dependent mechanical properties of materials at small scale and elevated temperature is one of the current challenges for nanoindentation testing. Reference Wheeler, Armstrong, Heinz and Schwaiger1–Reference Li, Fang, Lu, Yu, Hou and Feng3 Progress in technologies to perform high temperature nanoindentation is now reaching a critical point and most related challenges are on the way to being elucidated. Reference Wheeler, Armstrong, Heinz and Schwaiger1 Successful small scale mechanical characterization up to 600 °C and more have already been published. Reference Wheeler, Armstrong, Heinz and Schwaiger1,Reference Everitt, Davies and Smith4 However it is worth noticing that experimental data at high temperature are much more limited than those measured using room temperature indentation. Reference Phani and Oliver2,Reference Everitt, Davies and Smith4 Hence there is a need to develop accurate methodologies to extract creep and/or relaxation parameters of materials with a limited set of data, which is the aim of this paper.
Several methods have been developed successfully to relate uniaxial creep parameters to indentation tests using constant load and hold (CLH) creep tests. Reference Phani and Oliver2,Reference Sakai and Shimizu5–Reference Dean, Campbell, Aldrich-Smith and Clyne13 Indeed, this loading procedure is well adapted to most nanoindenters, which are load-controlled. Moreover, recent progress in feedback loop rapidity allows the characterization of the first tenths of second. All this precludes the apparition of an extended field of characterization for nanoindentation tests. However, such tests present some limits which are more or less sensitive as a function of the material mechanical behavior. During the hold load segment, the indentation-affected volume increases continuously. This makes more and more material enter primary creep. For this reason, Goodall et al. Reference Goodall and Clyne20 claimed that the use of CLH tests could lead to discrepancies in determining the fundamental creep characteristics. These uncertainties can be minimized for materials exhibiting a small primary creep region compared to stationary creep.
Constant displacement and hold (CDH) relaxation tests might appear to be better candidates to obtain these fundamental characteristics in a wider range of conditions, as the affected volume is not supposed to vary significantly during the hold segment. Reference Sakai, Sasaki and Matsuda14–Reference Patel, Sreeram, Venkatanarayanan, Krishnan and Yuya19 However they have not been popular. Reference Goodall and Clyne20 As stated before, few nanoindentation apparatuses are displacement-controlled, sometimes making it difficult to maintain a constant displacement contrary to a prescribed load. Nevertheless, recent progresses in feedback loop rapidity opens the way for very accurate control of the tip displacement and thus to CDH tests.
Indentation relaxation tests are studied here in the framework of conical and, by extension, pyramidal indentation. Two main advantages are linked to these geometries. First the applied deformation is constant during loading and depends on the cone or equivalent cone angle. Second, the geometry is self-similar which allows for constant strain rate loading experiments. In comparison, the spherical indentation applies a broad strain range during loading which results in a large strain rate distribution. This is not ideal when indenting a material with time-dependent mechanical properties since the measurements are directly affected by the loading history. An alternate way to conduct indentation experiments would be to use flat punch for which the contact area remains constant during the experiment. However, problems can arise from the parallelism between the punch and the surface. Moreover, particular care must be taken to choose a correct diameter, limiting edge effects at the boundary of the contact.
The aim of this work is to assess the relevance of indentation relaxation tests for obtaining fundamental relaxation characteristics. For the sake of simplicity and clarity, theoretical developments are here limited to linear viscoelastic solids. Based on results from the literature and analytical developments, the consistencies of CLH and CDH indentation tests compared to uniaxial experiments are discussed. Most theoretical developments in the literature consider step loading and hold displacement, Reference Zhang, Zhang, Zeng, Shen and Wang16,Reference Peng, Ma, Feng, Huan, Qin and Zhang18,Reference Vanlandingham, Chang, Drzal, White and Chang21,Reference Schiffmann22 which leads to straightforward equations relating fundamental relaxation parameters and CDH tests. However, such loadings are far from experimental capabilities. In this paper, specific attention is thus paid to the effect of this loading segment. More specifically, the constant strain rate and constant displacement rate tests are analyzed in the frame of the viscoelastic Maxwell generalized model. Finally, to check these analytical developments, experimental tests are conducted on poly(methyl methacrylate) (PMMA) at room temperature. PMMA is chosen as a model material because of its homogeneity at the scale of nanoindentation testing and its time-dependent mechanical behavior at room temperature. However, it is not claimed in this article that PMMA behaves as a linear viscoelastic solid when indented with a pyramidal indenter such as the Berkovich one. Indeed, it is well known that PMMA behaves as a viscoelastic–viscoplastic solid under cone indentation experiments. Reference Bucaille, Felder and Hochstetter23,Reference Kermouche, Loubet and Bergheau24 Linear viscoelastic analysis is used here to give trends about advantages and limitations of indentation relaxation tests.
II. THEORETICAL FRAMEWORK
Uniaxial behavior of materials whose mechanical properties are time-dependent can be expressed either in terms of the uniaxial relaxation modulus E(t) or in terms of the creep compliance J(t) Reference Findley25 by
 $$\sigma (t) = \int_{ - \infty }^t {E\left( {t - t'} \right){{\partial \varepsilon (t')} \over {\partial t'}}{\rm{d}}t'} \quad ,$$
 $$\varepsilon (t) = \int_{ - \infty }^t {J\left( {t - t'} \right){{\partial \sigma \left( {t'} \right)} \over {\partial t'}}{\rm{d}}t'} \quad ,$$
where σ(t) and ε(t) are, respectively, the uniaxial stress and strain as a function of time, t. For step loading history—i.e., constant strain (ε0) or constant stress (σ0)—relaxation modulus or creep compliance can be obtained by the following relations:
 $$G\left( t \right) = {{E\left( t \right)} \over {2\left( {1 + \nu \left( t \right)} \right)}} = {1 \over {2\left( {1 + \nu \left( t \right)} \right)}}{{\sigma \left( t \right)} \over {{\varepsilon _0}}}\quad ,$$
 $$J\left( t \right) = {{\varepsilon \left( t \right)} \over {{\sigma _0}}}\quad .$$
For convenience and homogeneity with the on-coming theoretical developments, Eq. (3) is written in terms of relaxation modulus in shear G(t), which is a function of uniaxial relaxation modulus E(t) and viscoelastic Poisson’s ratio ν(t). The following developments will consider a constant Poisson’s ratio, noted as ν, which is the case for polymers in their glassy state. Reference Tschoegl, Knauss and Emri26
In the framework of a rigid cone indenting a homogeneous linear viscoelastic half space with a monotonically increasing contact radius, the load–displacement relation can be computed using the equations below, Reference Ting27,Reference Graham28
 $$F\left( t \right) = \pi \tan (\beta )\int_{ - \infty }^t {\psi \left( {t - t'} \right){{\partial {a^2}\left( {t'} \right)} \over {\partial t'}}{\rm{d}}t'} \quad ,$$
 $${a^2}\left( t \right) = {1 \over {\pi \tan \left( \beta \right)}}\int_{ - \infty }^t {\phi \left( {t - t'} \right){{\partial F\left( {t'} \right)} \over {\partial t'}}{\rm{d}}t'} \quad ,$$
where F(t) is the load, β the inclined face angle, a(t) is the contact radius, ψ(t) is equivalent to the relaxation modulus in shear, and ɸ(t) to the creep compliance in shear.
Equations (5) and (6) are derived from the formulation of a cone indenting an elastic half space. Thus, they are only valid in the framework of small strain theory. This assumption is not straightforward in the case of conical indentation, since the equivalent strain applied is typically around 10%, even for small face angle. Hence, this framework is chosen to exhibit trends linked to the time-dependent behavior and not to render the complex mechanisms coupled with conical indentation.
A. Case of CLH creep test
The basic principle here is to keep constant the load during a given time duration. The displacement of the indenter is recorded and a relation can be drawn in terms of representative stress and strain. For a step load, the creep compliance is then given by Reference Sakai and Shimizu5,Reference Tweedie and Van Vliet9,Reference Vanlandingham, Chang, Drzal, White and Chang21,Reference Schiffmann22
 $$\phi \left( t \right) = {1 \over {2\left( {1 - {\nu ^2}} \right)\tan \left( \beta \right)}}.{{{A_{\rm{c}}}\left( t \right)} \over {{F_0}}}\quad ,$$
where A c(t) is the contact area and F 0 the constant applied load. Comparison of indentation experimental procedure [Eq. (7)] and uniaxial formulation of creep [Eq. (4)] yields some mismatches. During the load holding segment, the contact area changes continuously and so does the mean pressure under the indenter. Yet, the hypothesis of constant applied stress is not respected. Tweedie et al. Reference Tweedie and Van Vliet9 take this into account, considering ɸ(t) as a contact creep compliance reflecting the change in the contact area as a function of time rather than proper creep compliance. Yang et al. Reference Yang, Zhang and Zeng6 also express those limitations in their study on polymers.
Furthermore, as the contact area grows, the volume affected by the indentation grows as well. As explained in Sec. I, measurement of the creep compliance is not performed over a constant indentation-affected volume. According to Goodall et al., Reference Goodall and Clyne20 it can lead to misleading measurement of stationary creep.
B. Case of CDH relaxation test
In this paragraph, the relaxation modulus is calculated for a constant contact radius. This cannot be directly performed experimentally, since only the total displacement of the indenter is measured. To extend this theoretical expression to experimental considerations, it is assumed from the solution of a cone indenting an elastic half space, given by Love and Sneddon, Reference Love29,Reference Sneddon30 that the ratio between contact radius and penetration depth remains constant whatever be the loading history, using
 $${h \over a} = {\pi \over 2}\tan \left( \beta \right)\quad .$$
For the Berkovich tip, the equivalent angle β is equal to 19.68°. Hence the ratio (h/a) is equal to 0.56. Since this ratio is defined for elastic solids, it needs to be checked a posteriori in the case of time-dependent mechanical properties solids.
From Eq. (5), a contact radius step loading—i.e.,
 $a(t) = {a_1} \cdot \Upsilon (t)$
—leads to
 $$F\left( t \right) = \pi a_1^2\tan (\beta )\int_{ - \infty }^t {\psi \left( {t - t'} \right) \cdot \delta (t'){\rm{d}}t'} \quad ,$$
with
 $\Upsilon \left( t \right)$
and δ(t), respectively, the Heaviside and Dirac delta functions.
The mean pressure is then given by
 $${p_{\rm{m}}}\left( t \right) = \tan \left( \beta \right) \cdot \psi (t)\quad .$$
Thus, p m(t) is proportional to ψ(t). As a result, in indentation, ψ(t) is equivalent to G(t) in the uniaxial expression for a contact radius step loading. G(t) is given by the following relation:
 $$G\left( t \right) = \left( {1 - \nu } \right) \cdot \psi \left( t \right) = {{\left( {1 - \nu } \right)} \over {\tan \left( \beta \right)}}{{F\left( t \right)} \over {\pi a_1^2}}\quad .$$
Besides, this theoretical loading procedure does not imply any variations of indentation-affected volume during the hold period. Hence, both representative strain and affected volume stay constant, which allows a clear characterization of the relaxation behavior.
III. EFFECT OF LOADING KINETICS ON CDH TESTS
Relaxation and creep experiments have to be performed using a step load to avoid any time-dependent effect before the hold displacement step. This cannot be achieved experimentally and a loading segment has to be considered. Several analytical studies consider the influence of loading kinetics on viscoelastic solid behavior, Reference Oyen7,Reference Cheng and Cheng31–Reference Kermouche, Loubet and Bergheau33 but none of them investigates their related effects on CDH measurements. In this section, two loading kinetics are investigated in the framework of viscoelastic generalized Maxwell models: the constant displacement rate and constant strain rate. It must be highlighted here that those loading kinetics do not represent exactly the ones performed experimentally, since the majority of the nanoindentation apparatuses are load-controlled. Nevertheless, they provide an elementary support to understand, analytically, their effects on CDH measurements.
A. About generalized Maxwell models
Generalized Maxwell models are parallel combinations of n branches of Maxwell elements, composed of spring and dashpot put in series and defined, respectively, by shear moduli, G i , and viscosities η i . Let us note spring G 0, the long term elastic contribution. Each branch is characterized by a relaxation time τ i = η i /G i . The shear viscoelastic modulus is given by Eq. (12). Due to its simplicity, this model is extensively used to describe viscoelastic materials such as polymers. Reference Tschoegl34,Reference Ferry35 However a discrete distribution of relaxation times is not always suitable. It is then better to assess a continuous relaxation spectrum rather than a discrete one. The model described by Eq. (12) can thus be expressed in a continuous way using Eq. (13) where the relaxation spectrum, H(θ), Reference Schwarzl and Staverman36,Reference Ferry and Williams37 characterizes the continuous viscoelastic contribution of the material,
 $$G\left( t \right) = {G_0} + \mathop \sum \limits_{i = 1}^n {G_i}\exp \left( { - {t \over {{\tau _i}}}} \right)\quad ,$$
 $$G\left( t \right) = {G_0} + \int_0^{ + \infty } {H\left( \theta \right)\exp \left( { - {t \over \theta }} \right){\rm{d}}\theta } \quad .$$
This relaxation spectrum can be used advantageously to visualize the viscoelastic contribution during the relaxation step, using a first-order approximation of H(θ) given by Schwarzl et al. Reference Schiffmann22,Reference Schwarzl and Staverman36
 $${H_1}\left( \theta \right) = - t{\left. {{{{\rm{d}}G\left( t \right)} \over {{\rm{d}}t}}} \right|_{t = \theta }}\quad .$$
B. Constant displacement rate
A constant displacement rate followed by a hold segment can be written as
 $$h\left( t \right) = {r_1} \cdot t + \Upsilon \left( {t - {t_1}} \right) \cdot {r_1} \cdot ({t_1} - t)\quad ,$$
with r
1 the loading rate,
 $\Upsilon \left( t \right)$
the Heaviside function, and t
1 the time when the hold segment starts.
Combining Eqs. (5), (8), and (15) yields
 $$F\left( t \right) = {{\pi \tan \left( \beta \right)} \over {1 - \nu }}{\left( {{a \over h}} \right)^2} \times \left[ {{G_0} \cdot h_1^2 + 2\mathop \sum \limits_{i = 1}^n {G_i} \cdot r_1^2{\tau _i}\exp \left( { - {{t - {t_1}} \over {{\tau _i}}}} \right) \times \left[ {{{{h_1}} \over {{r_1}}} + {\tau _i}\left( {\exp \left( { - {{{h_1}} \over {{r_1}{\tau _i}}}} \right) - 1} \right)} \right]} \right]\quad .$$
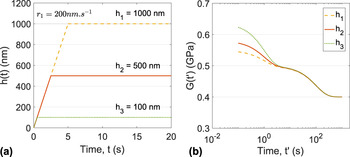
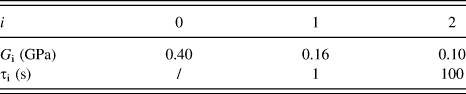
Note that this expression is defined for t ∈ [t 1, +∞). The shear relaxation modulus can thus be derived from Eqs. (8), (11), and (16). The last term of Eq. (16) depends on h 1, which is the displacement applied during the hold segment. It points out that the relaxation modulus calculated according to these equations will depend on the hold displacement for a constant loading rate r 1. An illustration of this phenomenon is plotted in Fig. 1(b) using viscoelastic parameters given in Table I. From here, the time considered from the beginning of the hold segment will be noted t′ = t − t 1. The effect is more pronounced for short relaxation time and large displacement. It might lead to misleading conclusions, especially in terms of size effect since the shear relaxation modulus is significantly lowered when indentation depth increases. However, keeping a constant loading time t 1 when varying the hold displacement can prevent this issue. Indeed, in Eq. (16), terms in the sum depend only on loading time—i.e., (h 1/r 1). Thus, from linear viscoelastic theory, it is necessary to compare equivalent loading time experiments rather than compare experiments performed with a constant loading rate, when indenting at different depths.
Analytical calculations of the constant loading rate and hold displacement procedure on a generalized Maxwell solid (described Table I) with conical indentation. (a) Evolution of the tip displacement for different maximum penetrations [calculated from Eq. (15)] and (b) viscoelastic modulus [obtained from Eqs. (11) and (16)] plotted versus time t′ which represents the time from the first constant penetration point at t = t 1.

Values of the two relaxation times generalized Maxwell model used in Sec. III.

C. Constant strain rate
Constant strain rate experiments have been first proposed by Lucas et al.
Reference Lucas, Oliver, Pharr and Loubet38
and consist of performing loading with
 $\left( {\dot h{\rm{/}}h} \right)$
constant, meaning that h increases exponentially with time. In the framework of homogeneous materials and self-similar tips, a representative strain rate, noted as α, proportional to this ratio can be defined.
Reference Kermouche, Loubet and Bergheau33
Moreover the ratio
 $\left( {\dot F{\rm{/}}F} \right)$
then becomes proportional to
 $\left( {\dot h{\rm{/}}h} \right)$
, which is of interest for load-controlled devices,
 $$\alpha = {{\dot h} \over h} = {1 \over 2}{{\dot F} \over F}\quad .$$
Introducing h(t) = h 0 exp(αt) in Eqs. (5) and (8) yields
 $$F\left( t \right) = {{\pi \tan \left( \beta \right)} \over {1 - \nu }}{\left( {{a \over h}} \right)^2} \times \left[ {\left( {{h^2}\left( t \right) - h_0^2} \right){G_0} + \sum\limits_{i = 1}^n {{{2\alpha {\tau _i}} \over {2\alpha {\tau _i} + 1}}{G_i}\left( {{h^2}\left( t \right) - h_0^2 \cdot \exp \left( { - {t \over {{\tau _i}}}} \right)} \right)} } \right]\quad .$$
Assuming that h 0 is negligible when compared to h(t), this equation can be simplified and leads to the expression proposed by Kermouche et al., Reference Kermouche, Loubet and Bergheau33
 $$F\left( t \right) = {{\pi \tan \left( \beta \right)} \over {1 - \nu }}{\left( {{a \over h}} \right)^2}{h^2}\left( t \right)\left( {{G_0} + \sum\limits_{i = 1}^n {{{2\alpha {\tau _i}} \over {2\alpha {\tau _i} + 1}}{G_i}} } \right)\quad .$$
Extending these results to a further displacement hold step can be done by assuming the following expression:
 $$h\left( t \right) = {h_0}\exp \left( {\alpha t} \right) + \Upsilon \left( {t - {t_1}} \right)\left[ {{h_0}\exp \left( {\alpha {t_1}} \right) - {h_0}\exp \left( {\alpha t} \right)} \right]\quad .$$
It yields
 $$F\left( t \right) = {{\pi \tan \left( \beta \right)} \over {1 - \nu }}{\left( {{a \over h}} \right)^2}h_1^2\left( {{G_0} + \mathop \sum \limits_{i = 1}^n {{2\alpha {\tau _i}} \over {2\alpha {\tau _i} + 1}}{G_i} \cdot \exp \left( { - {{t - {t_1}} \over {{\tau _i}}}} \right)} \right)\quad .$$
Here again the above expression is defined for t ∈ [t 1, +∞). The shear relaxation modulus can thus be derived from Eqs. (8), (11), and (21)
 $$G\left( t \right) = {G_0} + \mathop \sum \limits_{i = 1}^n {{2\alpha {\tau _i}} \over {2\alpha {\tau _i} + 1}}{G_i} \cdot \exp \left( { - {{t - {t_1}} \over {{\tau _i}}}} \right)\quad .$$
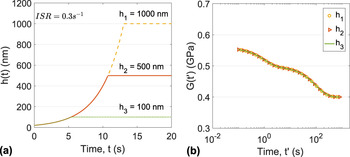
None of the terms inside the brackets of Eq. (21) depend on h 1, which means that the relaxation modulus measured according to Eq. (22) does not depend on the hold displacement during the hold segment. This is also illustrated in Fig. 2 where relaxation modulus G(t) of a two time constant Maxwell generalized model (see Table I) is plotted for three maximum depths. Consequently, it is clear that constant strain rate segments are suitable to perform indentation relaxation tests.
Analytical calculations of the constant strain rate loading and hold displacement procedure on a generalized Maxwell solid (described Table I) with conical indentation. (a) Evolution of the tip displacement for different maximum penetrations [calculated from Eq. (20)] and (b) viscoelastic modulus [calculated from Eq. (22)] plotted against time t′.

However, attention has to be paid on the effect of strain rate values on the shear relaxation modulus measured by indentation. Indeed, Eq. (22) matches Eq. (12) only when α → ∞, which is equivalent to a step loading. In the other case, a loss of information can be predicted depending on the loading strain rate,
 $${f_{\rm{c}}}\left( {\alpha ,{\tau _i}} \right) = {{2\alpha {\tau _i}} \over {2\alpha {\tau _i} + 1}}\quad .$$
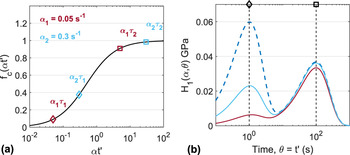
This effect is highlighted in Fig. 3 using viscoelastic parameters given in Table I. The first-order approximation H 1 of the relaxation spectrum is plotted for two different strain rates, α1 and α2, and compared to the nominal spectrum considering a step loading. As expected from Eq. (23), this effect is more pronounced for short relaxation time [see Fig. 3(a)]. From this relation, it comes straightforward that the ratio ατ i has to be greater than 10 to obtain 95% of the relaxation modulus for a given time constant τ i .
Analytical calculations of the loading kinetic effect on the relaxation measurements: (a) correction factor f c versus (α·t′) [calculated from Eq. (23)] and (b) relaxation spectra’s first approximation [Eq. (14)] of a two time constants generalized Maxwell model (defined Table I). Blue dashed line represents the nominal relaxation spectrum, solid lines represent the measured spectra for a 0.3 s−1 (light blue), and 0.05 s−1 (dark red) strain rate loading. Diamond and square markers, on top of the graph, represent time constants τ1 and τ2, respectively.

IV. APPLICATION TO PMMA
In this section, indentation relaxation tests were performed on a 4 mm thick PMMA with an arithmetic average roughness of 1.3 nm measured with the Scanning Probe Microscope (SPM) imaging module from Hysitron TI 950® (Hysitron Inc., Minneapolis, Minnesota). Experiments were operated at room temperature (22 °C). This polymer was chosen as a model material because of its homogeneity at the scale of nanoindentation testing and its time-dependent mechanical behavior at room temperature. However, as stated in the Introduction, it is not claimed that PMMA behaves as a linear viscoelastic solid when indented with a sharp tip. The main objective of this section is to check, on a real material, effects of loading segment on indentation relaxation tests, as shown by the above analytical developments. These effects can be summarized as follows:
-
(i) A constant strain rate loading segment allowed characterization of indentation relaxation independently of indentation depth.
-
(ii) An indentation relaxation spectrum is affected by the strain rate used during the loading segment.
Moreover, this section aims to highlight some experimental issues related to indentation relaxation tests.
A. Indentation method
Indentation experiments have been performed using a Nanoindenter SA2® (Keysight Technologies, Santa Rosa, California) with a Dynamic Contact Module (DCM) head that allows for very accurate measurements at low load and displacement. The device is load-controlled with a maximum indentation force of 10 mN and a resolution of 1 nN. Displacement is measured with a resolution of 0.2 pm. The constant stiffness measurement (CSM) was used with a frequency of 75 Hz and an amplitude of 1 nm. A Berkovich indenter (Keysight Technologies, Santa Rosa, California) was used. The tip defect, geometrically defined by the difference between the theoretical and actual tip vertex, Reference Guillonneau, Kermouche, Bec and Loubet39 is estimated for each test by the method of Loubet et al. Reference Loubet, Bauer, Tonck, Bec and Gauthier-Manuel40 The tip defect has been estimated on PMMA at 6 nm in the following developments.
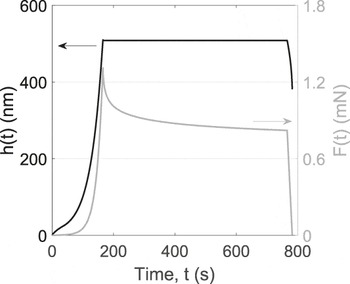
Finally, experiments were composed of three steps. First the loading segment:
-
(i) Constant strain rate loading at six different indentation strain rates (ISRs)—i.e.,
 $\left( {\dot h{\rm{/}}h} \right)$
—(0.0025 s−1, 0.005 s−1, 0.01 s−1, 0.025 s−1, 0.05 s−1, 0.15 s−1).
-
(ii) Constant loading rate of 0.45 mN/s.

And then the hold and unloading segments:
-
(i) Displacement-hold of 600 s at 500 and 1000 nm.
-
(ii) Constant unloading rate of 0.05 mN/s.
All the segments are illustrated in Fig. 4 for a 0.025 s−1 ISR and a 500 nm maximum penetration depth.
Indentation procedure for ISR = 0.025 s−1 with a 600 s displacement holding segment and an unloading part with a 0.05 mN/s rate. Solid black line represents the displacement and solid gray line the load evolution.

Each loading procedure was performed five times on PMMA. A 50 Hz data acquisition rate was chosen for the hold displacement step to record the relaxation behavior in the first tenths of seconds. Displacement measurements were directly corrected into the load frame, considering the frame stiffness. Thermal drift has been estimated for each experiment on PMMA. A small load of 2 μN was imposed onto the surface to stabilize the indenter prior to start the loading procedure. The stabilization time did not exceed 60 s. The drift measured during this hold segment did not exceed 0.015 nm/s. Displacement scatter due to thermal drift was less than 3% for all tested conditions; consequently no drift correction has been done to the data.
B. Ratio between penetration depth and equivalent contact radius
Computation of relaxation modulus and spectrum requires measurements of the contact area. For that purpose, the Oliver and Pharr method Reference Oliver and Pharr41 was used and has been proved to account accurately for the sinking-in behavior of PMMA. Reference Guillonneau, Kermouche, Bergheau and Loubet42 The contact depth is calculated using Eq. (24) in which F is the load, S is the contact stiffness, and h d is the tip defect,
 $${h_{\rm{c}}} = h - 0.75{F \over S} - {h_{\rm{d}}}\quad .$$
As stiffness data are more affected by noise than displacement data, the equivalent contact radius calculation is performed for each set of experiments at the beginning of the hold period using Eq. (25),
 $$a = {S \over {2E_{\rm{c}}^{\prime *}}}\quad .$$
 $E_{\rm{c}}^{\prime *}$
is the reduced elastic modulus of contact
Reference Loubet, Bauer, Tonck, Bec and Gauthier-Manuel40
calculated from CSM data during the loading segment. It is assumed that along CSM measurements, with respect to linear elasticity hypothesis,
 $E_{\rm{c}}^{\prime *}$
is constant. Hence, the ratio (h/a) from Eq. (8) is calculated experimentally. It is found to be 0.41 ± 2%, which is lower than the theoretical value of Sneddon,
Reference Sneddon30
that is to say 0.56. This is a clear signature of PMMA plastic flow during indentation.
V. RESULTS AND DISCUSSION
A. About displacement control
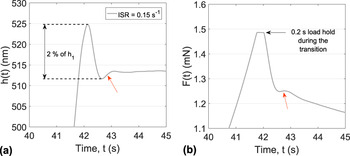
One issue in indentation relaxation tests is the displacement control loop, which has to be fast and accurate enough to ensure a minimum loss or modification of information, especially for short time-scale characterization. Reference Herbert, Sudharshan Phani and Johanns43 A signature of the displacement control loop oscillation on the recorded load is illustrated in Fig. 5. An overshoot is clearly visible during the transition from loading segment to hold displacement segment, for the maximum ISR tested [Fig. 5(a)]. This is due to the software transition management between segments which imposes a 0.2 s hold load segment [Fig. 5(b)]. It is worth noticing that it highly affects the recorded load although the maximum overshoot for all our experiments was less than 2% of the total penetration depth. Relaxation data are then meaningful only after a given period. Thus, relaxation indentation experiments require specific development efforts on displacement control loops. Here, only data measured after 1 s hold displacement segment are meaningful from the mechanical property point of view. These results can however be considered as acceptable in reference with the former study of Vanlandingham et al. Reference Vanlandingham, Chang, Drzal, White and Chang21 on the indentation relaxation of PMMA, for which constant displacement was reached after 6–8 s.
Displacement control during the hold segment of a 0.15 s−1 ISR experiment on PMMA and its effect on the recorded load. (a) Evolution of measured penetration during the loading to hold displacement transition. The overshoot and first oscillation are highlighted by the red arrow. The control loop has been tuned with a particular care to limit the first oscillation amplitude to 2% of the maximum displacement for all the test conditions. (b) Evolution of load on sample between loading segment and hold displacement segment: load is constant during 0.2 s. Then a quick drop is observed followed by a slight reload, displayed by the red arrow.

B. Relaxation modulus
Relaxation modulus G(t) is computed using Eq. (26),
 $$G\left( t \right) = {{\left( {1 - \nu } \right)} \over {\tan \left( \beta \right)}}{{F\left( t \right)} \over {\pi {h^2}}}{\left( {{h \over a}} \right)^2}\quad .$$
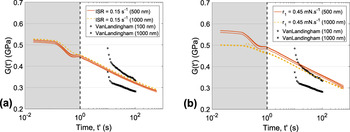
Poisson’s ratio was assumed to be constant Reference Tschoegl, Knauss and Emri26 and equal to 0.37. Reference Yee and Takemori44 Relaxation modulus versus time for a constant loading rate and constant strain rate is plotted in Fig. 6. In agreement with above analytical developments, relaxation modulus remains independent of the maximum indentation depth applied for constant ISR [see Fig. 6(a)], whereas the relaxation behavior significantly changes with maximum indentation depth for a constant loading rate. Data of Vanlandingham et al. Reference Vanlandingham, Chang, Drzal, White and Chang21 are compared to our experiments in Fig. 6. Measured relaxation moduli are included between the two literature data which seems to attest to the validity of our procedure. However, an overestimation of 15–20% of the moduli measured at 1000 nm is done. The relaxation behavior is somehow different for the first tens of seconds which could be explained by the different control loop applied between the two studies.
Relaxation modulus of PMMA for: (a) a constant strain rate loading performed at 0.15 s−1 ISR and (b) a constant loading rate of 0.45 mN/s, for two maximum penetrations. Plus and cross markers correspond to the data of Vanlandingham et al. Reference Vanlandingham, Chang, Drzal, White and Chang21 for a constant loading rate and hold displacement test on PMMA for two maximum penetrations.

One point which has not been addressed yet is the influence of friction on the measured mean pressure under the indenter. It has been assessed by Tabor Reference Tabor45 that the mean pressure is always overestimated in the presence of friction. This effect is more pronounced for higher face angle β, since the interfacial traction stress contributes to a larger extent to the indentation load. It is usually considered that friction can be neglected with Berkovich indenters. Reference Bucaille, Felder and Hochstetter23 Consequently, no specific correction has been performed.
C. Relaxation spectrum
Relaxation spectra have been computed using Eq. (14). Data have been sampled with a constant interval of 0.05 in log-time scale to avoid high frequency noise in the measurements made after ten seconds. Reference Schiffmann22 Only relaxation data resulting from a constant strain rate loading segment are analyzed here.
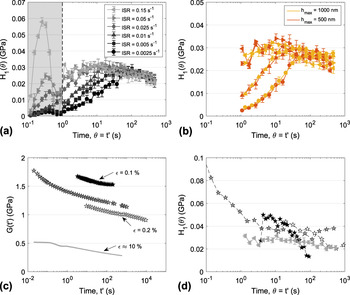
Relaxation spectra are plotted in Fig. 7(a). Three domains can be defined as follows:
-
(i) Relaxation times lower than 1 s (filled in gray color): A peak is observed. The higher the strain rate, the higher the peak. This peak is clearly an artifact caused by the displacement control loop and must not be considered.
-
(ii) Relaxation times higher than 100 s: spectra merge into a master curve whatever be the strain rate during the loading segment.
-
(iii) Intermediate region: spectra depend on the loading segment strain rate. The higher the strain rate, the higher the measured modulus.
Results on PMMA: (a) first approximation of relaxation spectra at 500 nm for different ISR loadings. (b) First approximation of relaxation spectra at 500 and 1000 nm. For readability purpose, only four sets of experiments per maximum penetration are represented. Marker notation for ISR value is the same as the one given in (a). Error bars correspond to the standard deviation calculated on 5 experiments. Note that, for some curves, the error bars are smaller than the markers. (c) Shear relaxation modulus from a set of 500 nm maximum penetration depth performed with a 0.15 s−1 ISR loading, compared to literature data obtained at room temperature. Gray curves represent the data obtained from our nanoindentation experiments. Black stars represent data from tensile rheometry obtained by Vanlandingham et al. Reference Vanlandingham, Chang, Drzal, White and Chang21 Gray stars represent data from three points bending relaxation test obtained by Fernández et al. Reference Fernández, Rodríguez, Lamela and Fernández-Canteli46 White stars represent data from uniaxial tension relaxation test obtained by Lu et al. Reference Lu, Zhang and Knauss47 (d) First approximation of relaxation spectra obtained from shear relaxation moduli given in (c). The same notation as in (c) is used for literature data. Gray triangle markers represent our nanoindentation data.

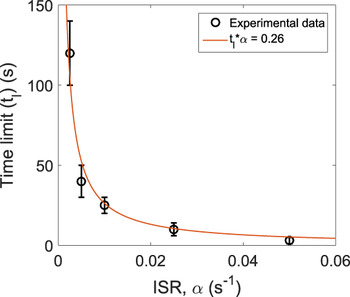
In the following, discussions will be based on the intermediate and long-time regions. The effect of indentation depth is analyzed in Fig. 7(b). The resulting relaxation spectra do not depend on the indentation depth, as expected, and is independent of the strain rate. The PMMA relaxation behavior does not depend on the contact size in the range of indentation depth investigated. It confirms that the use of a constant strain rate segment guarantees a size-independent measurement. These results are in good agreement with the previous theoretical linear viscoelastic developments. First, it is required to use a constant strain rate loading segment to investigate intrinsic size effects by indentation relaxation. Second, a misleading loss of amplitude in the relaxation spectrum can be observed, depending on the strain rate. This effect has been described in Sec. III.C. PMMA relaxation spectra exhibit the same attenuation trend as the simple two time constant Maxwell model. Hence, the nonlinearity observed in H 1(θ) for low ISR loading results in the attenuation of each time-dependent contribution at time θ. As stated in Sec. III.C, the attenuation is more pronounced for lower (ατ i )—i.e., (αθ). One way to deal with this would be to propose a correction factor, as introduced by Oyen et al. Reference Oyen7 in the frame of spherical indentation of viscoelastic solids. This might be done by using Eq. (27). However, such a correction factor would be limited to generalized Maxwell models and might lead to incorrect interpretations depending on the material behavior. The more promising way is to identify the characteristic time limit, t l, above which the measured relaxation spectrum is the intrinsic one and below which the amplitude is lowered. The curve characteristic time limit versus loading segment strain rate is plotted in Fig. 8. Estimation of the time limit has been performed from Fig. 7(a) where each curve has been compared with the 0.15 s−1 ISR reference. This curve seems to be ruled by the relation
 $${t_{\rm{l}}} \times \alpha = 0.26\quad .$$

According to the above results in linear viscoelasticity, one would have excepted a higher value close to 10 as explained in the previous section. This low value might be a consequence of the nonlinear time-dependent behavior of PMMA or of the assumption of discrete relaxation times distribution in above theoretical developments. This low value is, however, advantageous but needs to be identified experimentally. This might be achieved by doing several indentation relaxation tests with various strain rates.
D. Comparison with literature data
In this section, the relaxation modulus and spectrum measured using the methodology developed in this paper are compared to those of Vanlandingham et al. Reference Vanlandingham, Chang, Drzal, White and Chang21 obtained from tensile rheometry, Fernández et al. Reference Fernández, Rodríguez, Lamela and Fernández-Canteli46 obtained from macroscopic three points bending test, and Lu et al. Reference Lu, Zhang and Knauss47 obtained from plate uniaxial tension. Note that their results have been transformed into shear relaxation moduli using Eq. (3). First-order relaxation spectra have been calculated with Eq. (14). They are plotted in Figs. 7(c) and 7(d), respectively. PMMA’s relaxation behavior has been studied under different strains depending on the procedure used to characterize it. Strain levels are displayed in Fig. 7(c), going from 0.1% for tensile rheometry to around 10% for Berkovich indentation. Reference Kermouche, Loubet and Bergheau24 A clear illustration of the nonlinear behavior of PMMA Reference Cruz Pinto and André48 is shown. The augmentation of applied strain leads to a significant decrease in stress relaxation modulus. Reference Vanlandingham, Chang, Drzal, White and Chang21 Indeed, the strain level under a Berkovich tip is two orders of magnitude higher than those of the compared literature references, so one would expect the measured relaxation behavior to be significantly different. Nevertheless, good agreement is found for relaxation spectra [see Fig. 7(d)]. It points out that the relaxation behavior does not significantly change with applied strain. Only the long-term elastic modulus, G 0, seems to decrease with increasing strain. Yet, data from Fernández et al. show an increase in the relaxation spectrum for relaxation times lower than 10 s contrary to the 0.15 s−1 ISR indentation relaxation data. This is expected from Eq. (23) which states that indentation relaxation tests cannot provide the entire spectrum with a good accuracy, unless using a step-based loading segment.
VI. CONCLUSION
Thanks to analytical developments in the frame of indentation relaxation of linear viscoelastic solids, the following issues have been addressed in this paper:
-
(1) Indentation relaxation occurs over a constant indentation-affected volume of material, contrary to indentation creep. Indentation relaxation is thus closer to uniaxial relaxation than indentation creep to uniaxial creep.
-
(2) The loading segment kinetics may strongly affect indentation relaxation results. An exponential increase in loading speed guarantees a size-independent measure of the relaxation modulus compared to linear loading where a particular care must be taken in conducting the experiments with the same loading time.
-
(3) Loading segment strain rate affects the relaxation spectrum up to a critical relaxation time. The higher the ISR, the lower the characteristic time limit.
These different trends have been checked using an experimental investigation of indentation relaxation of PMMA and a dedicated nanoindentation procedure. Good agreement with the theory was obtained. The highest ISR resulted in a relaxation spectrum closer to those measured in macroscopic tests on PMMA. Furthermore, these results pointed out that experimental relaxation modulus and spectrum were highly influenced by the control loop overshoot and the loading segment kinetics for short relaxation time. To perform efficient relaxation characterization, an equilibrium must be found between high strain rate loading and overshoot limitation.
ACKNOWLEDGMENTS
This work was supported by the LABEX MANUTECH-SISE (ANR-10-LABX-0075) of Université de Lyon, within the program “Investissements d’Avenir” (ANR-11-IDEX-0007) operated by the French National Research Agency (ANR). The authors would also like to acknowledge financial support from Institut Carnot Ingénierie@Lyon. The authors finally acknowledge Dr. M. Laurent-Brocq and G. Bracq from ICMPE for fruitful discussions.