Introduction
In the eyes of the different materials analysis communities, electron energy-loss spectroscopy (EELS) has been considered one of the many tools capable of providing chemical information. Most suited and privileged by materials characterization users for the quantitative analysis of light elements, EELS made its major earlier contributions in the analysis of carbonitride precipitates in steels at a time where no other technique could provide the broad imaging capability for precipitates and quantitative measurement of carbon and nitrogen concentration. Until the mid-1980s, EELS was used mostly with lab-built hardware developed in only a few laboratories and attached on transmission electron microscopes (TEMs), mostly in biological applications. The impact of the technique for the broad materials community became more obvious and concrete when parallel EELS technology became available.Reference Krivanek, Ahn and Keeney1 With efficient parallel detectors using photodiode arrays instead of slow serial acquisition with photomultipliers, more microscopes equipped with EELS capabilities became available in many laboratories in the late 1980s. In the early 1990s, the development of imaging filtersReference Krivanek, Gubbens and Dellby2 led to the use of elemental mapping not only in the field of nanoscale materials characterization and in biology but also in real-life applications, such as the study of alloys, minerals, and ceramics.
Although pioneering work on electron scattering, optical properties, and collective excitation in materials was carried out in the early days of EELS,Reference Raether3 in the eyes of the broad materials physics community, the technique has been long perceived (arguably) as a “chemical” analysis tool used in the microscope capable of taking “pretty pictures.” Only in a few laboratories was the technique used to probe the electronic structure of materials, where it was seen as a spectroscopic tool on par with a synchrotron beam line. Starting with lab-built spectrometers and subsequently appearing in commercial microscopes, the use of the technique as a tool for the study of electronic structure of materials increased slowly. One limitation was the energy resolution of the electron microscope/spectrometer system. Only the dedicated high-resolution EELS spectrometer developed in Karlsruhe, Germany, by the Fink group in the 1980sReference Fink, Fuggle and Inglesfield4 was capable of resolution below 0.1 eV and was used in pioneering work in a broad range of materials, such as superconductors, conducting polymers, and free electron metals. However, it had no imaging capabilities, unlike those found in the TEM. Dedicated microscopesReference Terauchi, Tanaka, Tsuno and Ishida5 equipped with electron monochromators also reached very high energy resolution but were limited by the low electron beam current and the electron beam size. Nevertheless, these technologies showed the enormous potential of EELS in the study of bonding and electronic structure of materialsReference Fink6 through the use of near-edge structure features on the ionization edges and, using low energy losses, in the study of the dielectric properties of materials. Commercial systems attached to electron microscopes, equipped with cold-field emission sources, were able to reach about 0.4 eV energy resolution. More generally, 0.7–1 eV resolution can be reached in microscopes fitted with Schottky-type electron sources, which combine the advantages of stable emission at high temperature with the high brightness of a field-emission source. Although useful, the potential of the method was thus largely ignored by the broad materials physics community more familiar with the energy resolution available in synchrotron beam lines. In the eyes of some users, the technique remained for decades a “method with a lot of potential in the future.”
Following the development of new electron sources, stable electron microscopes, aberration correctors, and commercial monochromators, the applications of EELS in the two worlds of materials analysis and materials physics are now finally converging. Many examples from the last few years are demonstrating the powerful combination of chemical analysis with atomic sensitivity and exquisite local bonding and electronic structure information, all this with atomic resolution. As discussed in the reviews by Kociak and García de Abajo, Varela et al., and Suenaga et al. and the introductory remarks of Pennycook and Colliex in this issue of MRS Bulletin, the impact of the technique is enormous and now very tangible. In this article, the fundamental aspects of the spectroscopic sensitivity and background information are briefly reviewed, and examples of applications of spectroscopic imaging with EELS are given such that the interested reader can appreciate the true impact of the method for the chemical and spectroscopic characterization of materials. Many textbooks dedicated to this technique and, in particular, the most recent edition of the EELS bookReference Egerton7 and article by Egerton,Reference Egerton8 present the fundamentals of EELS and the state of the art in theory and applications. Shorter focused reviews are also covered in dedicated extended chapters.Reference Botton, Hawkes and Spence9, Reference Radtke, Botton, Nellist and Pennycook10 The aim here is to provide highlights of the potential of the technique focusing on the spectroscopic aspects of local studies of the electronic structure, new developments in instrumentation that have impacted this field, as well as some representative applications.
Background information
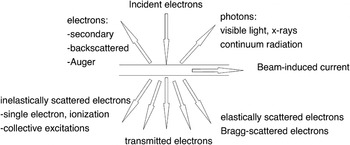
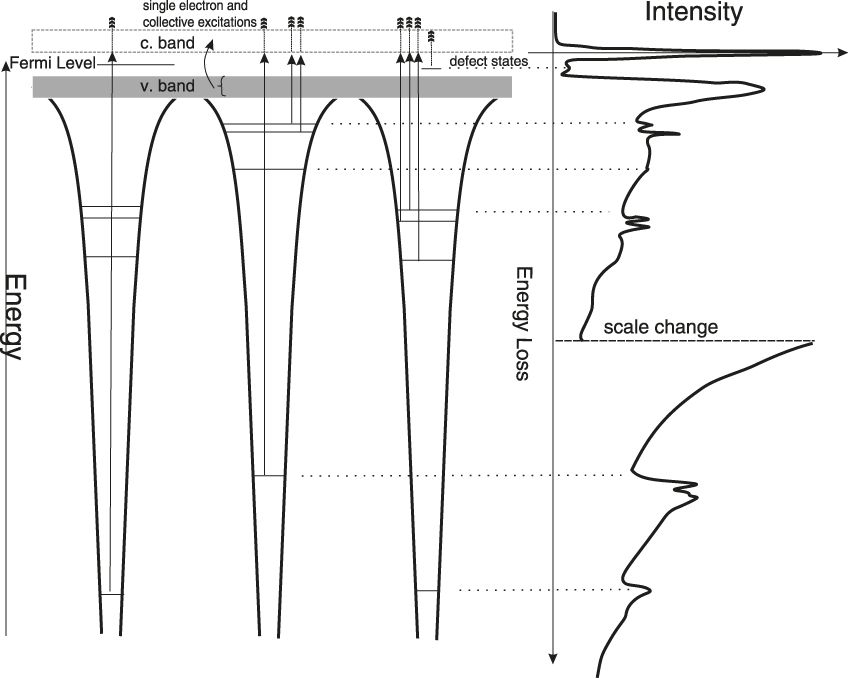
When incident electrons in the electron microscope penetrate a thin sample (usually in the range of 5 nm up to 100–200 nm thickness), a number of signals are generated (Figure 1). Through the excitation process, incident electrons lose a fraction of their energy given to single electrons, now excited from their respective energy levels either onto the continuum or in the bound unoccupied energy levels. Energy losses through collective phenomena (known as plasmon resonances) are also possible and, in fact, contribute to the most intense part of the electron energy-loss spectrum seen in the first 50–100 eV of energy loss (Figure 2). These latter excitations probe the dielectric response of the solid to the swift electrons and, as described in detail in the review by Kociak and García de Abajo in this issue, can be used to probe locally the electromagnetic density of states in nanostructures and to complement the spectroscopy information retrieved with optical absorption and cathodoluminescence.
Schematic diagram of the signals generated when an incident electron is transmitted through a thin sample in the transmission electron microscope.

Schematic diagram of an electron energy-loss spectrum with the various features at low energy losses (shallow single electron transitions and collective resonances) and core losses arising from the excitation of electrons from core levels to the unoccupied electronic states above the Fermi level. The left panel shows the energy diagram in a solid, while the right panel shows the simplified energy-loss spectrum with the features corresponding to the energy required for the excitation from a core level of two different atomic species. Note: c. band, conduction band; v. band, valence band.
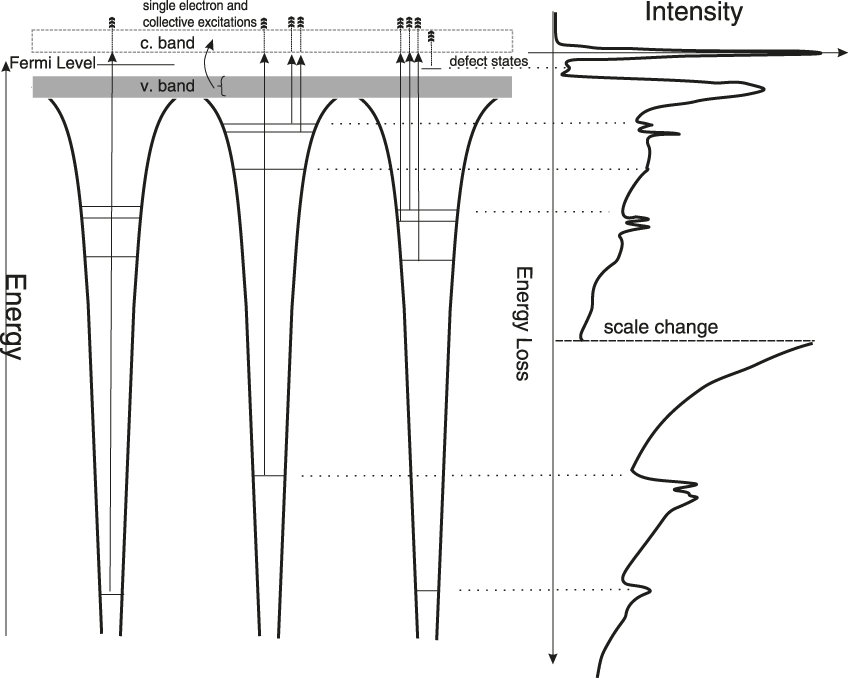
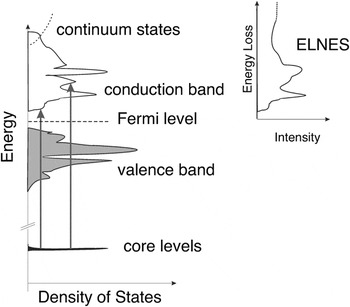
The single electron excitation from core levels will be the focus of our attention, as they provide much more local information on the electronic structure. The incident electron causes the ejection of the core electron onto the first unoccupied energy states above the Fermi energy (Figure 2). The magnitude of the energy losses is therefore directly related to the ionization energy but will also include the kinetic energy of the ejected electrons. As in the case of photoelectron spectroscopy, any energy change in the core level energy will be reflected in a change of the ionization edge energy. Thus, EELS provides, through the edge energy, valence state information. Differences in the absolute energy of edges, with respect to the x-ray photoelectron spectroscopy (XPS) peaks, however, will result from the fact that the work function affects the XPS peaks, while for EELS, the edges reflect the difference in energy level between the core level and the first unoccupied bound states. It is illuminating to consider a more detailed energy diagram to highlight the spectroscopic sensitivity of the so-called electron energy loss near-edge structures (ELNES), the modulations in the shape of the ionization edges measured in the energy-loss spectrum (Figure 3) visible in the first 10–30 eV from the edge threshold.
Schematic diagram showing the origin of the energy loss near-edge structures (ELNES) with respect to the distribution of density of states in a solid. The ELNES reflects transitions to the unoccupied states modified by the interaction with the core-hole generated following the excitation.

The excitation involves electrons that have reached bound unoccupied states that reflect a modulation in the local density of states. The electronic states probed by the ejected electrons, however, do not simply reflect the total density of states of the solid. Based on the fact that the excitation corresponds to a transition from an initial core level to a final state, transition selection rules must be obeyed, and the spectrum will only reflect the local (i.e., site decomposed and symmetry projected) density of states. Any changes in the local density of states will thus be reflected in changes in the ELNES.
The selection rules for the transition from a core level to an unoccupied final state thus impose that there must be a change in angular momentum quantum number ∆ℓ = ±1. For example, the excitation from the 1s level imposes that there be change in the angular momentum quantum number, and the ejected electron only probes the unoccupied states of a p-like character. For a transition from a 1s level (labeled spectroscopically as a “K edge”), the schematic ELNES spectrum in Figure 3 would thus reflect the p-like components of the unoccupied density of states. For a transition from a 2p level (labeled spectroscopically as a “L2,3 edge”), it would reflect the 3s and 3d final states (although strongly modified due to the strong interaction between the core-hole and narrow atomic-like 3d bands). In the case of carbon-based compounds with sp 3 hybridization as in diamond or with sp 2 as in carbon nanotubes, graphite, or graphene, the ELNES is dramatically different, reflecting the change in hybridization and coordination of the carbon atoms.Reference Garvie, Craven and Brydson11, Reference Fallon and Brown12 It is also important to point out that the ELNES provides very similar information to x-ray absorption near-edge structures (XANES), the main difference with this technique being that in EELS, only detection in transmission mode is possible, while in XANES, detection in transmission, fluorescence yield, and total electron yield can be used. In XANES, therefore, depending on the acquisition method, the spectra may be more surface-sensitive and may differ from the EELS spectra. A comparison of some EELS and x-ray absorption spectroscopy (XAS) spectra will be shown further in this article.
Overall, we can recognize two regions of the ionization edges. In the first few 10–20 eV from the edge threshold, the excited electron, due to its low kinetic energy, probes the local bonding environment similar to a valence or conduction electron propagating in the potential of the solid. At high kinetic energy, further away from the edge threshold, the scattering probability increases (the mean free path of the photoelectron decreases up to an energy of about 10 eV), and the ejected electron scatters from the closest neighboring atoms. Similar to extended x-ray absorption fine structures in x-ray absorption spectroscopy, the extended energy-loss fine structures at about 30–50 eV and above the ionization threshold provide information on the interatomic distances and radial distribution function around the excited atom. The sensitivity to electronic structure is also demonstrated in much more complex systems than pure compounds, particularly in transition metal oxides, where by combining electronic structure calculations and experimental spectra, it is possible to fully understand the origins of the features in the spectra. Arguably, the most fascinating information deduced in the ELNES studies of oxides (as in the case of XANES) is the fact that the spectra show the strong hybridization between the transition metal cations and the oxygen anions.
An early example of the powerful combination of theory-experiments in oxides with highly correlated electrons is the work on NiO.Reference Dudarev, Botton, Savrasov, Humphreys and Sutton13 The comparison between the experimental O K edges and calculations of spectra with the local spin-density approximation,Reference Dudarev, Botton, Savrasov, Humphreys and Sutton13 including an energy term U representing the interaction between the 3d electrons (the Hubbard energy), showed good agreement with experiments in the first 10 eV from the edge threshold. These results demonstrated that the Hubbard energy term that provides the best agreement in the spectra also provides the best match with ground state properties, such as bulk modulus and the correct bandgap. More recent results on Sr3Cr2O8,Reference Radtke, Saul, Dabkowska, Luke and Botton14 another fascinating material with highly correlated electrons, suggest that inclusion of the exchange energy in the electronic structure calculations of the ground properties provides excellent agreement with the experimental data (both oxygen K edge spectra and magnetic properties). These results indicate that there is a strong sensitivity of the spectral features to the changes in the electronic structure and, ultimately, the properties of the solid. More importantly, the results also suggest that even if the experimental technique probes unoccupied electronic states, ELNES are extremely powerful tools in the arsenal to study complex electronic structure effects occurring at the atomic level in materials. This capability opens the prospect not only to study bulk solids but also to study defects and interfaces, as shown with many examples in recent years. Further details on the fundamentals of ELNES and various methods of calculations can be found in an extensive recent review.Reference Radtke, Botton, Nellist and Pennycook10
Instrumentation advances
The energy lost by the electrons scattered in the sample is measured relative to the incident electron energy. These electrons are dispersed in the magnetic field of an energy-loss spectrometer that is located past the sample. Detailed reviews, descriptions, and comparisons of the spectrometer technologies (for example, in-column and post-column filters) can be found elsewhere,Reference Botton, Hawkes and Spence9 but it is worth highlighting the benefits of the new developments in high-resolution electron monochromators that significantly enhance the spectroscopic capabilities of the technique. As an example, the energy distribution of the electrons emitted from a Schottky source is significantly narrowed from 0.5 eV in a stable microscope and high-resolution energy-loss spectrometer to about 0.1 eV at operating voltages of 300 keV, as measured by the full-width at half-maximum of the energy distribution. A comparison of the monochromated electron beam energy distribution with a cold field-emission sourceReference Lazar, Botton and Zandbergen15 highlights the symmetry of the energy distribution and the lower normalized intensity of the monochromated source, particularly in the first 3 eV loss, where measurements of the optical response of the solid, including bandgap measurementsReference Lazar, Botton, Wu, Tichelaar and Zandbergen16–Reference Stöger-Pollach19 and surface plasmon polariton distributions, can be carried out even to energies as low as 0.5 eVReference Rossouw, Couillard, Vickery, Kumacheva and Botton20 without numerical deconvolution techniques.
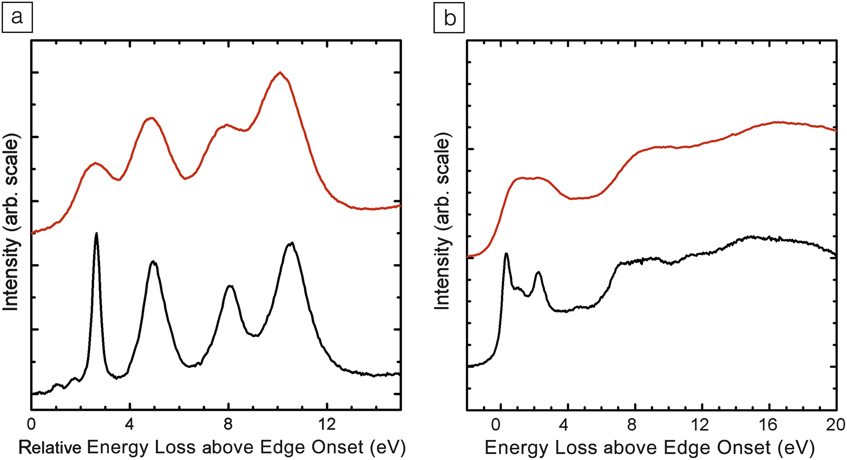
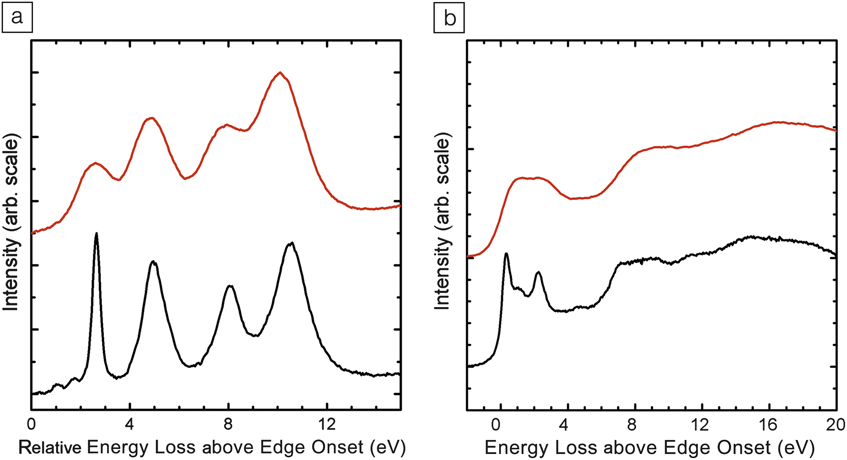
With an electron monochromator, there are significant improvements in the visibility of ELNES features. As an example, the Ti L2,3 edges of CaTiO3 and C K edges in C70 fullerenes clearly show the dramatic enhancement of the visibility of spectral features (Figure 4).
(a) Ti L2,3 edge in CaTiO3 with (black line) and without the monochromator (red line). (b) C K edge in C70 with (black line) and without the monochromator (red line) adapted from Reference Reference Nicholls, Pankhurst, Botton, Lazar and Cockayne21. Use of an electron monochromator dramatically enhances the visibility of spectral features.
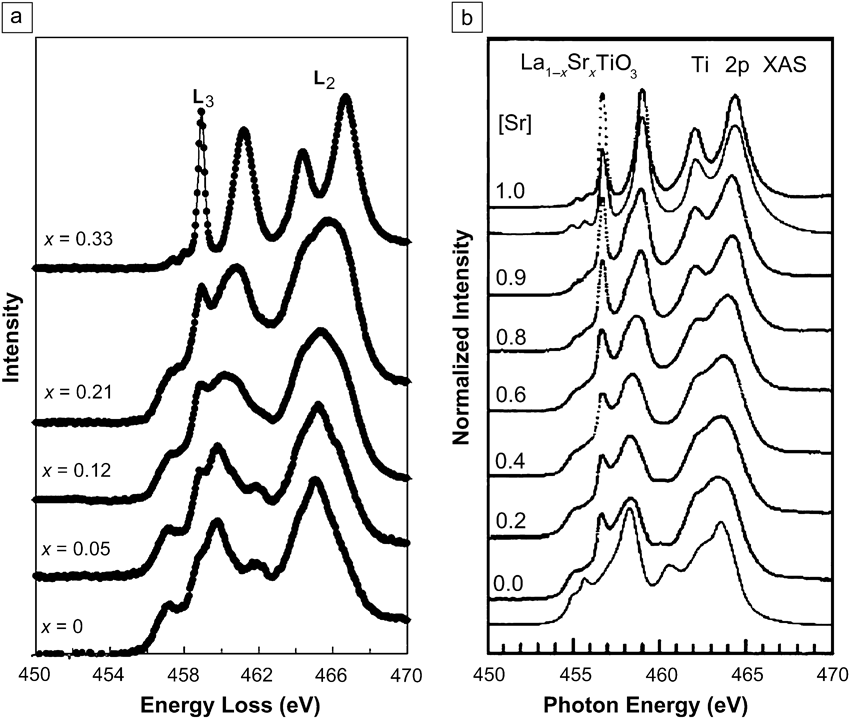
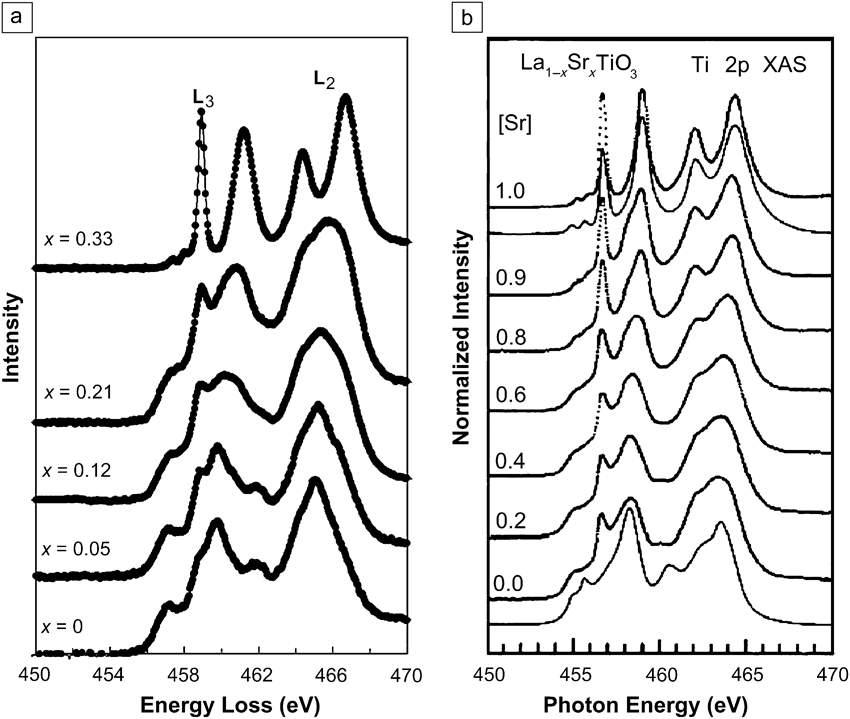
A comparison with x-ray absorption data in a series of perovskite structures (Nd1–xTiO3 and La1–xSrxTiO3) also shows the change in the valence state of Ti (Figure 5).Reference Sefat, Amow, Wu, Botton and Greedan22 The quality of the Ti L2,3 edge in the EELS spectra can be favorably compared to the Ti L2,3 edges recorded with XAS on equivalent compounds, where the valence is also changed through doping.Reference Abbate, de Groot, Fuggle, Fujimori, Tokura, Fujishima, Strebel, Domke, Kaindl, van Elp, Thole, Sawatzky, Sacchi and Tsuda23 Significant advantages, with respect to XAS, however, result from the ability to use a very fine electron probe in the order of the nanometer range with the first-generation instrumentsReference Lazar, Botton, Wu, Tichelaar and Zandbergen16 and, more recently, with the advent of aberration correctors, the capability of mapping these fine structures with electron beams as small as 1Å, as shown later. These capabilities also show that the local electronic structure features and changes to coordination due to inequivalent chemical sites can be probed.
(a) Electron energy-loss spectrum (EELS) Ti L2,3 edges in Nd1–xTiO3,Reference Sefat, Amow, Wu, Botton and Greedan22 (b) x-ray absorption spectroscopy (XAS) Ti L2,3 edges in equivalent compound La1–xSrxTiO3 from Reference Reference Abbate, de Groot, Fuggle, Fujimori, Tokura, Fujishima, Strebel, Domke, Kaindl, van Elp, Thole, Sawatzky, Sacchi and Tsuda23. Using a monochromator, both EELS and XAS detect the fine-structure features necessary to demonstrate a valence change.
Spectrum imaging applications
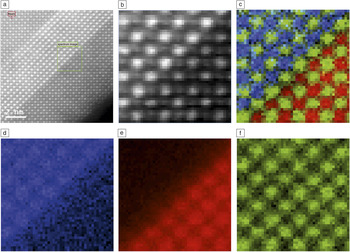
The ability to record a full energy-loss spectrum at every pixel using EELS spectrum imaging significantly enhances the ability to extract more reliably the intensities of weak signals, often recorded with an acquisition time as short as a few tens of msec. Examples of atomic-resolved EELS maps have been demonstrated on microscopes equipped with cold-field emission sources.Reference Kimoto, Asaka, Nagai, Saito, Matsui and Ishizuka24–Reference Muller, Kourkoutis, Murfitt, Song, Hwang, Silcox, Dellby and Krivanek26 With high-brightness Schottky sources and aberration-corrected microscopes, elemental mapping has been shown even at low accelerating voltages.Reference Botton, Lazar and Dwyer27, Reference Lazar, Shao, Gunawan, Nechache, Pignolet and Botton28 As an example of atomic-resolved mapping, spectrum imaging of the interface between BaTiO3/SrTiO3 is shown (Figure 6). The elemental maps show the detection of a chemically sharp interface, but the detailed intensity profiles of the Sr and Ba signals and simulations using the inelastic multi-slice method highlight that for the interface, half of the recorded intensity 4Å away from the interface originates from neighboring columns.Reference Botton, Lazar and Dwyer27 Detailed measurements of elemental maps in reference compounds such as LaB6 also show that the detailed intensity distribution measured from the inelastic scattering event cannot be simply interpreted by inspection,Reference Lazar, Shao, Gunawan, Nechache, Pignolet and Botton28 and detailed simulations, as discussed in this issue by Allen et al., must be carried out. Collection conditions (collection apertures, convergence angle) thus strongly affect the intensity distribution observed in maps so much so that atoms may appear at the “wrong” position. As discussed by Allen et al., it is therefore important to support experimental data with theoretical calculations as much as possible, particularly at the limits of resolution of the technique.
High-resolution elemental maps of the interface between BaTiO3 and SrTiO3 showing the change in local composition from an abrupt interface.Reference Botton, Lazar and Dwyer27 (a) High-angle annular dark field (HAADF) image showing the field of view and detailed region mapped, framed by a square. (b) HAADF signal from the region of interest. (c) Color coded map for Ti (green), Ba (blue), Sr (red), and respective maps for (d) Ba, (e) Sr, and (f) Ti.Reference Botton, Lazar and Dwyer27 The framed box in (a) is the area where the spectrum imaging was carried out. (Sample courtesy of C. Jia, Ernst Ruska Centrum, Jülich.)

The atomic resolution imaging capability, combined with the sensitivity to bonding, can be put to use to study local electronic structure changes. The first example provided here is related to the study of multiferroic BiFeCrO3 synthesized so as to exhibit an ordered layered structure.Reference Gautreau, Harnagea, Pintille, Alexe and Pignolet29 Elemental mapping shows that Fe and Cr layers are separated by rock salt–type Bi-O layers, as deduced from high-angle annular dark-field imaging.Reference Lazar, Shao, Gunawan, Nechache, Pignolet and Botton28 The O K edge signals in the structure demonstrate that within the unit cell containing the transition metal layers and the Bi layers, there are two clearly distinct near-edge structures, and the intensity of the different features can be mapped across several unit cells (Figure 7). These results demonstrate that ELNES detects at least two inequivalent oxygen sites, one of them within the Bi-containing layer and one in the transition metal oxide layers.
High-angle annular dark-field scanning transmission electron microscopy image of a BiFeCrO3 multiferroic layered oxide and O K edge spectra extracted from the elemental map showing two distinct energy loss near-edge structures (adapted from Reference Reference Lazar, Shao, Gunawan, Nechache, Pignolet and Botton28). P1 and P2 are the two first peaks on the energy-loss near edge fine structure of the O K edge, representing the hybridization between the transition metal atoms and oxygen atoms. This result shows the very important changes in the spectra from two inequivalent sites (shown as dark layers in the octahedral sites and shown as bright layers in the rock salt sites). O1 and O2 correspond to two O K edge spectra extracted from the two inequivalent sites in the structure. The two peaks at around 580 eV are the CrL2,3 edges.

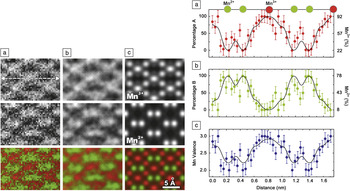
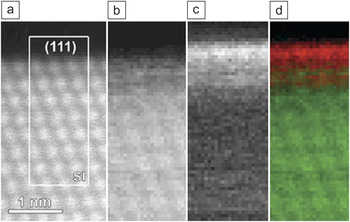
Other similar examples in oxides have also been reported in the literature recently from the Oak Ridge National Laboratory group.Reference Gazquez, Luo, Oxley, Prange, Torija, Sharma, Leighton, Panteledes, Pennycook and Varela30 Examples of atomically resolved ELNES capabilities were also shown by Haruta et al. at Kyoto University, who studied oxides with the double perovskite La2CuSnO6Reference Haruta, Kurata, Komatsu, Shimakawa and Isoda31 and BrownmilleriteReference Haruta, Kurata, Matsumoto, Inoue, Shimakawa and Isoda32 structures, both presenting layers of octahedra with interstitial rare-earth atoms, where two inequivalent oxygen ion sites are present. In the STEM group at Cornell University, large-scale spectrum imaging has also been used to study the change in valence at interfaces.Reference Fitting Kourkoutis, Lee, Song, Hwang, Schlom and Muller33–Reference Fitting Kourkoutis35 In some of this work, statistical analysis methods were used to identify the spectroscopic components on the spectrum image data sets. For example, in EuTiO3 films grown on DyScO3, statistical analysis of the spectra showed that the valence of Eu atoms, within one atomic layer from the interface, increases with respect to the valence in the EuTiO3 films.Reference Fitting Kourkoutis, Lee, Song, Hwang, Schlom and Muller33 These different spectral components were subsequently mapped and showed that all along the interface with the substrate, the higher valence Eu component dominates. Very recently, the Electron Microscopy for Materials Science group in Antwerp, Belgium, showed the application of spectroscopic imaging in the study of the valence distribution of Mn atoms in Mn3O4 and detected the inequivalent Mn2+ and Mn3+ sites (Figure 8).Reference Tan, Turner, Yücelen, Verbeeck and Van Tandeloo36 Two-dimensional maps and line profiles, including quantitative error analysis, showed that it is possible to resolve the valence of Mn at atomic resolution and spectroscopic sensitivity. A similar example in the area of catalysis also showed that the valence of Ce atoms on the surface of CeO2–x nanoparticles is Ce3+, while the valence in the core of the same particles is Ce4+ (Figure 9).Reference Turner, Lazar, Freitag, Egoavil, Verbeeck, Put, Strauven and Van Tandeloo37
Left panel: Energy loss near-edge structures maps of the valence for Mn ions in Mn3O4: (a) raw data, (b) smoothed data, and (c) simulations for Mn3+ (top row), Mn2+ (middle row), and color coded map with Mn3+ in red and Mn2+ in green (bottom row). Right panel: One-dimensional valence profiles extracted from the dashed line highlighted in the left panel, (a) top row, with statistical errors showing the spatial distribution of the valence component A (Mn3+ in red (plot a) and valence component B (Mn2+ in green (plot b) and the Mn valence plot in Mn3O4 (from plot c).Reference Tan, Turner, Yücelen, Verbeeck and Van Tandeloo36

(a) Atomic resolution high-angle annular dark field image of the edge of a CeO2–x nanoparticle corresponding to a (111) surface, (b) corresponding energy loss near-edge structures (ELNES) Ce4+ map, (c) corresponding ELNES Ce3+ map, (d) color coded combined map showing the relative position of the Ce4+ (green) and Ce3+ (red) (adapted from Reference Reference Turner, Lazar, Freitag, Egoavil, Verbeeck, Put, Strauven and Van Tandeloo37). The framed area labeled SI in (a) is the region where the spectrum imaging was carried out.

Summary
Electron energy-loss spectroscopy (EELS) and the new instrumentation that provides both high spectroscopic resolution and high spatial resolution are extremely powerful techniques to characterize materials. As demonstrated in a non-exhaustive list of examples presented here, spectroscopic mapping with EELS is already changing the way researchers study materials. The spectroscopic capability with atomic resolution dreamed about for the future is finally providing unprecedented insight into structure and bonding in materials today.
Acknowledgments
The author is grateful to several current and past collaborators who have been involved in published original work presented here or for providing samples used in that work, in particular, S. Lazar, H. Zandbergen, L. Gunawan, Y. Shao, A. Pignolet, R. Nicholls, G. Radtke, and C. Jia. Some of the work presented here was carried out at the Canadian Centre for Electron Microscopy, at McMaster University, Ontario, and Delft University of Technology (TUD). In particular, the author is indebted to Professor H. Zandbergen for access to the TUD instrument and NWO funding. Finally, the author is grateful to the Natural Sciences and Engineering Research Council of Canada for supporting his research.